On mechanism of formation of SBA-15/furfuryl alcohol-derived mesoporous carbon replicas and its relationship with catalytic activity in oxidative dehydrogenation of ethylbenzene
Bạn đang xem bản rút gọn của tài liệu. Xem và tải ngay bản đầy đủ của tài liệu tại đây (2.75 MB, 13 trang )
Microporous and Mesoporous Materials 299 (2020) 110118
Contents lists available at ScienceDirect
Microporous and Mesoporous Materials
journal homepage: />
On mechanism of formation of SBA-15/furfuryl alcohol-derived
mesoporous carbon replicas and its relationship with catalytic activity in
oxidative dehydrogenation of ethylbenzene
Paula Janus a, Rafał Janus b, c, *, Barbara Dudek a, Marek Drozdek a, Ana Silvestre-Albero d,
Francisco Rodríguez-Reinoso d, Piotr Ku�strowski a
a
Jagiellonian University, Faculty of Chemistry, ul. Gronostajowa 2, 30-387, Krak�
ow, Poland
AGH University of Science and Technology, Faculty of Energy and Fuels, al. A. Mickiewicza 30, 30-059, Krakow, Poland
c
AGH University of Science and Technology, AGH Centre of Energy, ul. Czarnowiejska 36, 30-054, Krakow, Poland
d
Universidad de Alicante, Departamento de Química Inorg�
anica, Apartado 99, E-03080, Alicante, Spain
b
A R T I C L E I N F O
A B S T R A C T
Keywords:
CMK-3
CMK-5
Nanocasting
Oxidative dehydrogenation of ethylbenzene
Styrene
A series of CMK-3-like carbon replicas was synthesized by precipitation polycondensation of furfuryl alcohol in
an aqueous slurry of SBA-15 at a polymer/SiO2 mass ratio of 0.50–2.00. Changes in textural and structural
parameters of SBA-15 after polymer deposition were studied by N2 adsorption and X-ray diffraction. Morphology
of the replicas was investigated by transmission electron microscopy, while their surface composition was
determined by temperature-programmed desorption and X-ray photoelectron spectroscopy. The mechanism of
deposition of poly(furfuryl alcohol) (PFA) onto silica surface was elucidated. It was found that PFA accumulates
in SBA-15 pores randomly; certain channels are completely filled, while others remain partially empty. The
incomplete filling of mesopores results in “pseudo-CMK-3” structures featuring the bimodal porosity (the typical
mesopores of CMK-3 are accompanied by broader ones formed by the coalescence of adjacent partially hollow
pores). The total filling of pores with PFA leads to the formation of good-quality CMK-3. The carbon replicas
exhibited the presence of abundant amounts of superficial oxygen-containing moieties. These entities are
responsible for high activity of the materials in the oxidative dehydrogenation (ODH) of ethylbenzene, bringing
evidence supporting the mechanism of active coke, considered as governing the catalytic performance of carbon
materials in ODH of alkanes.
1. Introduction
Over the recent two decades, ordered mesoporous carbon materials
(OMCs) have been extensively studied by many researchers due to their
unusual, beneficial properties, which surpass the features of conven
tional microporous activated carbons (AC). The highly ordered,
adjustable porous structure of OMCs, exhibiting negligible diffusion
limitations and the surface properties similar to AC, open up the op
portunity to use them in plenty of applications. Indeed, nowadays, the
OMC materials are omnipresent in almost all the chemistry-related sci
entific fields, including catalysis, adsorption, electrochemistry, solar
technology, medicine, pharmacy, and microbiology [1–6]. Among the
OMCs, the family of CMK-n carbon replicas reported for the first time in
1999 and further developed by the researchers from KAIST, is of a
special interest [7,8]. The CMK-n materials are synthesized by the
nanocasting strategy, which involves the use of an ordered porous ma
trix (usually silica) serving as the structure-directing agent (so-called
hard template). After filling the pore system of the matrix with a carbon
precursor (i.e. sucrose, aromatic hydrocarbons, polymers), followed by
carbonization and etching of the mineral matrix, the resulting carbon
framework shows the negative (inverse) structure of the applied silica.
Therefore, morphology, structure, and textural characteristic of the ul
timate replica are governed by the geometry and size of channels in the
starting SiO2 template, as well as a level of its pore filling with a carbon
precursor and homogeneity of the incorporated polymer material.
Generally, when it comes to accumulation of the polymer, two scenarios
are possible. In the first case, a carbon precursor cladding an inner
surface of silica matrix forms a homogeneous film. As a consequence, the
* Corresponding author. AGH University of Science and Technology, Faculty of Energy and Fuels, al. A. Mickiewicza 30, 30-059, Krakow, Poland.
E-mail address: (R. Janus).
/>Received 27 January 2020; Accepted 19 February 2020
Available online 22 February 2020
1387-1811/© 2020 The Authors. Published by Elsevier Inc. This is an open access article under the CC BY license ( />
P. Janus et al.
Microporous and Mesoporous Materials 299 (2020) 110118
ultimate replica is constituted of hollow carbon nanopipes merged by
thinner carbon bridges. Such structure cast from SBA-15 is known as the
CMK-5 material. The second variant involves a complete filling of silica
mesopores resulting in a formation of bulky carbon nanorods in the ul
timate replica. In this case, the CMK-3 framework is formed [9].
Both CMK-3 and CMK-5 replicas, synthesized by nanoreplication of
the honeycomb pore structure of SBA-15 mesoporous silica with the
p6mm space group, show the same 2D hexagonal array of carbon
nanorods or nanopipes, respectively. The entire framework of the replica
is merged by the carbon bridges formed in narrower meso- and micro
pores present in the silica matrix [10]. The more often studied CMK-3
replica is typically characterized by BET specific surface area of
1000–1500 m2/g, homogeneous pore system, uniform in a size of ca.
3.0–3.5 nm, and total pore volume of ca. 1.0–1.5 cm3/g [10–12]. As the
more subtle, the openwork structure of CMK-5 is built of the carbon
nanopipes, in which the primary mesopores between the adjacent tubes
are accompanied by the additional fraction of the mesopores (usually
larger) present inside these tubes [13]. The CMK-5 materials exhibit a
higher surface area (>2000 m2/g) and total pore volume (up to ca. 2.5
cm3/g) compared to the analogous CMK-3 carbons [14,15]. Such
textural parameters make CMK-5 excellent host material for supporting
of nanoparticles in a variety of advanced functional materials [16,17].
The overall procedure used for the synthesis of both CMK-3 or CMK-5
replicas relies on four essential steps: (i) preparation of a SBA-15 silica
template, (ii) deposition of a carbon precursor in the pore structure of
SBA-15, (iii) carbonization of the polymer/silica composite, and (iv)
removal of the silica matrix [18]. The structure of resulting materials
may be precisely tailored by a careful adjustment of synthesis condi
tions. There is a variety of synthesis procedures reported in the litera
ture. However, a majority of differences in these strategies refer to the
step of carbon precursor deposition. The pioneering synthesis of CMK-3
material reported by Jun et al. [10] involved incipient wetness
impregnation of SBA-15 template with an acidified solution of sucrose,
followed by an acid-catalyzed polymerization of sugar, subsequent
carbonization at 900 � C, and etching of silica with a HF or NaOH solu
tion. Fuertes et al. [9,19,20] reported the synthesis of CMK-3 replica by
incipient wetness impregnation or, alternatively, chemical vapor depo
sition (CVD) of furfuryl alcohol (FA) as the carbon precursor into the
pore system of SBA-15 impregnated initially with p-toluenesulfonic acid
(a polymerization catalyst). Using acetonitrile and styrene as the carbon
precursors in the CVD method was tested by Xia et al. [21–23]. It was
shown that this procedure enabled to control precisely morphology,
pore size, and degree of graphitization of the resulting carbons [21,24].
Another method reported in the synthesis of CMK-3 carbon replica
consists in chemical interaction of a carbon precursor with intrinsic
surface entities of siliceous matrix. This approach was developed by
Yokoi et al. [25], whom described accumulation of FA based on its
esterification with superficial SBA-15 silanol groups (i.e. chemical
anchoring of polymer chains by a formation of polymer-silica covalent
bonds).
In order to synthesize CMK-5 successfully, several pivotal parameters
have to be appropriately adjusted: (i) porosity and surface composition
of a silica matrix, (ii) selection of a suitable type of carbon precursor and
its amount used, (iii) strategy of homogeneous incorporation of carbon
precursor into silica mesochannels, (iv) temperature and duration of the
synthesis, (v) type of a catalyst of polyreaction and method of its
introduction, and (vi) carbonization conditions (heating rate, tempera
ture, time, and kind of atmosphere) [9,26–31]. Interestingly, the
carbonization under vacuum [28] and the use of a non-polar solvent
during the FA polycondensation [29] were recognized as additional
factors determining (or facilitating) the successful formation of CMK-5
framework. Joo et al. [26] synthesized originally the CMK-5 carbon
replica by the introduction of FA into Al-containing SBA-15 (Si/Al molar
ratio of 20) using the incipient wetness technique. In this approach, the
wall-incorporated Al3ỵ centres served as Lewis acid sites catalyzing FA
polycondensation.
In our previous paper [18], we reported a new facile method of
synthesis of CMK-3 carbon replica based on Brønsted acid-catalyzed
precipitation polycondensation of FA in the pore system of SBA-15.
The synthesis was carried out in a FA-containing water slurry of the
silica matrix in the presence of hydrochloric acid. Thus, it was proven
that the deposition of the carbon precursor takes place regardless of
whether the catalyst is immobilized onto the surface of the silica walls or
not. The promising results inspired us to deepen the study on the
mechanism of formation of polymeric films/rods inside the SBA-15
pores with an increasing carbon precursor content. Herein, we
describe the synthesis of a series of CMK-like materials using SBA-15
with mesopores size (ca. 8 nm) wider than typically at different
PFA/SBA-15 mass ratios. Such approach allowed us to investigate in
details the evolution of textural and structural features of the carbon/
silica composites and the corresponding carbon replicas. Finally, chosen
carbon replicas were tested as catalysts in the oxidative dehydrogena
tion of ethylbenzene. It was found that the promising catalytic perfor
mance of the studied materials surpassing the formerly studied activated
carbons and carbon nanotubes, arises from their favorable surface
chemistry, namely the presence of phenolic and carbonyl/quinone
moieties. These beneficial entities are formed when the freshly
carbonized PFA/SBA-15 composite comes into contact with air.
2. Experimental section
2.1. Synthesis
All reagents and solvents were commercially available and used
without further purification: poly(ethylene oxide)-block-poly(propylene
oxide)-block-poly(ethylene oxide) copolymer (Pluronic P123,
EO20PO70EO20, Sigma-Aldrich), tetraethyl orthosilicate (TEOS, 99.0%,
Sigma-Aldrich), furfuryl alcohol (FA, 98%, Sigma-Aldrich), hydrochlo
ric acid (HCl, 33%, Avantor Performance Materials Poland), hydroflu
oric acid (HF, 40%, Avantor Performance Materials Poland), and
ethylbenzene (EB, 99.8%, Sigma-Aldrich).
2.1.1. SBA-15
Mesoporous SBA-15 silica was synthesized at a molar gel composi
tion of 1.00 TEOS: 0.02 Pluronic P123: 2.94 HCl: 116.46 H2O, according
to the procedure adapted from the paper by Michorczyk et al. [32]. In
order to obtain a material with larger pores, this procedure was slightly
modified. Namely, after TEOS hydrolysis, the obtained precipitate was
subjected to the aging process at higher temperature (100 � C) and for
prolonged time (72 h) when compared to the typical procedure (15–24
h at 80–90 � C) (details described in Supplementary Information) [18,
32–34]. Furthermore, a small portion of the as-made material (ca. 0.40
g) was subjected to calcination using the same temperature regime as
during the thermal treatment of the PFA/SBA-15 composites, as
described later on (850 � C for 4 h at a heating rate of 1 � C/min, nitrogen
atmosphere, 40 cm3/min). This sample was marked as SBA-15_850.
2.1.2. Carbon replicas
A series of carbon replicas was synthesized by the acid-catalyzed
precipitation polycondensation of various amounts of FA in an
aqueous slurry of the silica template, according to the procedure
described in our former paper [18]. Briefly, an amount of 3.00 g of
freshly calcined SBA-15 was added under stirring to a mixture of FA and
distilled water in a three-neck round-bottom flask (250 cm3) placed in
an oil bath on a magnetic stirrer and equipped with a reflux condenser.
The intended mass ratio of FA/silica ranging within 0.50–2.00 (namely
0.50, 1.00, 1.25, 1.50, and 2.00) was adjusted by the amount of
monomer used. The total mass of distilled water together with monomer
was kept constant at 100.00 g for each synthesis batch. The mixture of
SBA-15 immersed in FA ỵ H2O was agitated at room temperature for 30
min, and then HCl was introduced dropwise at the HCl/FA molar ratio of
6.0. After the mixture was heated to 100 � C, the reaction system was
2
P. Janus et al.
Microporous and Mesoporous Materials 299 (2020) 110118
isothermally held for next 6 h under vigorous stirring (400 rpm). The
resulting brown solid, being the composite of poly(furfuryl alcohol)
(PFA) and SBA-15 (PFA/SBA-15), was then isolated, washed with
distilled water and dried at room temperature overnight. The
as-synthesized composites were marked as PFA/S-x, where x suffix
means the intended PFA/SBA-15 mass ratios. The PFA/S-x composites
were carbonized in a tubular furnace under a N2 atmosphere (40
cm3/min) at 850 � C for 4 h at a heating rate of 1 � C/min. Finally, the
silica template was removed by etching with 5 wt% HF solution at room
temperature for 90 min (30.0 cm3 of HF solution was used per 1.00 g of a
solid). The procedure was repeated twice. The carbonized PFA/SBA-15
composites and corresponding replicas were labelled as C/S-x and C-x,
respectively.
SiO2 with regard to single-point total pore volumes of the SBA-15 ma
trix, assuming the density of bulky PFA equal to 1.55 g/cm3 [38]. The
same TG equipment was used to perform the experiment simulating the
process of carbonization with subsequent air exposure, followed by
temperature-programmed desorption under the respective atmospheres
(nitrogen or air; both at a flow rate of 100 cm3/min).
Transmission electron microscopy (TEM) images were taken with a
JEOL microscope (model JEM-2010) equipped with an INCA Energy
TEM 100 analytical system and a SIS MegaView II camera, working at
the accelerating voltage of 200 kV. Prior to the imaging, samples were
suspended in ethanol and placed on copper grids with a carbon film
support (LACEY).
Temperature-programmed desorption (TPD) experiments were car
ried out using an U-shaped quartz reactor coupled directly to a quad
rupole mass spectrometer (Balzer MSC 200). An amount of 100 mg of a
sample was heated from 20 � C to 1000 � C at a heating rate of 10 � C/min
under a helium flow (50 cm3/min; grade 5.0). The quantities of evolved
CO and CO2 were calculated after calibration based on calcium oxalate
decomposition [39]. The TPD profiles were deconvoluted according to
the Gauss formalism.
X-ray photoelectron spectroscopy (XPS) measurements were per
formed with a Prevac photoelectron spectrometer equipped with a
hemispherical analyzer VG SCIENTA R3000. The spectra were recorded
using a monochromatized aluminum source Al Kα (E ¼ 1486.6 eV). The
base pressure in the analytical chamber was 5⋅10À 9 mbar. The binding
energy scale was calibrated using the Au 4f7/2 line of a cleaned gold
sample at 84.0 eV. The surface composition of carbon materials was
studied based on the areas and binding energies of C 1s and O 1s core
levels. The spectra were fitted using the CasaXPS software (Casa Soft
ware Ltd.).
2.2. Characterization methods
Textural parameters of the materials were determined by means of
low-temperature adsorption-desorption of nitrogen (À 196 � C). The
isotherms were collected using an ASAP 2020 instrument (Micro
meritics). Prior to the analyses, the samples were outgassed at 350 � C for
5 h under vacuum. The Brunauer–Emmett–Teller model was used to
calculate specific surface areas (SBET) (within p/p0 ¼ 0.05–0.20). The
external surface (Sext.) was computed based on the slopes of linear
functions fitted to αs plots in the range of αs ¼ 1.70–2.50. The micropore
surface (Smicro) was assessed based on the t-plot model (de Boer equation
at p/p0 ¼ 0.05–0.20). Two models, namely non-local density functional
theory (NLDFT; adsorption branch of isotherm, cylindrical pore sym
metry assumption), and quenched solid density functional theory
(QSDFT; equilibrium model, slit pore geometry), were employed for
calculation of pore size distributions (PSDs) (the first one for the pristine
silicas, and PFA/SBA-15 carbonizates, while the latter one for the carbon
replicas). The total pore volumes (Vtotal) were extracted from the
adsorption branches of the isotherms based on the respective data points
at p/p0 ¼ 0.97–0.98 (single-point algorithm; s-p). The micropore vol
umes (Vmicro) were calculated by the αs-plot method within the range of
αs ¼ 0.50–0.80. For this purpose, the reference macroporous silica
LiChrospher (for pure silicas and carbonizates) [35], and non-porous
carbon LMA10 [36] (for final replicas) were used. In the case of the
replicas with the bimodal mesoporosity, the primary and secondary
mesopore volumes (Vmeso I, and Vmeso II, respectively) were computed
based on Lorentz deconvolution of QSDFT pore size distribution profiles.
A wall thickness of pure silicas (wsil.) was calculated by subtracting a
respective a100 lattice parameter (determined by XRD) and mean mes
opore NLDFT diameter (D) (Supplementary Information, Eq. (S1)). The
diameters of carbon nanorods in the replicas (wcarb.) were assessed by
the simple geometrical model proposed by Joo et al. [37], while the
respective mesopore widths (D) were additionally estimated (for the
comparative purposes with QSDFT) from the expression reported by the
same authors (cf. Supplementary Information, Eqs. (S2–S3)).
Replication fidelity index (RFI) for the carbon replicas was calculated
based on respective textural parameters in the same manner as reported
in our recent paper [38], with regard to the silica matrix calcined at 850
�
C as a reference (cf. Supplementary Information, Eq. (S4)).
Structural parameters of the studied samples were examined by lowangle X-ray powder diffraction (XRD) using a Bruker D2 Phaser instru
ment equipped with a LYNXEYE detector. The diffraction patterns were
collected with Cu Kα radiation (λ ¼ 1.54184 Å) in a 2θ range of
0.80–3.15� with a step of 0.02� .
Thermogravimetric measurements (TG) were performed using a SDT
Q600 instrument (TA Instruments). An amount of ca. 10 mg of a sample
placed in a corundum crucible was heated from 30 � C to 1000 � C at a
heating rate of 20 � C/min in an air atmosphere (100 cm3/min). Real
PFA/SBA-15 mass ratios were determined by dividing the mass loss
within the range of 130–1000 � C, i.e. organic part of composite, by the
mass recorded at 1000 � C, i.e. mineral part, while pore filling degrees
were computed as a ratio of volume of bulky PFA deposited in 1.00 g of
2.3. Catalytic tests
Carbon replicas were tested as catalysts in the oxidative dehydro
genation (ODH) of ethylbenzene (EB) to styrene in the presence of ox
ygen as an oxidizing agent. The catalytic runs were carried out in a flowtype tubular quartz microreactor (internal diameter of 8 mm) placed in a
vertically-oriented electric tunnel furnace and filled with 50 mg of a
catalyst held up by a quartz wool plug. A constant flow of gaseous re
actants was controlled by mass flow controllers (Brooks 4800 Series).
The total flow of He ỵ O2 mixture was equal to 3.000 dm3/h (0.024
dm3/h of O2 of grade 5.0 diluted in the stream of 2.976 dm3/h of helium
of grade 5.0). The influent gas mixture was saturated with EB vapor by
bubbling through a glass saturator filled with liquid EB, kept at 25 � C.
The molar ratio of O2: EB was kept constant at 1:1. Reaction products
were analyzed in a Bruker 450-GC gas chromatograph equipped with
three packed columns (Porapak Q, Molecular Sieve 4A, and Chromosorb
W-HP), and three detectors (two flame ionization detectors; one among
them equipped with a methanizer enabling COx quantification, and one
thermal conductivity detector). Prior to a catalytic run, a catalyst was
evacuated at 200 � C for 30 min in a flow of pure helium (3.000 dm3/h).
Subsequently, temperature was elevated up to 350 � C, and dosing of the
reactant feed was started. The first GC analysis was commenced after 15
min time-on-stream, and the further analyses were recorded at 40 min
time intervals within the total reaction time of 7 h. The catalytic per
formance, expressed as conversion of EB, yield of styrene, and selectivity
towards a particular reaction product, was evaluated by Eqs. (1)–(3):
CEB ¼
3
n_ EB;0 À n_ EB
⋅100%
n_ EB;0
(1)
Yi ¼
n_ i
⋅100%
n_ EB;0
(2)
Si ¼
Yi
⋅100%
CEB
(3)
P. Janus et al.
Microporous and Mesoporous Materials 299 (2020) 110118
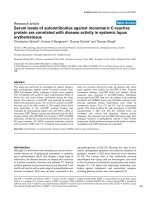
polymer in the composites compared to the intended ones are under
standable [18,38].
where:
CEB – conversion of ethylbenzene [%];
n_ EB;0 ; n_ EB – molar flow rate of EB in the inlet and outlet stream,
respectively [mol/s];
Yi – yield of i product [%];
n_ i – molar flow rate of EB transformed into i product [mol/s];
Si – selectivity to i product [%].
3.2. Textural characteristic of C/S-x composites and C-x replicas
The textural parameters of SBA-15, SBA-15_850, C/S-x carbonizates
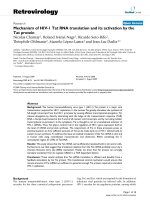
and ultimate C-x replicas were investigated by means of lowtemperature adsorption-desorption of nitrogen. The relevant isotherms
together with the corresponding pore size distribution curves are shown
in Fig. 2.
All the isotherms collected for SBA-15 and carbonizates (Fig. 2A)
demonstrate similar behavior, characteristic of the type IV(a) as classi
fied by IUPAC [42]. Both pure silica and the carbonizate with the lowest
PFA loading (C/S-0.50) feature the well distinguished H1 hysteresis loop
indicative of the delayed capillary condensation of nitrogen in the
mesopores, while the shape of the loop for the higher-loaded composites
(i.e. C/S-1.00–C/S-2.00) changes into the H2(a) type with the distinctive
closure point at p/p0 ¼ 0.43 (in Fig. 2A marked by asterisks), notwith
standing the content of carbon in the composite [18,37]. This effect is
due to the cavitation of the adsorptive, which takes place in
partially-blocked mesopores and it is manifested by an artificial rapid
drop of nitrogen uptake in the desorption branch at the relative pressure
range of 0.40–0.50 [42,43]. In such cases, the closure point of isotherm
remains almost irrespective of the real pore dimensions. Therefore, in
order to avoid the presence of artificial peaks on PSDs, the NLDFT curves
for parent silicas and carbonizates were calculated for the adsorption
branches of the isotherms (as an example, see Fig. 2Aʹ–b; conspicuous
artificial peak in BJH calculated from the desorption branch at 3.7 nm;
Table 1).
In the case of the pristine SBA-15 matrix, the pronounced capillary
condensation step, manifested by a rapid increase in nitrogen uptake,
occurs at p/p0 ¼ 0.70–0.75, whereas for all the carbonizates a slight shift
towards lower relative pressures (p/p0 ¼ 0.60–0.70) is observed
(Fig. 2A). This shift arises from the shrinkage of the SBA-15 framework
caused by the high-temperature treatment (carbonization at 850 � C),
what is evident by comparison of the isotherms recorded for carbon
izates and SBA-15_850 (cf. Fig. 2A) [38]. An increase in the content of
the carbonized polymer inside the pore system causes a gradual stricture
of the hysteresis loop. As mentioned above, the character of desorption
branch for the C/S-1.00, C/S-1.25, and C/S-1.50 samples (i.e. shift of
For the sake of comparison of the catalytic activity of the studied
materials with catalysts tested by other researchers under different re
action conditions, the a comparative parameter was calculated from Eq.
(4) [18,40,41]:
�
�
XEB ⋅n_ EB;0 μmol
a¼
;
(4)
gcat ⋅s
W
where:
XEB – conversion of EB expressed as a mole fraction [mol/mol];
W – initial mass of a catalyst [g].
3. Results and discussion
3.1. Effectiveness of PFA deposition in SBA-15 pore system
The effectiveness of accumulation of PFA inside mesochannels of
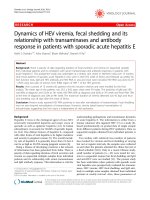
SBA-15 was studied by means of TG under the oxidative atmosphere
(air). The TG curves recorded for the studied PFA/SBA-15 composites
together with the determined real vs. intended polymer/silica ratios are
presented in Fig. 1.
Obviously, the conditions of PFA deposition resulted in relatively
high degrees of polycondensation of FA within the whole range of FA
concentrations (the real effectiveness of PFA deposition varied between
62% (for PFA/S-0.50) and 88% (for PFA/S-1.50) in relation to the
intended values). This is in line with our previous results [18,38]. It
should, however, be noted that for all syntheses, the filtrate after sepa
ration of a PFA/SBA-15 composite exhibited an amber-like color,
evidencing the presence of water-soluble oligomeric furfuryl entities.
Therefore, part of the monomer was lost and the lower real amounts of
Fig. 1. TG measurements at the air atmosphere for the PFA/S-x composites of various PFA/SBA-15 mass ratios (A), and effectiveness of poly(furfuryl alcohol)
deposition in the SBA-15 pore system, expressed as a real PFA/SBA-15 mass ratio (B): x ¼ 0.50 (a), x ¼ 1.00 (b), x ¼ 1.25 (c), x ¼ 1.50 (d), and x ¼ 2.00 (e).
4
P. Janus et al.
Microporous and Mesoporous Materials 299 (2020) 110118
Fig. 2. N2 adsorption (filled circles) – desorption (open circles) isotherms collected for SBA-15, SBA-15_850, C/S-x carbonizates (A), C-x replicas (B), and corre
sponding PSDs (Aʹ and Bʹ, respectively): x ¼ 0.50 (a), x ¼ 1.00 (b), x ¼ 1.25 (c), x ¼ 1.50 (d), and x ¼ 2.00 (e) (vertically offset for clarity) (the isotherms closure
points at p/p0 ¼ 0.43, and the consequent artificial peaks on BJH PSDs calculated from the desorption branch marked by asterisks).
closure points towards the constant relative pressure of p/p0 ¼ 0.43)
suggests the impeded, cavitation-induced evacuation of the adsorptive
through the constricted mesopores, what, in turn, is indicative of the
formation of the irregular polymer plugs inside the mesochannels. Thus,
it can be inferred that the used procedure of the deposition of moderate
amounts of PFA does not favor the formation of a homogeneous film
cladding the mesopore walls of silica matrix. Nevertheless, for the
highest polymer-loaded sample (i.e. C/S-2.00), the hysteresis loop be
comes almost invisible. This clearly evidences serious filling of the pore
system with the carbon precursor [18].
The pristine SBA-15 material shows a narrow pore size distribution
with the maximum centered at 7.9 nm. For the SBA-15 material
annealed at 850 � C this maximum shifts towards lower diameter (7.0
nm) (cf. Fig. 2Aʹ). Similarly, the studied C/S-x carbonizates reveal the
presence of the mesopores uniform in a diameter of 6.3–6.8 nm
(Fig. 2Aʹ). The PSDs of the carbonizates disclose two interesting effects,
namely: (i) no further shift of the maximum of PSD towards lower pore
widths with the increasing polymer content, and (ii) a gradual decrease
in the intensity of PSD maximum caused by the progressive pore filling
with PFA. These effects clearly suggest the random accumulation of PFA
in the SBA-15 pores, i.e. certain channels could be filled completely,
while others are partially blocked by small polymer domains formed at
the pore mouths and impeding the further filling of SBA-15 meso
channels with carbon precursor [38]. Nonetheless, the increase in PFA
content results in a gradual decrease in the amount of these partially
plugged pores.
As anticipated, the introduction of the polymer into the pore system
of SBA-15 followed by carbonization influenced noticeably the textural
5
P. Janus et al.
Microporous and Mesoporous Materials 299 (2020) 110118
Table 1
Textural and structural parameters of SBA-15, SBA-15_850, C/S-x carbonizates, and corresponding C-x replicas.
Sample
SBET (Sext.)
[m2/g]
Smicro [m2/g]
t-plot
Vtotal [cm3/
g] s-p
Vmicro [cm3/
g] αs
Vmeso I
[cm3/g]
Vmeso II
[cm3/g]
Vmeso IỵII
[cm3/g]c
D [nm]
a100
[nm]
wsil./wcarb.d
[nm]
SBA-15
SBA15_850
C/S-0.50
C/S-1.00
C/S-1.25
C/S-1.50
C/S-2.00
C-0.50
C-1.00
C-1.25
848 (125)
610 (74)
56
0
1.21
0.85
0.03
0.00
1.03a
0.75a
1.18
0.85
7.9
7.0
10.8
9.6
2.9
2.6
474 (53)
390 (33)
384 (30)
343 (20)
317 (8)
858
1147
1203
18
90
126
139
167
140
117
92
0.67
0.46
0.39
0.31
0.21
0.91
1.38
1.45
0.01
0.05
0.06
0.07
0.08
0.10
0.11
0.11
0.59a
0.37a
0.29a
0.21a
0.11a
0.48b
0.53b
0.81
0.79b
0.81b
0.66
0.41
0.33
0.24
0.13
0.81
1.27
1.34
9.6
9.6
9.4
9.3
9.3
9.5
7.2
C-1.50
1173
71
1.26
0.11
0.64b
0.51b
1.15
9.4
6.9
0.11
b
b
0.94
6.6
6.8; (5.1)f
6.6
6.6
6.3
1.1; 3.2; (2.7)f
1.2; 2.8; 5.8
1.2; 2.8; 5.8;
(3.7)e
1.2; 2.8; 5.8;
(4.0)e
1.2; 2.8; 4.8;
(4.5)e
9.3
6.2
C-2.00
a
b
c
d
e
f
1318
35
1.05
0.86
0.08
αs model.
calculated based on Lorentz deconvolution of PSDs (cf. Fig. 4A).
Vtotal–Vmicro.
pure silica wall thickness (wsil.), and carbon replica nanorod diameter (wcarb.), calculated based on Eqs. (S1), and (S2), respectively.
CMK-3 primary mesopore diameter calculated based on Eq. (S3).
BJH model, desorption branch (cf. Fig. 2Aʹ).
parameters of the composites (cf. Table 1).
The gradual drop in the BET surface area (SBET) and total pore vol
ume (Vtotal) with increasing amount of polymer clearly evidences the
successful incorporation of PFA into the mesoporous structure of silica
matrix. The slight growth in the micropore volume (Vmicro) and
considerable increase in the micropore surface (Smicro) with the raising
polymer content is understandable, as it arises from the development of
the intrinsic microporosity of the carbonized PFA (cf. Fig. 3; Table 1)
[18].
The simultaneous decrease in the primary mesoporosity of SBA-15
(Vmeso I) additionally evidences the progressive blocking of the pore
system of SBA-15. The external surface area (Sext.) of C/S-x carbonizates
calculated according to the αs model decreases with the increasing
polymer content from 53 m2/g for C/S-0.50 to 8 m2/g for C/S-2.00. This
suggests the accumulation of the polymer also on the external surface of
the silica particles [18,38]. It should be, however, underscored that the
covering of the external surface of silica grains with PFA does not entail
the conglomeration of the composite particles as one would suppose.
This is proven by the absence of an additional porosity, which could be
created between the coalesced particles (cf. Fig. 2A). Besides, the TEM
micrographs taken for the chosen carbon replicas additionally indicate
that the morphology of the pristine matrix remains unaltered
throughout the entire replication procedure (cf. Fig. 6).
The nitrogen isotherms collected for the ultimate carbon replicas are
presented in Fig. 2B. All of them may be classified as IV(a) type ac
cording to IUPAC [9,18,42]. Apart from the C-0.50 sample, the others
exhibit the H2(b) hysteresis loop [42]. The observed specific, well pro
nounced two inflections in the adsorption branches of the isotherms
recorded for the C-1.00, C-1.25, C-1.50, and C-2.00 carbons at p/p0 ¼
0.3–0.5 and 0.7–0.9, are associated with two steps of capillary
condensation, what, in turn, indicates the existence of two individual
mesopore systems. This is clearly reflected in the respective PSDs pre
sented in Fig. 2Bʹ. All these PSDs exhibit the maxima centered at 1.1–1.2
nm (attributed to the inherent microporosity of the carbonized PFA) and
2.8 nm (ascribed to the voids between the carbon nanorods). The third
broad peak on PSD observed for the C-1.00, C-1.25, and C-1.50 materials
originates from the coalescence of the adjacent SBA-15 pores, which
underwent merely partially filling with the polymer. Thus, for the
samples with the PFA/SBA-15 mass ratio of 1.00–1.50 this size ranges
roughly within 4.5–10.0 nm (with a maximum at ca. 5.8 nm), while the
C-2.00 sample shows a narrower and scarcely visible peak at 4.0–7.0 nm
Fig. 3. Comparative αs plots for pristine SBA-15, SBA-15_850, and C/S-x car
bonizates: x ¼ 0.50 (a), x ¼ 1.00 (b), x ¼ 1.25 (c), x ¼ 1.50 (d), and x ¼
2.00 (e).
(centered at 4.8 nm). As the PSDs for C-1.00, C-1.25, C-1.50, and C-2.00
exhibit two broad and overlapping peaks in the mesopore range, in order
to calculate both the mesopore volumes separately, the QSDFT profiles
6
P. Janus et al.
Microporous and Mesoporous Materials 299 (2020) 110118
were deconvoluted using Lorentz algorithm, as shown in Fig. 4A. The
computed values are compiled in Table 1, while the particular fractions
of pores in the total pore volumes of the replicas are depicted in Fig. 4B.
In the case of the samples with the intended PFA/SBA-15 ratios of
1.00–2.00 the volume of the primary mesopores (Vmeso I) rises gradually
with the increasing polymer content, while the volume of the larger
voids (Vmeso II) decreases systematically. Surprisingly, the specific sur
face area (SBET) of carbon replicas remains within the range of
1150–1320 m2/g notwithstanding the content of the carbon precursor.
Combining these remarks one may infer that the method of introduction
of PFA inside the pore system of SBA-15 by precipitation poly
condensation results in the formation of carbon replicas featuring the
presence of a complex pore structure in the mesopores region. Namely,
as already mentioned, the replicas exhibit the presence of some random
inhomogeneities (larger voids) in the structure. In a boundary case, i.e.
for the samples derived from the carbonizates with the low PFA content,
these inhomogeneities preclude the formation of stably merged, wellordered 3D mesostructure.
The hysteresis loop on the isotherm of replica derived from the C/S0.50 carbonizate (i.e. C-0.50) has the H4 shape typical of micromesoporous solids with the slit-shaped pores (cf. Fig. 2B) [42]. Most
likely, in this case the ordered structure of carbon framework underwent
the partial collapse after removal of the silica scaffolding. The material
exhibits the relatively high surface area of 858 m2/g, total pore volume
of 0.91 cm3/g, and main QSDFT mesopore size of 3.2 nm. Interestingly,
the pore size distributions computed based on the BJH model (both
adsorption and desorption branches of isotherm) show minor maxima
centered at about 2.7 nm (obviously, the distinctive sharp peak at 3.7
Fig. 4. Exemplary Lorentz deconvolution of PSD curve of C-1.25 sample (A), and contributions of particular pore volumes to Vtotal of C-x replicas (B): x ¼ 0.50 (a), x
¼ 1.00 (b), x ¼ 1.25 (c), x ¼ 1.50 (d), and x ¼ 2.00 (e). (the lines connecting the columns added to guide the eyes).
7
P. Janus et al.
Microporous and Mesoporous Materials 299 (2020) 110118
nm in BJH desorption PSD is an artifact) [42]. Thus, combining the
behavior of the nitrogen isotherm (i.e. closure point at p/p0 ¼ 0.43) and
PSD, it should be noted that the certainty of QSDFT model in this
particular case may be questionable. For this reason, care must be taken
when comparing these results with the other samples within the series. It
is noteworthy that in this case no larger mesopores (with diameters
ranging within 4.5–10.0 nm) are observed. This clearly confirms the
above supposition: no long-ranging structure of this material arises from
advanced disintegration of the three–dimensional carbon framework
after removal of the silica scaffolding. Besides, the lowest cumulative
mesopore volume (Vmeso IỵII) within the series noticed for C-0.50 carbon
additionally supports the foregoing remarks.
More interestingly, contrary to our conjectures, the micropore sur
face area of the replicas decreases systematically with the increasing
amount of PFA (cf. Table 1). Considering the micropore surface area of
the C/S-2.00 carbonizate and the respective C-2.00 replica (Smicro ¼ 167
and 35 m2/g, respectively), one may conclude that the removal of silica
matrix resulted in a severe decrease in Smicro. A plausible explanation of
this effect may be the formation of micropores between carbon rods and
silica matrix during carbonization caused by the differences in the
shrinkage effect of both materials (i.e. a discrepancy in the scale of
contraction between carbon and silica when subjected to thermal
treatment). This is evident when considering that after leaching of silica
these voids disappear. Interestingly, the micropore volumes of the rep
licas remain constant notwithstanding the level of loading the pore
system of SBA-15 with PFA. Thus, deposition of PFA inside the pore
system of the silica matrix does not influence microporosity of the final
replicas. As stated above, this microporosity comes purely from the
inherent micropore structure formed in the PFA when carbonized [18].
0 0), (1 1 0), and (2 0 0) planes, respectively, and ascribed to the p6mm
space group [44,45]. The calculated d100 interplanar spacing equals 9.4
nm and thereby the a100 lattice parameter (being the center-to-center
distance of the adjacent pores) is 10.8 nm (Table 1). The shrinkage ef
fect in the case of the SBA-15_850 sample is clearly reflected in the
calculated d100 and a100 parameters (8.4 and 9.6 nm, respectively), what
is in full accordance with the PSDs (cf. Table 1; Fig. 2B). The XRD pat
terns collected for the carbonizates (Fig. 5A) indicate that the hexagonal
array was preserved throughout the entire synthesis procedure (i.e.
deposition of polymer and carbonization). The lattice parameters of the
C/S-x composites and the corresponding replicas are listed in Table 1.
The values of a100 for the carbonizates are about 1 nm lower when
compared with pristine SBA-15, what turns out to be plausible in view of
the structural parameters calculated for SBA-15_850 (cf. Table 1) [28,
31,38].
The XRD patterns collected for the series of carbon replicas (Fig. 5B)
reveal that the formation of a stable, well-ordered replica requires a
certain minimal level of loading of SBA-15 pores with the carbon pre
cursor. As seen, in the case of the employed synthetic route, the
boundary minimal mass ratio of PFA/SBA-15 providing the successful
replication of silica structure (i.e. the XRD pattern features the typical
set of three reflections), is equal to 1.25. For the materials with lower
polymer contents (i.e. C-0.50, and C-1.00), the XRD patterns exhibit lack
of the relevant reflections suggesting the aforementioned collapse of the
carbon mesostructure. The structural parameters of the successfully
formed replicas are gathered in Table 1. The carbon nanorods diameters
(wcarb.) were calculated based on a simple geometrical relation
employing the d100 interplanar spacings and the respective micro- and
mesopore volumes (cf. Eq. (S2)). Although the carbon content in the
composites does not substantially affect the unit cell size, a slight ten
dency of diminishing of the carbon nanorods diameter with an increase
in the level of loading of SBA-15 with PFA is observed. For the C-1.25, C1.50, and C-2.00 samples, the nanorods diameters of 7.2, 6.9, and 6.2
nm, respectively, were calculated. These values are in compliance with
the pore size of the counterpart SBA-15_850 silica.
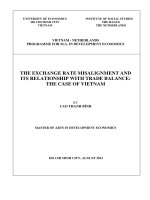
TEM images for chosen resulting replicas (Fig. 6) taken
3.3. Structure and morphology of C/S-x composites and C-x replicas
The above presented considerations are additionally supported by
the X-ray diffraction patterns collected for the studied materials (Fig. 5).
The XRD pattern recorded for pristine SBA-15 (Fig. 5A) exhibits three
well resolved reflections at 2θ of 0.94� , 1.59� and 1.83� , indexed as (1
Fig. 5. Low-angle XRD patterns collected for pristine SBA-15, SBA-15_850, C/S-x carbonizates (A), and corresponding C-x replicas (B): x ¼ 0.50 (a), x ¼ 1.00 (b), x ¼
1.25 (c), x ¼ 1.50 (d), and x ¼ 2.00 (e).
8
P. Janus et al.
Microporous and Mesoporous Materials 299 (2020) 110118
perpendicular to the nanorods clearly show their hexagonal arrange
ment. The micrographs confirm also the maintenance of the structural
architecture and particle morphology characteristic of SBA-15. It should
be noted that the samples originated from the carbonizates with higher
PFA content (i.e. C-1.50, and C-2.00) exhibit the presence of an amor
phous carbon shell covering the outer surface of the grain (cf. Fig. 6C
and D; the places indicated by arrows). This effect is caused by the su
perficial deposition of the excess PFA on SBA-15, as reported elsewhere
[18,38].
range ordering, what is additionally reflected in the XRD results
(cf. Fig. 2Bʹ–b; Fig. 5B–b; Fig. 6A; Fig. 7b).
(iii) The adjacent carbon nanorods for the samples C/S-1.25, and C/S1.50 are bridged by the narrower carbon rods. Such structuring
turns out to be sufficient to maintain the merged 3D framework of
the C-1.25, and C-1.50 replicas. This allowed us to calculate the
replication fidelity indices for these samples. The RFI of 0.59, and
0.68 were found for C-1.25, and C-1.50 replicas, respectively. It
should be, however, underscored that the presence of a large
number of partially filled pores in the siliceous matrix still results
in a formation of bimodal mesoporosity in both discussed replicas
(cf. Fig. 2Bʹ–c,d; Fig. 5B–c,d; Fig. 6B and C; Fig. 7c,d). As
mentioned in our recent paper, we reported on the synthesis of
porous structures analogous to CMK-5 calling them “pseudo-CMK3” [38].
(iv) The micro- and mesopore structure of SBA-15 in the PFA/S-2.00
composite is almost completely filled with polymer. As a conse
quence, the resulting C-2.00 replica exhibits only one peak in the
mesopore region of the PSD and a set of the typical well pro
nounced three diffraction reflections characteristic of the p6mm
symmetry. The homogenous monomodal mesopore system is
formed in the place of the removed silica walls. In this case, the
RFI parameter was 0.94, proving almost perfect negative repli
cation of the SBA-15 structure (i.e. RFI ¼ 1.00) (cf. Fig. 2Bʹ–e;
Fig. 5B–e; Fig. 6D; Fig. 7e). This indicates that the higher is the
loading of the pore system of SBA-15 with PFA the larger is the
similarity of the structure of the resulting material to the ideal
inverse replica of the pristine silica matrix.
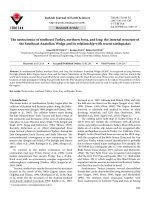
3.4. Mechanism of formation of carbon replicas structures
The thorough study on the evolution of the textural and structural
features of the materials allowed us to propose the general pathway of
formation of the ordered carbon structures by the precipitation poly
condensation of FA in a water slurry of SBA-15 with increasing amounts
of carbon precursor. The mechanism of formation of the regular struc
tures of CMK-3 may be summarized in the four following steps:
(i) In the case of the composite synthesized at the lowest PFA/SBA15 ratio (i.e. PFA/S-0.50), the polymeric domains accumulate
throughout the silica matrix pore system randomly. Only a
limited fraction of mesopores is completely filled with PFA, while
the others underwent partial filling with the carbon precursor.
The removal of the SBA-15 matrix from the C/S-0.50 material
after carbonization results in an advanced collapse of the carbon
framework. This in turn results in the formation of smaller carbon
particles exhibiting abundant intrinsic microporosity and vesti
gial mesoporosity formed in the place of the leached silica walls.
As a consequence, the ultimate carbon structure (C-0.50) exhibits
the unordered spatial structure (cf. Fig. 2Bʹ–a; Fig. 5B–a; Fig. 7a).
(ii) The higher amount of the monomer available in the synthesis
medium results in a higher degree of SBA-15 pore filling (PFA/S1.00), but the structuring of the carbon framework formed in the
C/S-1.00 carbonizate is still not sufficient to merge perfectly the
3D array of the corresponding C-1.00 replica. After the contact
with silica leaching agent, the structure undergoes a partial
disintegration along the weakest links (i.e. partially filled adja
cent pores). However, the moderate degree of pore filling enables
the creation of somewhat larger domains with a bimodal meso
porosity formed by the coalescence of the adjacent SBA-15 pores
unfilled completely with the polymer. Nevertheless, the relatively
small dimensions of these domains still result in the lack of long-
The successive development of the primary mesoporosity of replicas
with increasing level of SBA-15 pore filling clearly reflects the gradual
formation of the regular CMK-3 replica structure (cf. Table 1; Fig. 4B).
Therefore, combining the foregoing, it may be concluded that the
random accumulation of PFA in the SBA-15 structure precludes the
possibility of synthesis of regular CMK-5 structures employing this
procedure; however, the obtained porous structures called “pseudoCMK-3” may be favorable in view of their potential applications in
adsorption and catalysis [38].
3.5. Surface composition of carbon replicas
The nature and quantity of the oxygen-containing entities present in
the fresh carbon replicas were determined by means of TPD and XPS
measurements. The comprehensive analysis of the results brought
Fig. 6. TEM images taken perpendicular (top) and parallel (bottom) to the nanopipes/nanorods of C-x replicas: x ¼ 1.00 (A), x ¼ 1.25 (B), x ¼ 1.50 (C), and x ¼ 2.00
(D). The arrows indicate the amorphous carbon shell covering the surface of silica grains.
9
P. Janus et al.
Microporous and Mesoporous Materials 299 (2020) 110118
Fig. 7. Replication fidelity indices (RFI) with regard to the pore filling degree (top), and postulated mechanism of incorporation of PFA into SBA-15 pore system
together with the fates of carbon frameworks after silica removal (bottom).
Fig. 8. Temperature-programmed desorption profiles of CO (A), and CO2 (B) for chosen fresh carbon replicas, and Gauss deconvolution of the CO profiles (C).
10
P. Janus et al.
Microporous and Mesoporous Materials 299 (2020) 110118
insight into the composition of carbon replica on the entire surface (i.e.
external and internal; TPD) as well as on the outermost few atomic
layers of the accessible surface of material (XPS). The recorded CO- and
CO2-TPD profiles measured within a temperature range of 200–1000 � C
are depicted in Fig. 8, while the total concentrations of oxygencontaining moieties which decompose evolving CO and CO2 are sum
marized in Table 2.
The maximum of CO2 desorption rate of a poor intensity observed
below 400 � C reveals that only a minor part of the oxygen-containing
species exists in the form of the least stable carboxyl groups [40,41,
47]. Interestingly, lack of the characteristic peaks at 620–700 � C, and
500–580 � C in the CO2-TPD profiles indicates the absence of lactone and
anhydride entities. Besides, the lack of latter one is additionally evi
denced by the absence of the peak component in the CO-TPD at
500–580 � C (as the anhydride groups decompose into both CO and CO2)
[40,41,47].
The CO-TPD profiles collected for all the studied replicas are mutu
ally similar, exhibiting in the curve-resolved form two well distin
guished maxima centered at around 670 � C, and 850 � C. These peaks
correspond to the decomposition of phenols, and carbonyl/quinone
species, respectively. It is noteworthy that the content of the carbonyl
moieties for all samples reaches around 80% in relation to the total
oxygen content (cf. Table 2). The highest total oxygen content of 1.05
mmol [O]/g was noted for the C-1.25 replica. Generally, the TPD results
clearly reveal that the studied carbon replicas contain thermally stable
functional oxygen-containing moieties.
The contributions of particular oxygen- and carbon-containing su
perficial groups determined for chosen replicas by XPS are collected
together with the respective binding energies in Table 3, while the
relevant C 1s, and O 1s regions of XPS spectra are gathered in Fig. S1.
The C 1s core level spectra were fitted with four peaks as follows: (i)
carbon atoms of sp2 and sp3 hybridization in graphitic and disordered
– O (Eb ¼
moieties (Eb ¼ 284.4 eV), (ii) C–OH (Eb ¼ 286.4 eV), (iii) C–
287.4 eV), and (iv) COOH (Eb ¼ 288.4 eV) [18,34,48–50]. The O 1s
spectra were deconvoluted into four following components: (i) carbonyl
– O) (Eb ¼ 530.8 eV), (ii) hydroxyl (C–OH), and oxygen
groups (C–
double bonded to carbon atom in carboxyl groups (COOH) (Eb ¼ 533.0
eV), (iii) oxygen single bonded to carbon atom in carboxyl groups
(COOH) (Eb ¼ 534.4 eV), and (iv) oxygen atoms in adsorbed water (Eb ¼
537.0 eV) [18,48,49]. As seen in Table 3, the surface composition of the
studied replicas is substantially influenced by an amount of carbon
precursor accumulated in the SBA-15 pore system. The concentration of
sp2 and sp3 carbon rises with an increase in the degree of pore filling of
silica with PFA. As a consequence, the concentration of
oxygen-containing moieties decreases. The majority of these entities
exists as a carbonyl/quinone and hydroxyl (phenol) groups which may
act as catalytic sites. It is interesting to consider that all surface moieties
may originate either from the oxygen being an original constituent of a
carbon precursor (as oxygen contributes 32.6 wt% of FA) or from the
re-oxidation of freshly carbonized sample after exposure to atmospheric
air, as it is well known that such materials exhibit high reactivity to
wards oxygen [18,46–48]. This prompted us to do a closer inspection of
the real genesis of these oxygen moieties. For this purpose, employing
the thermobalance, we carried out an experiment simulating carbon
ization of PFA/S-2.00 composite followed by exposure to air (at 30 � C),
and subsequent temperature-programmed desorption under the
nitrogen atmosphere (cf. Supplementary Information, Fig. S2 together
with a thorough discussion). Considering the TPD results (cf. Fig. 8;
Table 2), it is easy to calculate that in the case of the C-2.00 replica, the
desorption of both carbon oxides results in a mass loss of ca. 2.1%. On
the other hand, the mass increase noticed during the step of exposure to
air reached roughly 2.5–3.0% in the reference experiment (cf. Fig. S2B;
the mass of carbonizate normalized to the content of carbon; the amount
of adsorbed water was subtracted). Combining these results one can
conclude that the majority of the surface oxygen species is formed when
the freshly carbonized sample comes into contact with air.
3.6. Catalytic activity of carbon replicas in oxidative dehydrogenation of
ethylbenzene
The oxidative dehydrogenation of ethylbenzene is considered to be a
prospective alternative for contemporaneous industrial technology of
production of styrene mainly due to its favorable energy balance. In
contrary to the highly endothermic equilibrium dehydrogenation techư
nology (H ẳ ỵ117.6 kJ/mol), ODH of ethylbenzene is an irreversible
and strongly exothermal reaction (ΔH� ¼ À 124.3 kJ/mol) [51].
The use of carbon materials as catalysts for ODH processes has
attracted a great interest of researchers since the early 1980’s, when
Emig and Hofmann reported on the mechanism of so-called active coke,
which allowed to explain the high catalytic activity upon the formation
of a superficial coke layer after the initial period of the reaction run [51].
The effect of gradual activation with time-on-stream was correlated with
the formation of the quinone moieties [51,52]. The postulated mecha
nism of active coke assumes the role of the quinone/hydroquinone redox
system acting as real active centres [51,52].
The abundant concentration of phenolic and carbonyl/quinone
groups evidenced by TPD and XPS study makes the replicas excellent
candidates for the catalytic purposes of ODH. Three selected, wellordered carbon replicas (namely C-1.25, C-1.50, and C-2.00) were
tested in the ODH of EB in the presence of oxygen at the O2: EB ratio of
1.0 and at the reaction temperature of 350 � C, as it was found to be
favorable in our previous studies [18,49]. The catalytic parameters
recorded during a 7 h catalytic run are depicted in Fig. S3. Apparently,
all the investigated samples exhibit a high catalytic activity. The main
products formed over the catalysts were styrene and COx, while others
(i.e. benzene, toluene, and coke) were produced with a cumulative
selectivity lower than 1.4%. The reaction system achieved a steady state
after ca. 4–5 h. The initial and steady-state catalytic performance (after
15, and 360 min of time-on-stream, respectively) are compared in
Table 4.
The highest initial conversion of EB (29.1%) was denoted for the C2.00 catalyst, whereas the utmost selectivity towards styrene (92.6%)
was found over the C-1.25 sample. It should be underscored that the
selectivity to styrene in the latter case increases gradually with time-onstream of 1.4%, while for the other samples it declines slightly (see
Fig. S3; Table 4). Interestingly, the TPD and XPS study reveal that the C1.25 material exhibits the highest content of oxygen-containing surface
entities among the studied catalysts (cf. Table 2; 3). Apparently, the
concentration of oxygen-containing surface groups affects substantially
the catalytic performance of the replicas. This additionally supports the
postulated mechanism of active coke. Furthermore, the C-1.25 replica
exhibits the lowest selectivity to COx and utmost selectivity to styrene,
while its selectivity to the trace products decreases with time-on-stream
from 1.4 to 0.3% (cf. Fig. S3; Table 4). All studied catalysts undergo a
gradual deactivation with time-on-stream. This effect may be due to the
formation of the carbon deposit (catalytically inactive) onto the surface,
which causes the impeded accessibility of the reactants to the catalytic
sites, as reported earlier [49]. Nevertheless, the least deactivation de
gree of 10.7% as compared to the initial, was observed for the C-2.00
catalyst. It is interesting to juxtapose the performance of the C-1.25 and
C-2.00 replicas with regard to their mutual textural differences (i.e. the
“pseudo-CMK-3” structure vs. typical CMK-3 framework, respectively).
Table 2
Amounts of CO2 and CO evolved during the TPD experiments for chosen fresh
carbon replicas.
Sample
CO
[mmol/g]
CO2
[mmol/g]
Total oxygen
[mmol [O]/g]
CO/
CO2
CO/total
oxygen
C-1.25
C-1.50
C-2.00
0.83
0.55
0.62
0.11
0.06
0.09
1.05
0.67
0.80
7.5
9.2
6.9
0.79
0.82
0.78
11
P. Janus et al.
Microporous and Mesoporous Materials 299 (2020) 110118
Table 3
Concentration of carbon and oxygen species on the surface of fresh replicas determined by XPS.
Sample
Carbon [at.%]
2
C¼C sp C–C sp
C-1.25
C-1.50
C-2.00
a
CO/CO2a
Oxygen [at.%]
3
C–OH
C¼O
COOH
C¼O
OH, COOH
COOH
H2O ads.
284.4 eV
286.4 eV
287.4 eV
288.4 eV
530.8 eV
533.0 eV
534.4 eV
537.0 eV
94.15
94.62
95.11
1.98
1.97
1.68
0.70
0.38
0.57
0.10
0.16
0.10
0.70
0.38
0.57
2.08
2.13
1.78
0.10
0.16
0.10
0.20
0.21
0.08
7.0
2.4
5.7
calculated based on C 1s data.
Table 4
Conversion of EB, selectivity towards styrene, carbon oxides, and other products measured over selected replicas after 15 and 360 min time-on-stream.
Sample
C-1.25
C-1.50
C-2.00
Conversion of EB [%]
Selectivity to styrene [%]
Selectivity to COx [%]
Selectivity to other products [%]
15 min
360 min
15 min
360 min
15 min
360 min
15 min
360 min
26.3
28.6
29.1
14.6
14.4
18.4
92.6
91.3
91.5
94.0
91.0
91.2
6.0
8.4
8.2
5.8
8.9
8.7
1.4
0.3
0.2
0.3
0.1
0.2
�
�
μmol
a
gcat ⋅s
1.2
1.3
1.5
Namely, when considering their prominently different behavior along
with the time-on-stream of the ODH run, the impact of the textural
features on the catalytic potential of carbon replicas turns out to be
evident. Finally, it is also pertinent to mention that the comparative a
parameters calculated in ODH of ethylbenzene for the C-1.25, C-1.50,
and C-2.00 replicas (1.2, 1.3, and 1.5, respectively; cf. Eq. (4); Table 4)
revealed that the latter material surpasses the formerly reported acti
vated carbon (with a ¼ 1.47), as well as carbon nanotubes (a ¼
0.80–1.12) [18,40,41].
especially those requiring the engagement of the surface O-containing
moieties.
4. Conclusion
Acknowledgments
This study was aimed at the thorough investigation on the mecha
nism of accumulation of various amounts of poly(furfuryl alcohol) in the
SBA-15 pore system by the previously developed method of precipita
tion polycondensation of FA in a polar medium (water). A series of CMK3-like carbon replicas has been synthesized at the polymer/silica mass
ratio ranging within 0.50–2.00. The mechanism of deposition of
increasing polymer content onto silica surface was elucidated based on a
thorough study of the textural and structural parameters of the mother
silica matrix, carbonizates and final carbon replicas. It was found that
the poly(furfuryl alcohol) accumulates in the SBA-15 pore system in a
random manner, i.e. certain channels undergo a complete filling, while
others remain partially empty. A plausible explanation of such effect
may be the formation of PFA plugs at the pore mouths. Consequently,
further incorporation of the polymer to the SBA-15 mesochannels is
impeded.
This precludes the feasibility of the synthesis of a regular CMK-5
structure, but facilitates the formation of the “pseudo-CMK-3” frame
works, which feature an interesting bimodal mesoporosity (the primary
mesopores are the regular ones appearing after silica walls leaching,
while the broader secondary pores originate from the coalescence of the
adjacent SBA-15 pores, which remained incompletely filled with the
polymer). Most likely, the synthesis of the CMK-5 replica requires the
incorporation of the catalyst into the silica matrix walls and/or the use
of non-polar solvents for the introduction of monomer to silica channel
structure, as was reported formerly. The studied CMK-3-like carbon
materials exhibited the presence of abundant amounts of the surface
oxygen-containing groups, among which the phenolic and carbonyl/
quinone ones were dominating. The TG measurement revealed that
these entities were formed after contact of freshly carbonized compos
ites with air. Such beneficial surface chemistry was reflected in a
promising catalytic performance of these materials in the ODH process,
surpassing reported activated carbons and carbon nanotubes. Therefore,
the materials seem to be promising candidates for catalytic purposes,
This work was supported by the Polish National Science Centre under
the grant no. DEC-2011/01/N/ST5/05595. The research was carried out
with the equipment purchased thanks to the financial support of the
European Regional Development Fund in the framework of the Polish
Innovation
Economy
Operational
Program
(contract
No.
POIG.02.01.00-12-023/08). The research was carried out using the
infrastructure of the AGH Centre of Energy, AGH University of Science
and Technology.
Declaration of competing interest
The authors declare that they have no known competing financial
interests or personal relationships that could have appeared to influence
the work reported in this paper.
Appendix A. Supplementary data
Supplementary data to this article can be found online at https://doi.
org/10.1016/j.micromeso.2020.110118.
References
[1] S. Tan, W. Zou, F. Jiang, S. Tan, Y. Liu, D. Yuan, Mater. Lett. 64 (2010) 2163–2166.
[2] M. Hartmann, A. Vinu, G. Chandrasekar, Chem. Mater. 17 (2005) 829–833.
[3] H. Zhang, H. Tao, Y. Jiang, Z. Jiao, M. Wu, B. Zhao, J. Power Sources 195 (2010)
2950–2955.
[4] T. Komanoya, H. Kobayashi, K. Hara, W.J. Chun, A. Fukuoka, Appl. Catal. Gen. 407
(2011) 188–194.
[5] N. Mohammadi, H. Khani, V.K. Gupta, E. Amereh, S. Agarwal, J. Colloid Interface
Sci. 362 (2011) 457–462.
[6] M. Hartmann, Chem. Mater. 17 (2005) 4577–4593.
[7] R. Ryoo, S.H. Joo, S. Jun, J. Phys. Chem. B 103 (1999) 7743–7746.
[8] R. Ryoo, S.H. Joo, Stud. Surf. Sci. Catal. 148 (2004) 241–260.
[9] A.B. Fuertes, Microporous Mesoporous Mater. 67 (2004) 273–281.
[10] S. Jun, S.H. Joo, R. Ryoo, M. Kruk, M. Jaroniec, Z. Liu, T. Ohsuna, O. Teresaki,
J. Am. Chem. Soc. 122 (2000) 10712–10713.
[11] B. Sakintuna, Y. Yürüm, Ind. Eng. Chem. Res. 44 (2005) 2893–2902.
[12] M.W. Anderson, T. Ohsuna, Y. Sakamoto, Z. Liu, A. Carlsson, O. Terasaki, Chem.
Commun. 10 (8) (2004) 907–916.
[13] H. Darmstadt, C. Roy, S. Kaliaguine, T.-W. Kim, R. Ryoo, Chem. Mater. 15 (2003)
3300–3307.
[14] Z. Lei, S. Bai, Y. Xiao, L. Dang, L. An, G. Zhang, Q. Xu, J. Phys. Chem. C 112 (2008)
722–731.
[15] S. Che, K. Lund, T. Tatsumi, S. Iijima, S.H. Joo, R. Ryoo, O. Terasaki, Angew. Chem.
Int. Ed. 42 (2003) 2182–2185.
12
P. Janus et al.
Microporous and Mesoporous Materials 299 (2020) 110118
[37] S.H. Joo, R. Ryoo, M. Kruk, M. Jaroniec, J. Phys. Chem. B 106 (2002) 4640–4646.
[38] R. Janus, P. Natka�
nski, M. Wądrzyk, B. Dudek, M. Gajewska, P. Ku�strowski, Mater.
Today Commun. 13 (2017) 6–22.
[39] A. Silvestre-Albero, J. Silvestre-Albero, A. Sepúlveda-Escribano, F. RodríguezReinoso, Microporous Mesoporous Mater. 120 (2009) 62–68.
� ao, J.L. Figueiredo, Appl. Catal. Gen. 184 (1999)
[40] M.F.R. Pereira, J.J. M Orf~
153–160.
� ao, P. Serp, P. Kalck, Y. Kihn, Carbon 42
[41] M.F.R. Pereira, J.L. Figueiredo, J.J. M Orf~
(2004) 2807–2813.
[42] M. Thommes, K. Kaneko, A.V. Neimark, J.P. Olivier, F. Rodríguez-Reinoso,
J. Rouquerol, K.S.W. Sing, Pure Appl. Chem. 87 (9–10) (2015) 1051–1069.
[43] M. Thommes, Chem. Ing. Tech. 82 (7) (2010) 1059–1073.
[44] W. Schmitt, Microporous Mesoporous Mater. 117 (2009) 372–379.
[45] T. Onfroy, F. Guenneau, M.A. Springuel-Huet, A. G�ed�
eon, Carbon 47 (2009),
2352–1357.
[46] F. Rodríguez-Reinoso, M. Molina-Sabio, Adv. Colloid Interface Sci. 76–77 (1998)
271–294.
[47] P. Serp, J.L. Figueiredo, Carbon Materials for Catalysis, John Wiley & Sons, New
Jersey, 2009.
[48] R. Janus, A. Wach, P. Ku�strowski, B. Dudek, M. Drozdek, A.M. Silvestre-Albero,
F. Rodríguez-Reinoso, Langmuir 29 (2013) 3045–3053.
[49] P. Janus, R. Janus, P. Ku�strowski, S. Jarczewski, A. Wach, A.M. Silvestre-Albero,
F. Rodríguez-Reinoso, Catal. Today 235 (2014) 201–209.
[50] R. Janus, P. Natka�
nski, A. Wach, M. Drozdek, Z. Piwowarska, P. Cool,
P. Ku�strowski, J. Therm. Anal. Calorim. 110 (2012) 119–125.
[51] F. Cavani, F. Trifir�
o, Appl. Catal. Gen. 133 (1995) 219–239.
[52] G. Emig, H. Hofmann, J. Catal. 84 (1983) 15–26.
[16] A.H. Lu, J.J. Nitz, M. Comotti, C. Weidenthaler, K. Schlichte, C.W. Lehmann,
O. Terasaki, F. Shüth, J. Am. Chem. Soc. 132 (2010) 14152–14162.
[17] D. Gu, W. Li, F. Wang, H. Bongard, B. Spliethoff, W. Schmidt, C. Weidenthaler,
Y. Xia, D. Zhao, F. Shüth, Angew. Chem. Int. Ed. 54 (2015) 7060–7064.
[18] P. Niebrzydowska, R. Janus, P. Ku�strowski, S. Jarczewski, A. Wach, A.M. SilvestreAlbero, F. Rodríguez-Reinoso, Carbon 64 (2013) 252–261.
[19] A.B. Fuertes, D.M. Nevskaia, Mater. Chem. 13 (2003) 1843–1846.
[20] A.B. Fuertes, Mater. Chem. 13 (2003) 3085–3088.
[21] Y. Xia, Z. Yang, R. Mokaya, Chem. Mater. 18 (2006) 140–148.
[22] Y. Xia, R. Mokaya, Adv. Mater. 16 (2004) 1553–1558.
[23] Y. Xia, Z. Yang, R. Mokaya, Nanoscale 2 (2010) 639–659.
[24] A.-H. Lu, F. Schüth, Adv. Mater. 18 (2006) 1793–1805.
[25] T. Yokoi, S. Seo, N. Chino, A. Shimojima, T. Okubo, Microporous Mesoporous
Mater. 124 (2009) 123–130.
[26] S.H. Joo, S.J. Choi, I. Oh, J. Kwak, Z. Liu, O. Teresaki, R. Ryoo, Nature 412 (2001)
169–172.
[27] A.B. Fuertes, D.M. Nevskaia, Microporous Mesoporous Mater. 62 (2003) 177–190.
[28] M. Kruk, M. Jaroniec, T.-W. Kim, R. Ryoo, Chem. Mater. 15 (2003) 2815–2823.
[29] A.-H. Lu, W. Schmidt, B. Spliethoff, F. Schüth, Adv. Mater. 15 (2003) 1602–1606.
[30] W.-H. Zhang, C. Liang, H. Sun, Z. Shen, Y. Guan, P. Ying, C. Li, Adv. Mater. 14
(2002) 1776–1778.
[31] A.-H. Lu, W. Li, W. Schmidt, W. Kiefer, F. Schüth, Carbon 42 (2004) 2939–2948.
[32] P. Michorczyk, J. Ogonowski, K. Ze�
nczak, J. Mol. Catal. 349 (2011) 1–12.
[33] M. Kruk, M. Jaroniec, Chem. Mater. 12 (2000) 1961–1968.
[34] R. Janus, M. Wądrzyk, P. Natka�
nski, P. Cool, P. Ku�strowski, J. Ind. Eng. Chem. 71
(2019) 465–480.
[35] M. Jaroniec, M. Kruk, J.P. Olivier, Langmuir 15 (1999) 5410–5413.
[36] A. Silvestre-Albero, J. Silvestre-Albero, M. Martínez-Escandell, R. Futamura,
T. Itoh, K. Kaneko, F. Rodríguez-Reinoso, Carbon 66 (2014) 699–704.
13