Real-time inline monitoring of zeolite synthesis by Photon Density Wave spectroscopy
Bạn đang xem bản rút gọn của tài liệu. Xem và tải ngay bản đầy đủ của tài liệu tại đây (1.23 MB, 6 trang )
Microporous and Mesoporous Materials 288 (2019) 109580
Contents lists available at ScienceDirect
Microporous and Mesoporous Materials
journal homepage: www.elsevier.com/locate/micromeso
Real-time inline monitoring of zeolite synthesis by Photon Density Wave
spectroscopy
T
Janick Hänea, Dominik Brühwilerb, Achim Eckera, Roland Hassc,*
a
Centre of Industrial Chemistry and Processes, Institute of Chemistry and Biotechnology, Zürich University of Applied Sciences (ZHAW), CH-8820, Wädenswil, Switzerland
Section of Polymer Chemistry, Institute of Chemistry and Biotechnology, Zürich University of Applied Sciences (ZHAW), CH-8820, Wädenswil, Switzerland
c
Physical Chemistry – innoFSPEC Potsdam, University of Potsdam, D-14476, Potsdam-Golm, Germany
b
ARTICLE INFO
ABSTRACT
Keywords:
Photon density wave spectroscopy
Process analytical technology
Zeolite synthesis
Molar water content
Silica source
The formation process of zeolite A (Linde Type A) was monitored inline at 1.5 L scale by Photon Density Wave
(PDW) spectroscopy as novel process analytical technology for highly turbid liquid suspensions. As a result, the
reduced scattering coefficient, being a measure for particle number, size, and morphology, provides distinct
process information, including the formation of amorphous particles and their transfer into crystalline zeolite
structures. The onset and end of the crystallization process can be detected inline and in real-time. Analyses by
powder X-ray diffraction and electron microscopy, based on a sampling approach, support the interpretation of
the results obtained by PDW spectroscopy. In addition, the influence of the molar water content was investigated, indicating a linear increase of the time needed to reach the end of the zeolite A crystallization with
increasing molar water content. Further experiments indicate a strong influence of the silica source on the course
of the crystallization. The applicability of PDW spectroscopy under even more demanding chemical and physical
conditions was investigated by monitoring the synthesis of zeolite L (Linde Type L).
1. Introduction
The first synthesis of a zeolite was reported by St. Claire Deville in
1862 for levynite [1]. Almost a century later, first industrial amounts of
zeolites were made available by Union Carbide in 1954, providing a few
hundred tons per year in the late 1950s [2]. Other companies such as
Mobil Oil, Grace, and Henkel followed in the 1960s and 1970s [3].
Zeolite A, X, Y, and ZSM-5 are currently the commercially most important zeolites. The annual production of synthetic zeolites was estimated to 2·106 tons per year for 2009 [4].
In spite of the mega ton scale, the global multi-billion dollar market
[4], and their diverse applications, synthetic zeolites are still produced
or crystallized batch-wise without using inline process analytical technologies (PAT), apart from measuring temperature, pressure, or conductivity. The current analytical approaches for zeolites are based on
offline, cost-intensive, and time-consuming techniques, such as element
analysis, powder X-ray diffraction (XRD), scanning electron microscopy
(SEM), physisorption characterization, and light scattering [5]. In many
other sectors of the chemical industry, PAT are frequently applied [6–8]
including crystallization process monitoring [9]. However, options for
inline sub-micrometer particle or droplet sizing in concentrated systems
are limited. In general, inline PAT has the potential to gain additional or
*
faster process insight, to improve product quality (e.g., by quickly detecting process deviations), and to speed up production (e.g., by reducing cycle time and increasing space-time-yields) [6].
In the past, efforts to analyze the crystallization of zeolites in realtime have been undertaken on the lab scale with focus on mechanisms
rather than particle size. Different analytical methods, such as electrochemical methods/conductivity [10,11], viscosity measurements
[12], calorimetry [13], spectroscopic methods [14] (IR [15,16], Raman
[17–19], NMR [20,21], X-Ray absorption (XANES, EXAFS) [22]), mass
spectrometry [23], and X-ray powder diffraction (XRD) [24–26] as well
as X-ray scattering (SAXS, WAXS) [22,27–29], have been employed. To
the best of our knowledge, only two publications report on inline
spectroscopic methods applicable in pilot or production scale (IR
spectroscopy [30], Raman spectroscopy [31]), whereas all others are
based on specially designed at-/off-line measurement cells or sampling
approaches for zeolite characterization.
The real-time, inline or online characterization of zeolite syntheses
is intrinsically challenging due to the typical processing conditions, i.e.,
high temperatures (often above 150 °C), high alkalinity (often
pH ≈ 14), high turbidity (intrinsic to crystallizations), strong stirring,
and a potentially high degree of inhomogeneity, as well as concerns of
material deposition on process probes (so-called probe fouling).
Corresponding author.
E-mail address: (R. Hass).
/>Received 1 March 2019; Received in revised form 26 June 2019; Accepted 27 June 2019
Available online 28 June 2019
1387-1811/ © 2019 The Authors. Published by Elsevier Inc. This is an open access article under the CC BY-NC-ND license
( />
Microporous and Mesoporous Materials 288 (2019) 109580
J. Häne, et al.
In this work, a novel approach to monitor zeolite synthesis inline
and in real-time by means of Photon Density Wave (PDW) spectroscopy
[32–35] is reported. PDW spectroscopy is an inline PAT capable of
calibration-free quantification of light absorption and light scattering in
highly turbid, highly concentrated liquid suspensions, even under
strong stirring conditions. The experimental results are expressed as
absorption coefficient (μa) and reduced scattering coefficient (μs’), being
the absolute optical properties of the turbid material. While μa is linked
to the chemical composition (Lambert-Beer law) of the suspension, μs’ is
linked to the size, concentration, and morphology of the suspended
particles. Recently, PDW spectroscopy has been applied successfully to
cooling crystallization processes prone to process probe fouling with
mass fractions of 60% [36].
Based on Mie theory [37] and theories for so-called dependent light
scattering [32], particle sizes can be obtained from the reduced scattering coefficient. However, here the focus is put on the systematic
evaluation of the fundamental applicability of PDW spectroscopy with
respect to the monitoring of the optical properties during the synthesis
of zeolite A (Linde Type A, LTA). In addition, first experiments using
PDW spectroscopy during zeolite L (Linde Type L, LTL) synthesis were
performed, representing even more challenging process conditions.
ultrapure water. The suspension was immediately filtered and the solid
was washed with ultrapure water until the washing solution reached
pH ≈ 8. After each synthesis, the PDW spectroscopy process probe as
well as the reactor were cleaned overnight with 1 mol/L of nitric acid at
25 °C. The entire system was then rinsed with ultrapure water until the
washing solution reached pH 7.
2.3. Photon Density Wave (PDW) spectroscopy
PDW spectroscopy is a light scattering technique based on photon
transport theory in multiple light scattering environments and is
therefore especially suitable for highly turbid systems. Experimentally,
intensity-modulated light is inserted with an optical fiber acting as a
point-like light source in a strongly light scattering and weakly absorbing material, such as a zeolite suspension. Due to absorption and
multiple scattering of the intensity modulated light, a PDW is created
inside this suspension. As function of emitter/detector-fiber distance
and modulation frequency, shifts of the amplitude and the phase of the
PDW are characterized experimentally. More details on the theoretical
background are found elsewhere [32].
The PDW spectrometer is self-built. The most relevant parts consist
of a vector network analyzer (VNA) (ZNB4, Rohde & Schwarz GmbH &
Co. KG, Munich, Germany) as main analytic tool. The VNA generates a
sinusoidal electrical high-frequency signal, which is combined with the
laser current via a BIAS-T (ZFBGT4R2GW, Minicircuits, Brooklyn, NY,
USA) to generate a high frequency modulated laser current. Thus, the
laser diodes (e.g., from Thorlabs GmbH, Dachau/Munich, Germany)
emit intensity-modulated light, which is coupled into an optical fiber
(HCPM0600T, Laser Components GmbH, Olching, Germany) and
guided into the suspension (emission fiber). Seven detection fibers,
each positioned in different distance to the emission fiber, are integrated in a custom-made stainless steel process probe of 25 mm diameter. A photograph of such a process probe is shown elsewhere [36].
The detection fibers guide light out of the suspension and onto an
avalanche photo diode (APM-400P, Becker & Hickl GmbH, Berlin,
Germany) as detector. The resulting signal is then analyzed by the VNA
with respect to changes in phase and amplitude. The general setup
concept of a PDW spectrometer is depicted elsewhere [32]. The spectrometers currently are of a similar dimension as a “mobile file cabinet”
and the process probe is equipped with an approx. 10 m fiber optical
conduit to spatially decouple the spectrometer and the process probe.
As experimental parameters, two different wavelengths of λ = 636
and 914 nm were used in consecutive measurements. 41 modulation
frequencies within the typical range of 10–310 MHz and 7 fiber distances within the typical range of 5–13 mm were characterized.
Functionality and performance of the PDW spectroscopy process
probe were tested after each synthesis. For this purpose, the optical
fibers were visually inspected for damage and a photographic image of
the process probe was taken for comparison. The performance of the
process probe was checked by measuring commercially available milk
with 3.5% fat [39]. Significant damages typically cause off-target optical coefficients for the milk sample. No such damages were observed
after the zeolite A syntheses.
For the determination of the optical coefficients during zeolite
synthesis, an estimation of the refractive index and the density is sufficient for PDW spectroscopy raw data analysis. A refractive index
n = 1.45 and density ρ = 1.99 g cm−3 [40] was used for zeolite. Once
particle size analysis will be developed for zeolite synthesis, these
parameters need to be characterized in more detail.
2. Experimental
2.1. Materials
Sodium aluminate anhydrous (technical), sodium hydroxide
(≥98%), LUDOX® HS-40 colloidal silica (40 wt%), and tetraethyl orthosilicate (TEOS, ≥ 99.0%, GC) were purchased from Sigma-Aldrich.
Aerosil® OX-50 (100%) was purchased from Evonik Industries. Sodium
metasilicate pentahydrate (pure) and nitric acid (65%) were obtained
from Carl Roth. The purity of sodium metasilicate pentahydrate was
assumed to be 100%. For further calculations, the composition of the
sodium aluminate was taken from the certificate of analysis (57%
Al2O3, 38% Na2O). All chemicals were used as received.
2.2. Zeolite synthesis
For the synthesis of zeolite A a verified procedure was followed
[38]. Sodium hydroxide was dissolved in 850 mL of ultrapure water
(conductivity 0.055 μS/cm). Half of the sodium hydroxide solution was
used to dissolve the sodium metasilicate pentahydrate (silica solution).
Sodium aluminate was dissolved in the other half of the sodium hydroxide solution (aluminate solution). The aluminate solution was then
filtered by means of a cellulose filter (Whatman Grade 2) and vacuum
to obtain a visually clear solution. The loss of water was compensated
accordingly. The aluminate solution was transferred into a 1.5 L stainless steel autoclave with PTFE inliner (ecoclave Type 3, 1.5 L, Büchi AG,
Uster, Switzerland) and stirred with 500 rpm at 25 °C using a PTFE
propeller with three 45° angular blades (BOLA Propeller Stirrer Shaft C
378, Bohlender GmbH, Grünsfeld, Germany). After reaching 25 °C, inline monitoring with PDW spectroscopy and recording of the relative
torque of the stirrer was initiated. After another 5 min, the silica solution was added within 1 min. The molar composition of the resultant
reaction mass was 3.165 Na2O: 1.00 Al2O3: 1.926 SiO2: x H2O with
varying molar water content (x = 128, 200, 250, and 300 mol H2O per
mole of Al2O3). The reaction mass was stirred for 5 min at 25 °C, then
the jacket temperature of the autoclave was set to 100 °C. The reaction
time was varied between 3 and 20 h. The reaction mass was subsequently allowed to cool to 30 °C before filtration. After filtration, the
zeolite was washed with boiling ultrapure water until the filtrate
reached a pH < 9. The material was dried overnight under vacuum
(100 mbar) at 80 °C. The procedure for the synthesis of zeolite L is
described in the Supplementary Information.
For offline analysis, 10 mL samples were directly taken out of the
reactor by means of a plastic pipette and were added to 40 mL of cold
2.4. Characterization of zeolite samples
Powder X-ray diffraction (XRD) data was collected on a diffractometer (STOE STADI P, STOE & Cie GmbH, Darmstadt, Germany)
in transmission mode with a Ge monochromator and MoKα radiation.
The resulting diffractograms of the zeolite A samples were compared
2
Microporous and Mesoporous Materials 288 (2019) 109580
J. Häne, et al.
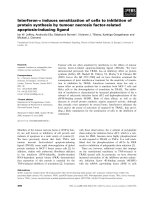
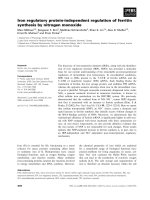
Fig. 1. Inline monitoring of three equivalent zeolite
A syntheses with PDW spectroscopy. The diagrams
show the reduced scattering coefficients μs’ at laser
wavelengths of 636 nm (left) and 914 nm (right). The
first 4 h of the syntheses are displayed in the respective insets. The molar composition was 3.165
Na2O: 1.00 Al2O3: 1.926 SiO2: 128 H2O. Identical
control parameters were used for the three syntheses.
The respective process data is given in Fig. S1.
with the IZA database [41]. Scanning electron microscopy (SEM)
images (FEI Quanta FEG 250, FEI Company, Hillsboro, USA) were
collected after sputtering the samples with gold.
the reduced scattering coefficient during zeolite A formation is based on
common behaviour of light scattering in concentrated suspensions and
supported by offline reference data from SEM and XRD. A complete
interpretation of μs’ would require model development which is not
within the scope of the present work.
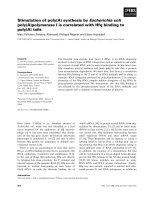
The reduced scattering coefficient μs’ increases rapidly at the start of
the synthesis. This is due to the particle formation and the concomitant
increase of turbidity in the reaction mass when adding the silica solution to the aluminate solution. Initially, μs’ increases constantly for
about 1.2 h, followed by an even faster increase until reaching a maximum after approximately 2 h. This increase is connected to the particle
formation and growth, until a critical point in time at which light
scattering starts to decrease rapidly. This critical time is interpreted as
the start of crystallization and is therefore referred to as crystallization
onset (CO). The CO is followed by a rapid decrease of μs’ to a constant
level, which does not change until the reaction mass is cooled. A constant value of μs’ implies that no change in particle size, number, and
shape occurs, thus indicating the end of the zeolite formation. The point
in time at which μs’ starts to remain constant can be referred to as the
crystallization end (CE). For the investigated experimental conditions,
the CO occurred after about 2 h and the CE after about 3.5 h (Fig. 1). To
provide evidence that the formation of zeolite A crystals begins with the
CO, six samples (S1 to S6) were collected for analysis by SEM and XRD.
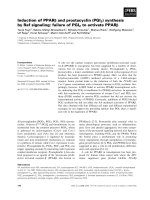
The reduced scattering coefficient as a function of time and the sampling points are shown in Fig. 2 with a SEM image of the final product
after a synthesis time of 20 h. SEM images of the in-process samples S1
to S6 are displayed in Fig. 3.
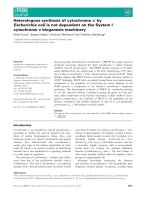
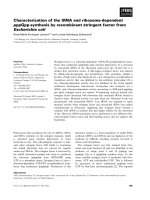
The SEM images of the samples S1 to S3 only show small agglomerated alumosilicate particles. The first larger particles with the typical
cubic shape of zeolite A crystals can be seen on the SEM image of
3. Results and discussion
3.1. Zeolite A syntheses monitored by inline PDW spectroscopy
Fig. 1 displays the reduced scattering coefficient μs’ observed during
the course of three equivalent zeolite A syntheses. All three syntheses
show a similar temporal development of μs’ at both laser wavelengths,
with the μs’ value being higher at 636 nm. This is in agreement with the
typical light scattering properties of particles [33]. These results indicate that zeolite A syntheses can be monitored with PDW spectroscopy inline and in real-time. It is essential to accompany inline data
with process data (see Supplementary Information). Examination of the
process data reveals differences between the three syntheses, which
might explain the slightly different development of μs’ during the first
hours. PDW spectroscopy is in general a method of high precision,
based on referencing against light scattering theory and other particle
sizing methods [32,33]. For the processes investigated here, also the
absorption coefficients μa display changes and variations at both wavelengths within these first hours of synthesis (Fig. S2). It needs to be
evaluated in more detail to what extent process variations can be limited by improved process development and if such improvements would
be reflected also by the optical coefficients. In the following however,
only the results for the reduced scattering coefficient obtained at
636 nm are discussed, because the light scattering effects are more
pronounced at shorter wavelength and a relation to offline reference
analysis is intended. The following interpretation of the development of
Fig. 2. Left: Reduced scattering coefficient μs’ at
636 nm during the first 4 h of the zeolite A synthesis
(inset: entire duration). Samples were taken after
0.25 h (S1), 0.75 h (S2), 1.25 h (S3), 2 h (S4), 2.67 h
(S5), and 3.08 h (S6), with S4 approximatively representing the crystallization onset (CO) and S5 the
crystallization end (CE). Right: SEM image of the
final product obtained after 20 h of synthesis time.
3
Microporous and Mesoporous Materials 288 (2019) 109580
J. Häne, et al.
Fig. 3. SEM images of the six collected in-process samples according to Fig. 2 after 0.25 h (S1), 0.75 h (S2), 1.25 h (S3), 2 h (S4), 2.67 h (S5), and 3.08 h (S6).
sample S4. The in-process sample S4 was taken at the point associated
with the CO when μs’ reached its maximum value. These observations
support the hypothesis that the zeolite A formation features a specific
delayed onset and is not directly initiated when mixing the silica and
aluminate solutions [42,43]. Sample S5 was taken after μs’ remained
constant and may be attributed to the CE. Only cubic zeolite A crystals
can be identified in the SEM image of sample S5, indicating that the
crystal formation is indeed completed when μs’ reaches a constant
value. This is further supported by the SEM image of sample S6, which
exclusively shows cubic zeolite A crystals. The initial formation of
spherical amorphous alumosilicate particles from which the zeolite A
crystals are formed after a certain period of time has been described
previously [42,43].
An explanation for the decrease of μs’ after the peak at the CO might
be the reduced number and larger size of the particles due to the zeolite
formation in comparison to the small-scale alumosilicate particles. With
respect to μs’ of a suspension having a given mass fraction, such larger
particles scatter light less than the smaller particles. Depending
amongst other factors on refractive indices, mass fractions, and wavelength, this effect starts to occur for particle diameters larger than half
of the experimental wavelength [33]. The drop in light scattering observed here may represent the transformation of amorphous particles to
zeolite A crystals.
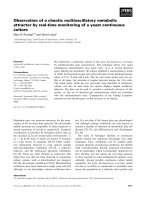
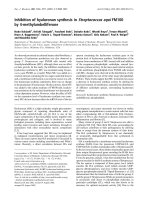
Further evidence for the transformation from amorphous to crystalline structure for these particular samples S1 to S6 is provided by
powder XRD data (Fig. 4). For the samples S1 to S3, the diffractograms
do not contain any specific reflections. For sample S4 the distinctive
reflections of zeolite A are already visible and thus can be attributed to
the CO.
Inline monitoring of zeolite synthesis is generally difficult due to
high turbidity and high alkalinity in combination with high temperature. To evaluate the stability of the PDW spectroscopy process probe,
tests were run after each synthesis. Even after more than 20 zeolite A
syntheses lasting about 200 h overall, no damages to the probe were
found, both visually and in terms of performance during the tests with
milk samples.
Fig. 4. Powder XRD patterns of in-process samples S1 to S6 and of the final
product. The patterns are offset for clarity. A reference pattern for hydrated
zeolite A [48] is shown for comparison.
The experiments summarized in Fig. 5 show the progression of μs’ for
different water contents. It can be observed that the temporal development with respect to the sharp peak as seen in Fig. 1 changes. Instead
of this peak, rather longer lasting plateaus at maximal light scattering
are observed per level of molar water content. For the molar water
content of x = 128, 200, and 250 mol of H2O per mole of Al2O3, the
maximal reduced scattering coefficient decreases in this order. A tentative interpretation could be a longer existence of amorphous precursor particles, causing an increased delay of the transformation into
crystalline zeolite structures. Here, with increasing molar water content, the CE is delayed. If the time to reach the CE is plotted as a
function of the molar water content (Fig. 5, right), a linear trend is
observed. According to XRD data, zeolite A was obtained in all six
syntheses. For a molar water content of x = 300 mol of H2O per mole of
Al2O3 a secondary crystalline phase was detected. The decrease of the
3.2. Effect of water content and silica source on zeolite A crystallization
In another set of experiments the effect of the molar water content
was evaluated while keeping the volume of the reaction mass constant.
4
Microporous and Mesoporous Materials 288 (2019) 109580
J. Häne, et al.
Fig. 5. Left: Reduced scattering coefficient μs’ at
636 nm during zeolite A synthesis as a function of
time for different molar water contents: 3.165 Na2O:
1.00 Al2O3: 1.926 SiO2: x H2O, where x = 128
(black), 200 (red), 250 (green), and 300 (blue).
Right: Time to reach CE as a function of molar water
content. The values of CE1’, CE1’’, and CE1’’’, corresponding to three equivalent syntheses, indicate
good reproducibility of CE determination. (For interpretation of the references to colour in this figure
legend, the reader is referred to the Web version of
this article.)
signal intensity of μs’ with increasing molar water content is based on
the reduced amount of solid content, since the volume of the reaction
mass was kept constant throughout all syntheses. It is known from
previous studies that the crystallinity is influenced by the amount of
water [44,45]. However, to our knowledge, a linear trend of CE with
respect to the molar water content has not yet been observed.
Another well-known factor determining the outcome of a zeolite
synthesis is the type of silica source [46]. To evaluate if real-time inline
PDW spectroscopy observes such effects during synthesis, different silica sources (Aerosil® OX-50, TEOS, Ludox HS 40, and sodium metasilicate pentahydrate) were employed. The composition of the reaction
mass was set to 3.165 Na2O: 1.00 Al2O3: 1.926 SiO2: 128 H2O as described in the experimental section. The different silica sources led to
pronounced differences regarding the course of μs’ during the synthesis.
The results are displayed in Fig. S3.
crystallization (CE) in dependence of the molar water content was observed. The results obtained so far provide a promising basis for further
experiments regarding inline monitoring of zeolite syntheses. In particular, future work will need to focus on the model development for
inline particle size analysis based on the reduced scattering coefficient
from PDW spectroscopy.
The ability of PDW spectroscopy to determine the endpoint of
zeolite synthesis in real-time has the potential to reduce cycle time,
increase space-time-yield, and avoid time-consuming in-process sampling. In an industrial context, reduction of cycle time means reduction
of operational cost (increasing margin) or additional capacity (avoiding
investment). Considering the mega ton scale of annual zeolite production, inline PDW spectroscopy thus can influence the efficiency of industrial zeolite production.
Acknowledgements
3.3. Zeolite L synthesis monitored by inline PDW spectroscopy
This work was supported by the German Federal Ministry of
Education and Research (grant 03Z22AN12). The authors thank the
group of Prof. Dr. Greta Patzke (University of Zurich) for powder XRD
measurements.
The synthesis of zeolite L (Linde Type L, LTL) represents even more
chemically and physically challenging conditions for inline PAT [47].
Pressure (6 bar), temperature (160 °C), alkalinity (pH 14), and duration
(42 h) pose significant challenges for the optical components of process
probes for inline spectroscopy. First results indicate that zeolite L
syntheses can be monitored by inline PDW spectroscopy in real-time
(see Supplementary Information). However, after a few syntheses, the
optical fibers of the process probe started to deteriorate (glass dissolution due to high pH, temperature, and pressure) so that data of
decreasing quality were obtained. Either a process probe suitable for
the demands of PDW spectroscopy and suitable for the conditions of
zeolite L synthesis have to be developed or a “single use” approach for
the process probe needs to be adopted.
Appendix A. Supplementary data
Supplementary data to this article can be found online at https://
doi.org/10.1016/j.micromeso.2019.109580.
Declaration of interest
None.
References
4. Conclusions
[1] R.W. Broach, D.-Y. Jan, D.A. Lesch, S. Kulprathipanja, E. Roland, P. Kleinschmit,
Zeolites, Ullmann’s Encycl. Ind. Chem. (2012) 1–35, />14356007.a28_475.pub2.
[2] E. Roland, Industrial production of zeolites, Stud. Surf. Sci. Catal. 46 (1989)
645–659 />[3] E.M. Flanigen, R.W. Broach, S.T. Wilson, Introduction, in: S. Kulprathipanja (Ed.),
Zeolites in Industrial Separation and Catalysis, Wiley-VCH Verlag GmbH & Co.
KGaA, Weinheim, Germany, 2010, pp. 1–26, , />9783527629565.ch1.
[4] Stratistics MRC, Zeolite - Global Market Outlook (2017-2026), (2018) https://www.
strategymrc.com/report/zeolite-market , Accessed date: 23 January 2019.
[5] Zeochem AG/Uetikon Switzerland, Grace GmbH/Worms Germany (2018), Arkema
SA/Colombes France (2018), Personal Communication Concerning PAT for Zeolite
Production, (2015).
[6] R.W. Kessler (Ed.), Prozessanalytik: Strategien und Fallbeispiele aus der industriellen Praxis, Wiley-VCH Verlag GmbH & Co. KGaA, Weinheim, FRG, 2006.
[7] K.A. Bakeev (Ed.), Process Analytical Technology: Spectroscopic Tools and
Implementation Strategies for the Chemical and Pharmaceutical Industries, Second
ed., John Wiley & Sons, Ltd, 2010, />
Photon Density Wave (PDW) spectroscopy is suitable for real-time
inline monitoring of zeolite synthesis, showing characteristic trends of
the reduced scattering coefficient for different systems. The data obtained for the synthesis of zeolite A suggests that small spherical
amorphous alumosilicate particles form quickly after mixing of the silica and aluminate solutions. These particles are transformed to zeolite
A crystals after a certain amount of time. The onset of the zeolite A
crystallization is, according to first indications, the moment at which
the system exhibits maximum light scattering. Due to the formation of
zeolite A crystals, the reduced scattering coefficient subsequently decreases rapidly and reaches a constant value. It is assumed that the
crystallization is complete after reaching a constant reduced scattering
coefficient.
A linear trend of the time to reach the end of zeolite A
5
Microporous and Mesoporous Materials 288 (2019) 109580
J. Häne, et al.
[8] L.L. Simon, H. Pataki, G. Marosi, F. Meemken, K. Hungerbühler, A. Baiker,
S. Tummala, B. Glennon, M. Kuentz, G. Steele, H.J.M. Kramer, J.W. Rydzak,
Z. Chen, J. Morris, F. Kjell, R. Singh, R. Gani, K.V. Gernaey, M. Louhi-Kultanen,
J. O'Reilly, N. Sandler, O. Antikainen, J. Yliruusi, P. Frohberg, J. Ulrich, R.D. Braatz,
T. Leyssens, M. von Stosch, R. Oliveira, R.B.H. Tan, H. Wu, M. Khan, D. O'Grady,
A. Pandey, R. Westra, E. Delle-Case, D. Pape, D. Angelosante, Y. Maret, O. Steiger,
M. Lenner, K. Abbou-Oucherif, Z.K. Nagy, J.D. Litster, V.K. Kamaraju, M.-S. Chiu,
Assessment of recent process analytical technology (PAT) trends: a multiauthor
review, Org. Process Res. Dev. 19 (2015) 3–62, />op500261y.
[9] L.L. Simon, E. Simone, K. Abbou Oucherif, Crystallization process monitoring and
control using process analytical technology, Computer Aided Chemical Engineering,
Elsevier, 2018, pp. 215–242, , />00009-9.
[10] M. Tatlıer, M. Elnekave, Electrochemical monitoring of zeolite synthesis, Mater.
Chem. Phys. 91 (2005) 99–103, />055.
[11] G. Cao, M.J. Shah, In situ monitoring of zeolite crystallization by electrical conductivity measurement: New insight into zeolite crystallization mechanism,
Microporous Mesoporous Mater. 101 (2007) 19–23, />micromeso.2006.12.011.
[12] L.R.A. Follens, E.K. Reichel, C. Riesch, J. Vermant, J.A. Martens, C.E.A. Kirschhock,
B. Jakoby, Viscosity sensing in heated alkaline zeolite synthesis media, Phys. Chem.
Chem. Phys. 11 (2009) 2854–2857, />[13] S. Yang, A. Navrotsky, B.L. Phillips, In situ calorimetric, structural, and compositional
study of zeolite synthesis in the system 5.15Na2O−1.00Al2O3−3.28SiO2−165H2O,
J. Phys. Chem. B 104 (2000) 6071–6080, />[14] A. Aerts, C.E.A. Kirschhock, J.A. Martens, Methods for in situ spectroscopic probing
of the synthesis of a zeolite, Chem. Soc. Rev. 39 (2010) 4626–4642, />10.1039/B919704B.
[15] M.T. Sánchez, J. Pérez-Pariente, C. Márquez-Alvarez, In situ ATR-FTIR for monitoring the kinetics of mesoporous molecular sieves synthesis, Stud. Surf. Sci. Catal.
158 A (2005) 113–120, />[16] C.J. Van Oers, K. Góra-Marek, K. Sadowska, M. Mertens, V. Meynen, J. Datka,
P. Cool, In situ IR spectroscopic study to reveal the impact of the synthesis conditions of zeolite β nanoparticles on the acidic properties of the resulting zeolite,
Chem. Eng. J. 237 (2014) 372–379, />[17] G. Xiong, Y. Yu, Z. Feng, Q. Xin, F.-S. Xiao, C. Li, UV Raman spectroscopic study on
the synthesis mechanism of zeolite X, Microporous Mesoporous Mater. 42 (2001)
317–323, />[18] F. Fan, Z. Feng, G. Li, K. Sun, P. Ying, C. Li, In situ UV Raman spectroscopic studies
on the synthesis mechanism of zeolite X, Chem. Eur J. 14 (2008) 5125–5129,
/>[19] T.F. Chaves, F.L.F. Soares, D. Cardoso, R.L. Carneiro, Monitoring of the crystallization of zeolite LTA using Raman and chemometric tools, Analyst 140 (2015)
854–859, />[20] J. Shi, M.W. Anderson, S.W. Carr, Direct observation of zeolite a synthesis by in situ
solid-state NMR, Chem. Mater. 8 (1996) 369–375, />cm950028n.
[21] M. Haouas, Nuclear magnetic resonance spectroscopy for in situ monitoring of
porous materials formation under hydrothermal conditions, Materials 11 (2018)
1416–1434, />[22] M.G. O'Brien, A.M. Beale, B.M. Weckhuysen, The role of synchrotron radiation in
examining the self-assembly of crystalline nanoporous framework materials: from
zeolites and aluminophosphates to metal organic hybrids, Chem. Soc. Rev. 39
(2010) 4767–4782, />[23] S.A. Pelster, R. Kalamajka, W. Schrader, F. Schüth, Monitoring the nucleation of
zeolites by mass spectrometry, Angew. Chem. Int. Ed. 46 (2007) 2299–2302,
/>[24] P. Norby, Hydrothermal conversion of zeolites: an in situ synchrotron X-ray powder
diffraction study, J. Am. Chem. Soc. 119 (1997) 5215–5221, />1021/ja964245g.
[25] R. Grizzetti, G. Artioli, Kinetics of nucleation and growth of zeolite LTA from clear
solution by in situ and ex situ XRPD, Microporous Mesoporous Mater. 54 (2002)
105–112, />[26] P. Norby, In-situ XRD as a tool to understanding zeolite crystallization, Curr. Opin.
Colloid Interface Sci. 11 (2006) 118–125, />003.
[27] R. Grizzetti, G. Artioli, M. Gemmi, F. Carsughi, P. Riello, In situ WAXS-SAXS synchrotron study of the kinetics of nucleation and growth in Linde type-A zeolite
(LTA), Stud. Surf. Sci. Catal. 154 (Part A) (2004) 355–363, />1016/S0167-2991(04)80823-1.
[28] W. Fan, M. O'Brien, M. Ogura, M. Sanchez-Sanchez, C. Martin, F. Meneau,
K. Kurumada, G. Sankar, T. Okubo, In situ observation of homogeneous nucleation
of nanosized zeolite A, Phys. Chem. Chem. Phys. 8 (2006) 1335–1339, https://doi.
org/10.1039/B510963A.
[29] G. Sankar, W. Bras, Insights into the formation of microporous materials by in situ
X-ray scattering techniques, Catal. Today 145 (2009) 195–203, />1016/j.cattod.2009.05.010.
[30] J.C. Groen, G.M. Hamminga, J.A. Moulijn, J. Pérez-Ramírez, In situ monitoring of
desilication of MFI-type zeolites in alkaline medium, Phys. Chem. Chem. Phys. 9
(2007) 4822–4830, />[31] I. Halasz, M. Agarwal, R. Li, N. Miller, Monitoring the structure of water soluble
silicates, Catal. Today 126 (2007) 196–202, />09.032.
[32] L. Bressel, R. Hass, O. Reich, Particle sizing in highly turbid dispersions by Photon
Density Wave spectroscopy, J. Quant. Spectrosc. Radiat. Transfer 126 (2013)
122–129, />[33] R. Hass, M. Münzberg, L. Bressel, O. Reich, Industrial applications of Photon
Density Wave spectroscopy for in-line particle sizing, Appl. Opt. 52 (2013)
1423–1431, />[34] J.B. Fishkin, S. Fantini, M.J. vandeVen, E. Gratton, Gigahertz photon density waves
in a turbid medium: Theory and experiments, Phys. Rev. E. 53 (1996) 2307–2319,
/>[35] S.M. Richter, R.R. Shinde, G.V. Balgi, E.M. Sevick‐Muraca, Particle sizing using
frequency domain photon migration, Part. Part. Syst. Char. 15 (1998) 9–15, https://
doi.org/10.1002/(SICI)1521-4117(199802)15:1<9::AID-PPSC9>3.0.CO;2-X.
[36] A. Hartwig, R. Hass, Monitoring lactose crystallization at industrially relevant
concentrations by Photon Density Wave spectroscopy, Chem. Eng. Technol. 41
(2018) 1139–1146, />[37] G. Mie, Beiträge zur Optik trüber Medien, speziell kolloidaler Metallösungen, Ann.
Phys. 330 (1908) 377–445, />[38] S. Mintova (Ed.), Verifed Syntheses of Zeolitic Materials, Third Revised Edition,
International Zeolite Association, 2016, />3rdEd.pdf , Accessed date: 2 July 2019.
[39] S. Vargas Ruiz, R. Hass, O. Reich, Optical monitoring of milk fat phase transition
within homogenized fresh milk by Photon Density Wave spectroscopy, Int. Dairy J.
26 (2012) 120–126, />[40] T.B. Reed, D.W. Breck, Crystalline zeolites. II. Crystal structure of synthetic zeolite,
type A, J. Am. Chem. Soc. 78 (1956) 5972–5977, />ja01604a002.
[41] C. Baerlocher, L.B. McCusker, Database of Zeolite Structures, , Accessed date: 23 January 2019.
[42] S. Mintova, N.H. Olson, V. Valtchev, T. Bein, Mechanism of zeolite a nanocrystal
growth from colloids at room temperature, Science 283 (1999) 958–960, https://
doi.org/10.1126/science.283.5404.958.
[43] L. Gora, K. Streletzky, R.W. Thompson, G.D.J. Phillies, Study of the crystallization
of zeolite NaA by quasi-elastic light-scattering spectroscopy and electron microscopy, Zeolites 18 (1997) 119–131, />00144-3.
[44] J.A. Kostinko, Factors influencing the synthesis of zeolites A, X, and Y, in:
G.D. Stucky, F.G. Dwyer (Eds.), Intrazeolite Chemistry, American Chemical Society,
Washington, D.C., 1983, pp. 3–19, , />[45] S. Shirazian, S.G. Parto, S.N. Ashrafizadeh, Effect of water content of synthetic
hydrogel on dehydration performance of nanoporous LTA zeolite membranes, Int. J.
Appl. Ceram. Technol. 11 (2014) 793–803, />[46] X. Zhang, D. Tong, W. Jia, D. Tang, X. Li, R. Yang, Studies on room-temperature
synthesis of zeolite NaA, Mater. Res. Bull. 52 (2014) 96–102, />1016/j.materresbull.2014.01.008.
[47] A. Zabala Ruiz, D. Brühwiler, T. Ban, G. Calzaferri, Synthesis of zeolite L. Tuning
size and morphology, Monatshefte Chem. 136 (2005) 77–89, />1007/s00706-004-0253-z.
[48] V. Gramlich, W.M. Meier, The crystal structure of hydrated NaA : a detailed refinement of a pseudosymmetric zeolite structure, Z. Kristallogr. 133 (2015)
134–149, />
6