Microflow size exclusion chromatography to preserve micromolar affinity complexes and achieve subunit separations for native state mass spectrometry
Bạn đang xem bản rút gọn của tài liệu. Xem và tải ngay bản đầy đủ của tài liệu tại đây (3.11 MB, 11 trang )
Journal of Chromatography A 1685 (2022) 463638
Contents lists available at ScienceDirect
Journal of Chromatography A
journal homepage: www.elsevier.com/locate/chroma
Col Liquid Chromatography
Microflow size exclusion chromatography to preserve micromolar
affinity complexes and achieve subunit separations for native state
mass spectrometry
ES Hecht a,∗ , EC Obiorah a , X Liu b , L Morrison b , H Shion b , M Lauber b,∗
a
b
Genentech, Inc. South San Francisco, CA, USA
Waters Corporation, Milford, MA, USA
a r t i c l e
i n f o
Article history:
Received 13 August 2022
Revised 2 November 2022
Accepted 4 November 2022
Available online 7 November 2022
Keywords:
Size exclusion chromatography (SEC)
Microflow
Native MS
Noncovalent interactions
a b s t r a c t
For high throughput native mass spectrometry (MS) protein characterization, it is advantageous to desalt
and separate proteins by size exclusion chromatography (SEC). Sensitivity, resolution, and speed in these
methods remain limited by standard SEC columns. Moreover, the efficient packing of small bore columns
is notoriously difficult. SEC sensitivity is inherently limited because solutes are not focused into concentrated bands and low affinity native complexes may dissociate on column. Recent work evaluated the
suitability of crosslinked gel media in small bore formats for online desalting. Here, small bore format
online SEC for native MS studies is again investigated but with alternative materials. We systematically
studied the utility of diol and hydroxy terminated polyethylene oxide (PEO) bonded 1.7 μm organosilica
particles as packed into 1 mm ID stainless steel (SS) hardware and hardware treated with hydrophilic
hybrid surface technology (h-HST). For the equivalent diol-bonded particle and hardware, UV limits of
detection (LODs) were reduced 32 to 89% with a microflow separation (15 μL/min) on a 1 × 50 mm column as compared to a 4.6 × 150 mm high-flow separation (300 μL/min) at the same linear velocity. Run
times were also shortened by 45%. A switch from SS to h-HST hardware led to a significant reduction in
secondary interactions and a corresponding improvement in detection limits for trastuzumab, myoglobin,
IgG and albumin for both UV and MS. Coupling of the small bore columns to multichannel microflow
emitters resulted in 10 to 100-fold gains in MS sensitivity, depending on the analyte. MS LOD values
were significantly reduced into the low attomole ranges. Columns were then evaluated for their effects
on the preservation of complexes, including concanavalin A, in its apo and ligand-bound states, and three
therapeutically relevant noncovalent systems previously undetected on large column formats. The results
suggest that the detection of large complexes by SEC is not just a function of sensitivity but is directly
affected by chemical secondary interactions. The ability to detect 0.1 to 1 MDa complexes, with between
1 and 40 micromolar dissociation constants, represents a critical advancement for high-throughput native
MS workflows as applied to the analysis of therapeutics.
© 2022 The Authors. Published by Elsevier B.V.
This is an open access article under the CC BY-NC-ND license
( />
1. Introduction
The biggest challenges in native mass spectrometry (MS) of
proteins include preserving structures, stabilizing non-covalent interactions, and achieving high signal-to-noise detection. When
successful, native MS provides a wealth of information about
the biological properties of intact protein assemblies under nearphysiological conditions [1,2]. When used in a biotechnology en∗
Corresponding authors.
E-mail addresses: (E. Hecht),
(M. Lauber).
vironment, this information can contribute to early stage understanding of disease states and provide quick insights on the formulation, processing, and purification of therapeutic products [3].
Industry adoption of native MS remains limited by the accessibility of instrumentation, the throughput of the experiments, and
the reproducibility of the measurements. In the field of intact analysis, solutions exist to meet these challenges, with diverse chromatography options ever improving to provide compatibility with
time of flight (TOF), Orbitrap, and Fourier transform ion cyclotron
resonance (FTICR) MS instrumentation [4]. In both native and intact analysis, proteins or large molecule drug targets are typically
over-expressed and then isolated from cells for further study. Re-
/>0021-9673/© 2022 The Authors. Published by Elsevier B.V. This is an open access article under the CC BY-NC-ND license ( />
E. Hecht, E. Obiorah, X. Liu et al.
Journal of Chromatography A 1685 (2022) 463638
verse phase liquid chromatography (RP-LC) [4] or capillary electrophoresis (CE) [5] for intact protein analysis show value in giving reasonable throughput and leading sensitivity by means of oncolumn clean-up and focusing. While CE methods have emerged
for native mass spectrometry [6], they remain limited by surface
interactions that hinder reproducibility, resolution, and sensitivity [7]. Ion exchange chromatography and hydrophobic interaction
chromatography, when performed with volatile mobile phase components, are compatible with MS and have been used in native
applications including the mispairing of bispecific antibodies [8],
antibody-drug-conjugate quantification [9], and mass deconvolution of heterogeneous targets [10]. However, the high salt and elevated pH conditions required by those techniques can be destabilizing to some protein aggregates or complexes. Size exclusion
chromatography (SEC) is a compelling and widely used option for
these applications, and it separates solutes on the basis of their
hydrodynamic radii. That said, it is a low sensitivity technique that
requires concentrated samples, and, as with any instance of sample
handling, it can be difficult to mitigate the disruption of noncovalent interactions [11,12].
There are ways to enhance MS sensitivity independent of
the protein separation. Historically, nano-electrospray (nESI) (static
spray) of proteins has achieved the best limits of detection yet does
not facilitate rapid screening [13,14]. The application of multichannel emitters that are compatible with microflow flow rates bridges
the gap between throughput and sensitivity. Multichannel emitters
most commonly work by splitting a single flow channel into multiple outlets so as to simultaneously spray liquid from more than
one tip. Each tip within this clustered sprayer has a lower onset
voltage and flow rate [15–18]. In addition to sensitivity improvements, the reduced onset voltage and an application of sheath
gases helps keep proteins and noncovalent complexes in their native state [13,14]. The degree to which a structure remains native
is correlated with charge state, where denaturation leads to higher
charge states and lower m/z values [19–21]. Nearly all commercial
SEC columns have internal diameters (IDs) of 4.6 mm or higher,
and are recommended for use with flow rates of 200 μL/min or
higher, making microflow compatibility difficult. Split-flow methods can be used to access this flow regime, but that comes with
higher sample requirements to see significant sensitivity gains [22].
There is a paucity of work on microflow SEC applications, especially when compared to the comprehensive literature that can
be found for capillary/microflow intact RPLC analyses [23–27]. The
packing of SEC phases into small column dimensions, compatible
with lower flow rates, presents manufacturing challenges brought
on by the disproportionate increase of the wall surface area to particle sizes and an increasing likelihood of uneven flow and poor
column efficiencies [28]. If packed with excessively high flow rates
or pressures, bed compression can also limit resolution, when a
compressible packing material is used. Lastly, any gains in sensitivity from smaller columns must be balanced with refined needs for
sample concentration, where the injection volume is ideally < 5%
of the column volume [29]. Likewise, to access reasonable sensitivity, instrumentation considerations must be made to minimize
extra-column dispersion effects, though these issues are bound
to be faced in any miniaturized SEC experiment. Microflow native MS using polyacrylamide beads packed into 300 μm diameter columns was recently demonstrated [30]. Very high sensitivity was achieved, although the columns were not compatible with
pressures greater than 400 psi and did not provide separations
other than the fractionation of protein samples from salts. Two microflow SEC columns are commercially available. One, a 4 μm hydrophillic diol-bonded phase is available from Tosoh Biosciences as
a 1 × 30 mm column, where the maximum flow rate is 20 μL/min;
no LC-MS applications with this hardware dimension were found
in literature searches. Second, the polyhydroxyethyl A column from
PolyLC, Inc. is available across a range of IDs and lengths. The ideal
flow for the 2.1 mm column (various lengths) was 100 μL/min
across different studies [31,32], demonstrating significant advantages over larger columns, yet no peer-reviewed literature could be
found for a 1 mm ID version of these columns.
The following work entails the use of 1.7 μm ethylene bridged
hybrid (BEH) particles packed into small hardware (1 × 50 mm)
dimensions and an investigation of these columns for native MS
on noncovalent complexes. The effects of hardware dimensions,
column hardware surfaces, and particle surface chemistry are assessed over a range of native MS applications and instrumentation.
We demonstrate that new capabilities can be had with the use
of microflow columns constructed from hydrophilic hybrid surface
technology (h-HST) column hardware [33] and packed beds made
from hydroxy terminated polyethylene oxide silanized BEH (HOPEO BEH) particles [34]. These devices make it possible to expand
beyond traditional native protein characterization to the study of
complexes that otherwise dissociate by high-flow SEC approaches.
Indeed, the new surface chemistries are seen to minimize chemical forces that are disruptive to complexes, such that is possible
to preserve quaternary interactions that have relatively weak dissociation constants ranging from 1 to 40 μM. In sum, this work
provides compelling evidence for the capabilities of small dimension SEC as an MS-inlet technique that provides sufficient desalting and chromatographic resolution, minimal disruption to native
complexes and <3 min, highly sensitive analyses.
2. Materials and methods
2.1. Materials
Trastuzumab, an RGY antibody hexamer complex described previously in [35], a complement protein hexamer complex (expected
mass 443 kDa), and phospholipase b-like 2 (PLBL2) antibody complex [36] were produced in-house at Genentech, Inc. The 443 kDa
protein hexamer was composed of six calcium-mediated non covalent assemblies, where each assembly was a noncovalent complex of three proteins totaling ∼74 kDa each. Ammonium acetate,
methanol, conconavalin A (ConA) from jack bean, glucose (Glu),
and p-nitrophenyl-ar-D-mannopyranoside (PNM) were purchased
from Sigma-Aldrich (St Louis, MO). Acetonitrile and water were
purchased from Fisher Scientific (Hampton, NH). Five-protein SEC
mixture was purchased from Waters Corporation (Milford, MA). All
solvents were HPLC grade or > 99.9% purity.
2.2. Column manufacturing
SEC
packing
materials
were
prepared
from
organic/inorganic hybrid particles with an empirical formula of
SiO2 (O1.5 SiCH2 CH2 SiO1.5 )0.25 [37]. One batch of these BEHTM particles was bonded with a hydroxy terminated (HO) polyethylene
oxide (PEO) silane. [34] This packing material is referred to herein
as HO-PEO bonded BEH or HO-PEO BEH. The average particle
size of this packing material was 1.64 μm in diameter, and the
particles were measured to have an average pore diameter of 262
˚ surface area of 170 m2 /g, surface coverage of 1.15 μmol/m2 and
A,
pore volume of 1.26 cm3 /g. A second BEH packing material was
investigated in this study and it was acquired in the form of bulk
manufactured diol-bonded BEH particles, just as they are prepared
for commercially available columns (ACQUITYTM UPLCTM BEH200
SEC columns, Waters, Corporation, Milford, MA). The selected
batch had an average particle diameter of 1.54 μm, average pore
˚ surface area of 225 m2 /g, pore volume of 1.30
diameter of 193 A,
cm3 /g and surface coverage of 5.42 μmol/m2 .
These SEC packing materials were either packed into 1 × 50
mm stainless steel column hardware or 1 × 50 mm column hard2
E. Hecht, E. Obiorah, X. Liu et al.
Journal of Chromatography A 1685 (2022) 463638
ware that had been treated to have a hydrophilically modified
hybrid organic/inorganic surface. In a previous report, this latter
type of hardware has been referred to as h-HST hardware, which
stands for hydrophilic hybrid surface technology [33]. Columns
were slurry packed using constant pressure packing conditions and
to produce columns with mechanical stability to withstand pressurization to beyond 6,0 0 0 psi.
trace. From these Gaussian fits, peak width and apex elution time
were extracted.
2.6. Statistics and curve fitting
R was used to fit dilution curves and determine limits of detection. Dilution curves used linear or quadratic equations as most
appropriate to the data. The regression fit of each model was
evaluated with the Breusch-Pagan test, and where appropriate, a
weighted model was used [38]. The limit of detection was calculated as 3.3 x the standard deviation of the intercept/slope. The
gradient end time was selected as the point at which the A280
spectra returned to baseline after the elution of the last peak
(uracil), and the start of the thyroglobulin elution, whose size
is above the exclusion limit of the pore size of these SEC particles. The theoretical plates (N) reported was calculated as the
mean apex protein elution time/standard deviation across the fiveprotein mix. The height was calculated as the average plate/the
length of the column. The peak capacity (P) was calculated as
P = 1 + sqrt(N)∗ 0.2. The resolution of the UV peaks was evaluated as the difference in the retention time between two peaks,
divided by the original reference retention time.
2.3. LC-UV-MS
All protein samples were diluted or resuspended in 50 mM ammonium acetate and used within three days of thawing. All dilution curve experiments were injected from least to most concentrated, with a minimum of a 10 min wash and re-equilibration
time between each sample for the small dimension hardware to
ensure no carryover. Regardless of the concentration, the injection
volume was held constant at 1 μL. For ConA experiments, all injections were 510 ng (5 picomole based on the tetramer mass), with
the exception of split flow experiments, where 153 ng was directly
injected at 15 μL/min, or else 1012 ng was injected at 100 μL/min.
For hexamer experiments, 480 ng was injected onto the column.
For PLBL2-IgG4 experiments, a 2:1 molar complex, equating to 250
ng of each species, was injected.
A VanquishTM LC (Thermo Fisher Scientific, Waltham, MA) was
operated in isocratic mode with 100% 50 mM ammonium acetate
at appropriate micro or high flow rates. Regardless of the flow
rate, the column outlet was connected to a biocompatible column
cooler, a semi-micro bio 2.5 μL flow cell, and then a switching
valve via a 100 μm x 750 mm stainless steel line. A 0.005" ID peek
line was used for connecting a HESI (heated electrospray ionization) source. The HESI source was operated at an inlet temperature of 275 °C and an electrospray voltage of 4 kV. For low-flow
experiments, the sheath gas was set to 15 with no additional heat
and for high flow (50 or 300 μL/min) experiments, the sheath gas
was set to 20 and a 30 °C auxiliary gas was set to 5. Unless specified, all microflow 1 × 50 mm SEC-MS data was collected with
the multichannel emitters. A 75 μm x 550 mm nanoViperTM line
(Thermo Fisher Scientific, Waltham, MA) was used to connect to
the microflow-nanospray Electrospray Ionization (MnESI) source,
equipped with 20 μm, 8 nozzle emitters (Newomics, Inc. Berkeley,
CA). The MnESI source was operated at 4 kV ESI voltage and without the use of sheath gases. After ten minutes of isocratic flow, the
switching valve changed positions and infused methanol over the
multichannel emitters from an external syringe pump (Chemex,
Chicopee, MA) at 35 μL/min, while the column was simultaneously washed for 2.5 min at 40 μL/min, followed by a pressure
re-equilibration to twenty minutes total. UV data was collected at
280nm. Q ExactiveTM UHMR (Thermo Fisher Scientific, Bremen, DE)
mass spectrometer settings were tuned for the sample of interest.
3. Results and discussion
3.1. Evaluation of microflow small dimension SEC columns for UV
and MS analyses
The small dimension SEC columns evaluated in this study were
designed to optimize MS sensitivity and speed for the analysis
of native proteins and complexes. In this work, we have studied
samples ranging from a monoclonal antibody (trastuzumab) to a
protein test mixture as well as concanavalin A, which forms a
concentration-dependent dimer and tetramer. Microflow columns
yield smaller electrospray droplets that lead to increases in ionization efficiency but it is challenging to achieve efficient separations
with them. Standard stainless steel (SS) columns or hydrophilic
hybrid surface technology columns (h-HST) of 4.6 × 150 mm or
1 × 50 mm dimensions were packed with standard diol bonded
BEH or HO-PEO bonded BEH particles. Using the MS-compatible
mobile phase of 50 mM ammonium acetate, the MS sensitivity of
these devices was explored followed by a characterization of their
UV capabilities.
A control experiment was first done to estimate the ionization gains that come with moving from a traditional electrospray
source (HESI) to multichannel emitters at 15 μL/min (Figure S1). A
3-fold gain in signal-to-noise and a shift to a more native charge
state distribution was observed when replacing the HESI source
with the multichannel emitter (MnESI) source for the analysis of
trastuzumab (Figure S1A). The reduction of 1-2 charges, on average, indicated that the protein remained in a more native state.
The harshness of the HESI source was further apparent on its effects on the ConA tetramer, which was solely preserved by the
MnESI source (Figure S1B). Thus, hereafter, microflow comparisons
between small bore columns were made using the multichannel
emitters and a HESI-appropriate flow rate of 50 μL/min was used
to compare large and small bore columns of the same chemistries.
A seven-point standard curve of trastuzumab from 1- 400 ng
was generated across all columns and analyzed by MS (Fig. 1A).
With the flow rate controlled at 50 μL/min, the 4.6 × 150 mm
column yielded an LOD of 724 attomole, while the 1 × 50 mm
SS/BEH Diol column produced an LOD of 253 attomole (Table S1).
When operated at 15 mL/min, this same column gave an LOD of
85 attomole, while its h-HST/HO-PEO BEH equivalent produced an
LOD with a value of 60 attomole. These results suggest that column
2.4. Mass spectrum deconvolution
ByosTM software (Protein Metrics Inc, Cupertino, CA) was used
for intact mass deconvolution. For all intact analysis, the intensity
summed across all charge states was used and, if applicable, further summed across glycoforms.
2.5. UV Peak fitting
MagicPlot software (Magicplot Systems, Saint Petersburg, RUS)
was used to peak fit the UV data spectra. Gaussian curves were
provided with an initial set of parameters defining their approximate elution time, intensity, and width. The software then performed a simultaneous multi-fit optimization of these parameters
such that the sum of squares was minimized against the A280
3
E. Hecht, E. Obiorah, X. Liu et al.
Journal of Chromatography A 1685 (2022) 463638
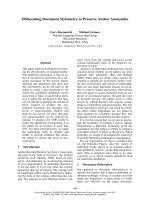
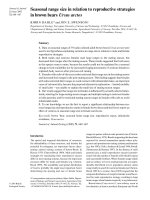
Fig. 1. Standard curves for the MS detection of (A) trastuzumab, (B) IgG, (C) BSA, or (D) myoglobin were generated, with the log2 summed intensity plotted against concentration. Confidence intervals (95%) are shown as shaded ribbons.
miniaturization, low flow rate, and reduced secondary interactions
can each contribute to gains in MS sensitivity.
Standard curves were next built for three of the five proteins
injected from a more complex, five-protein test mixture spanning
molecular weights from 1 to 600 kDa. Thyroglobulin could not be
detected by MS due to its large size and heterogeneity, and uracil
fell below the mass cutoff of the instrument. For BSA, IgG, and
myoglobin, the 1 × 50 mm microflow h-HST/HO-PEO BEH column
performed the best with LODs of 40, 39, and 14 attomoles, respectively. This was a 34%, 58%, and 61% reduction compared to
the 4.6 × 150 mm column, respectively (Table S1). All small dimension columns detected proteins over at least three orders of
magnitude. At low concentrations (less than 100 ng), the signal
began to plateau (Fig. 1BCD). The Q ExactiveTM UHMR is an ion
trapping instrument and all runs maxed out their method injec-
tion time (200 ms) (AGC value not reached). It is possible that
by increasing the injection time, a larger dynamic range could be
achieved at the cost of fewer points across the curve. Interestingly
for the SS/BEH Diol columns, saturation was observed at high concentrations for trastuzumab, myoglobin, and uracil. This suggests
that at some point, any potential gains in signal from increased
protein loads are mitigated by a corresponding increase in nonspecific binding to non-coated surfaces. Columns were also compared based on changes in the signal at the midpoint of the standard curve, rather than at the limit of detection. Increases of up
to 100-fold gains in absolute signal intensity were observed for
the three protein mix analytes compared to approximately 10-fold
gains observed for trastuzumab (Fig. 1). Similar observations were
made upon comparing results from the SS/BEH Diol 1 × 50 and
4.6 × 150 mm columns. Thus, it appears that much of the advan4
E. Hecht, E. Obiorah, X. Liu et al.
Journal of Chromatography A 1685 (2022) 463638
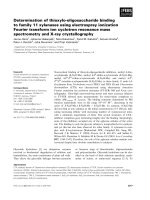
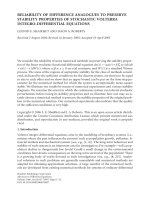
Fig. 2. A280 traces for elution of the protein mix are shown in dark blue for the (A) 4.6 × 150 mm column or the (B) SS/BEH Diol (C) h-HST/BEH Diol (D) h-HST/HO-PEO
BEH 1 × 50 mm columns. The fitted Gaussian peaks that were used for LC peak resolution and capacity calculations are shown as overlaid traces. The spectra shown were
generated from an injection of protein mix containing uracil, BSA, myoglobin, IgG and thyroglobulin at concentrations 0.02, 1, 0.04, 0.4, and 0.6 μg, respectively.
Table 1
Separation characteristics of columns, determined by UV, injected with a five protein test mixture. As described in Section 2.6, all figures of merit were calculated from
Gaussian fits to the LC trace and reported as the average across all proteins. For comparison, the theoretical plates calculated from the uracil peak is also provided.
Dimension (mm)
Flow Rate (μL/min)
Hardware
Particle
Theoretical
Plates, Uracil
Theoretical Plates,
5-Protein Average
Avg. Height
Avg. Peak
Capacity
1 × 50
1 × 50
1 × 50
4.6 × 150
15
15
15
300
h-HST
h-HST
SS
SS
HO-PEO BEH
BEH Diol
BEH Diol
BEH Diol
6281
5052
3566
62939
5709
4848
3457
35100
114
97
69
234
16.1
14.9
12.8
38.5
creased from 35100 on the 4.6 × 150 mm column at 300 μL/min,
to approximately 460 0 (+/- 110 0) on the 1 × 50 mm columns
(Table 1). Peak capacity was reduced by up to 63% on the small
bore columns. However, the addition of h-HST and then additionally HO-PEO BEH particles resulted in small but statistically significant (t-test, p < 0.05) increases in peak capacity and theoretical
plates between the small bore devices. As noted before, optimization of pre and post column tubing might help in future work to
reduce the dispersion of the small volume chromatographic bands
that are generated during microflow SEC.
With the addition of h-HST surfaces and HO-PEO particles, the
resolution between peaks of proteins < 10 0,0 0 0 Da significantly
increased, whereas the separation between the larger proteins was
less affected (Fig. 2). Proteins can exhibit unique types of nonspecific binding depending on their physicochemical properties.
The small proteins in the text mixture might be subject to pronounced surface interactions as evidenced by their comparatively
wider peak widths. This effect was further highlighted in a comparison of columns using a single injection of trastuzumab (Figure
S2A). Unlike on the 4.6 × 150 mm column, trastuzumab eluted as
two peaks on all 1 × 50 mm columns. MS analysis confirmed there
to be no differences in post translational modifications and the
charge state distribution was identical, suggesting no perturbations
to structure (Figure S2B). Consequently, when standard curves of
trastuzumab were generated on the 1 × 50 mm columns, the
main peak showed high nonlinearity compared to the 4.6 × 150
tage conferred to complex mixtures on small bore columns derives
from the use of microflow ESI and the related ionization efficiency
gains.
To provide a thorough characterization of these devices, we also
compared the separation capabilities for the protein test mixture
by online UV detection (Fig. 2). It should be noted that the comparisons described used a single LC instrument without any runto-run adaptions. The same flow cell and LC capillary lines were
used for both small and wide bore columns to model the practical use of an LC in an industry lab, where a user often cannot
re-plumb a configuration for a specific application. Thus, optimization of the LC system for microflow conditions might be an area of
future work that would likely result in improved performance for
1 mm ID SEC analyses.
Key metrics for column evaluation, including plate heights, peak
capacity, and the limits of detection, were determined for the
standard five protein test mixture. SS/BEH Diol 4.6 × 150 mm
columns were run at 300 μL/min and 1 × 50 mm columns at
15 μL/min, which yields comparable linear velocities. Certain features were lost entirely in the transition to small columns, including the shoulder observed on the IgG protein, which corresponds
to a dimer species (Fig. 2). For all 1 mm and 4.6 mm diameter
experiments, thyroglobulin eluted at 1.75 and 3 min, respectively.
This translated to a 41% reduction in elution time. A significant loss
in observed plate count was expected and observed for the switch
to 1 mm ID columns. The number of average theoretical plates de5
E. Hecht, E. Obiorah, X. Liu et al.
Journal of Chromatography A 1685 (2022) 463638
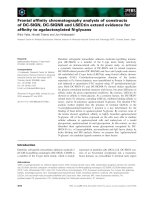
Fig. 3. The standard curves for UV detection of (A) trastuzumab (B) myoglobin (C) IgG (D) thyroglobulin (E) BSA or (F) uracil are shown with their confidence intervals. Area
under the curve was calculated from the Gaussian fits to the raw spectra data for each protein.
6
E. Hecht, E. Obiorah, X. Liu et al.
Journal of Chromatography A 1685 (2022) 463638
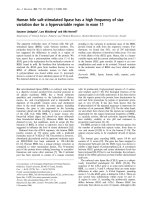
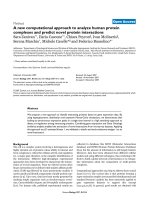
Fig. 4. (A) Comparison of the charge summed deconvolved intensity ratio of the tetramer to all peaks for 510 ng ConA on 1 × 50 mm hardware with a 15 μL/min flow
rate. (B) Values obtained with the h-HST/HO-PEO BEH column from 153 ng of ConA loaded under microflow conditions (15 μL/min) or 1020 ng loaded and run with a 1:6.7
splitflow (153 ng effective MS detection). (C) Comparison of the percent of glucose bound to ConA across the different 1 × 50 mm columns. All experiments were performed
with three replicates.
mm columns. However, when the sum of the main and secondary
peak areas were modeled, the nonlinearity was rescued (Figure S3).
The resolution between the first and second trastuzumab peaks increased with the use of h-HST hardware and the HO-PEO BEH particles (Figure S2A). Additional work is needed to understand the
behavior of trastuzumab and its split peaks. It is possible that system effects, including flow rates, column pressures, and injector
processes might also be at play and impacting separation quality.
For the microflow h-HST/HO-PEO BEH column compared to the
4.6 × 150 mm column at 300 μL/min, the UV LOD for trastuzumab,
BSA, IgG, and uracil decreased by 32%, 75%, 89%, and 85% (Table
S2). Myoglobin was detected with an approximately equal LOD of 2
picomole, respectively. Myoglobin represented the smallest protein
eluting from the mix, and had the greatest peak overlap with other
proteins in the 1 × 50 mm ID columns (Fig. 2), potentially accounting for there being no change in LOD. Thyroglobulin was detected
with reduced sensitivity on microflow columns. Thyroglobulin is
largely excluded from the intraparticle pores of the applied BEH
packing material. With a compressed elution time in microflow
columns, this could cause a decrease in sensitivity, and this issue
would likely be solved through use of larger pore size particles.
The microflow columns showed high reproducibility, with minimal retention time shift, sensitivity loss, and column degradation over 150 injections. Full robustness testing was beyond the
scope of this study, where the focus ultimately was to provide a
base level characterization of the column behavior and demonstrate their utility for MS experiments. Some aspects of the robustness of the microflow SEC device can be predicted from the
performance of the applied BEH particle and its history of use
in analytical scale applications. To this end, it can be noted that
batch-to-batch reproducibility for the HO-PEO BEH packing material has been previously reported [34]. Particles corresponding to
7 different manufacturing batches were studied in 4.6 mm ID column hardware and used to separate NIST mAb reference material
8671 with a phosphate buffered saline mobile phase. Elution times,
area %, USP resolution and USP tailing values were compared for
the monomer main peak as well as high molecular weight species.
RSD% values were all less than or equal to 7%. Column lifetime was
also previously investigated for a 4.6 × 300 mm packing of 1.7 μm
Fig. 5. (A) The ∼900 kDa intact RGY antibody hexamer (black) elutes from 2.22.5 min and undergoes gas-phase dissociation into monomer, dimer, trimer, and
tetramer units. (B) The RGY hexamer’s in-solution monomer (red) independently
elutes at 2.7 min.
particles. No change was observed in elution times and area% values after the course of 10 0 0 repeat injections.
7
E. Hecht, E. Obiorah, X. Liu et al.
Journal of Chromatography A 1685 (2022) 463638
Fig. 6. A 443 kDa hexamer complex of protein trimers (18 proteins total) was observed by the 1 × 50 mm h-HST/HO-PEO BEH SEC microflow column. Extracted ion
chromatograms of the (A) hexamer, (B) tetramer, (C) dimer, and (D) monomeric species are shown, where the “monomeric unit” is considered to be the protein trimer. (E)
The average spectra showing the in solution dimer, tetramer, and hexamer from 2.3-2.7 min. (F) The average spectra from 3-3.4 min showed the tailing of the hexamer, a
gas-phase generated dimer, and the monomeric species.
The microflow SEC devices described in this work showed improved LODs for both MS and UV detection. Overall, the 1 × 50
mm columns offered a more sensitive platform compared to the
large bore columns, compounding the benefits of reduced surface interactions and improved ionization efficiency. The small bore
columns had peak capacities approaching 20 (Table 1), differentiating the column from alternative desalting columns, such as those
packed with compressible large particle size materials [30,39,40].
The 1 × 50 mm SEC columns constructed with h-HST hardware
and HO-PEO BEH particles offered a highly sensitive column for MS
analysis with fast LC run times that enabled attomole level protein
detection.
[42]. Sensitivity to pH makes it potentially more susceptible to gasphase dissociation due to the acidic nature of electrospray. ConA
binds glucose and PNM with dissociation constants of 5.7 [43] and
40.9 μM [44], respectively. While ConA has been extensively studied, it is well documented that it can present problems when
analyzed by chromatography. During purification of glycoproteins
where ConA crosslinked to sepharose is used in an affinity column,
leaching of ConA is a historic and persisting problem [45]. Likewise, while ConA is well studied in the field of mass spectrometry,
to our knowledge, all analyses of the native tetramer by MS has
been done via direct infusion [46,47].
As discussed earlier and shown in Figure S1B, the ConA
tetramer could not be observed from the high flow setup, even
with up to 3 μg injections, due to the harshness of the electrospray source. Across the microflow columns, differences in ConA
tetramer detection were observed. The ConA tetramer was quantified from the SS/BEH Diol, h-HST/BEH Diol, and h-HST/HO-PEO
BEH microflow columns at 0.5%, 3.7%, and 7% of the total protein
signal, respectively (Fig. 4A). The combination of hydrophilically
optimized particles and column surfaces maximized the amount of
multimer detected, suggesting that secondary surface interactions
could be responsible for complex dissociation.
To further investigate effects that can influence tetramer recovery, split flow and higher linear velocity experiments were performed. The same h-HST/HO-PEO BEH column was evaluated for
a 153 ng, 1 μL injection at 15 μL/min and a 1020 ng, 1 μL injection
at 100 μL/min. For the latter scenario, post column flow was split
at a 1:6.7 ratio to ensure equal protein concentrations were elec-
3.2. Noncovalent complex stability as a function of particle chemistry
and hardware
The detection of noncovalent complexes is a particular challenge for native SEC-MS, where the column can cause complexes to
dissociate. The stability of a complex can be affected by pressure,
nonspecific interactions, shear, buffer, and pH. Protein complexes
of interest are also often found at low relative abundances. Accordingly, we studied the effects of the microflow columns for several
well characterized protein-protein and protein-small molecule systems.
ConA is a tetrameric lectin with the capacity to bind up to
four glucose and mannose type sugars [41]. Formation of the ConA
tetramer is reversible, with the tetrameric form stabilized at neutral to high pH, and the dimer favored under acidic conditions
8
E. Hecht, E. Obiorah, X. Liu et al.
Journal of Chromatography A 1685 (2022) 463638
Fig. 7. The PLBL2-IgG4 complex as observed by (A) the h-HST/HO-PEO BEH SEC microflow device (black) or (B) static spray (red). The peaks corresponding to the complex
are shown with stars.
trosprayed into the mass spectrometer for both conditions. There
was a statistically significant loss of tetramer (29%) observed when
the column flow rate was increased to 100 μL/min (Fig. 3B). ConA
forms in a concentration dependent fashion. An increased concentration would theoretically increase the relative percent starting
tetramer in solution. So the observed reduction could in fact be an
underestimation of the amount loss. Between the 100 μL/min and
15 μL/min flow rates, the pressure increased from 41 to 237 bar,
and the elution time decreased from 3.7 min to 0.6 min. As the
split-flow and microflow experiments were performed under laminar flow conditions, the only changes to shear forces would be in
direct correlation to the change in flow rate. Therefore, it is possible for the equilibrium of the complex to have been affected by
the high flow and >200 bar pressure conditions. Additional experiments with controlled flow restriction might help better elucidate
the operational boundaries to consider for these types of microflow
SEC-MS experiments and application of SEC to weakly bound complexes.
Small molecule binding was next studied. Each ConA protomer has the ability to bind small ligands. Glucose was detected bound to the tetrameric form of ConA by microflow-SEC-MS
only when the h-HST column hardware was employed (Fig. 3C).
Interestingly, there was no difference in the ratio of tetramers
with glucose bound between the HO-PEO BEH and BEH Diol particles. In all cases, a high concentration of ConA (∼5 picomol)
was applied and evidence of column overload can be seen in the
form of peak tailing. Nevertheless, a comparison of the MS1 total ion chromatogram (TIC) between control, PNM, and Glu binding experiments showed clear differences, with new peaks corresponding to multiple binding events detected (Figure S4). In future work, it might be of interest to assess the limits of detection for protein-ligand complexes across a range of binding
affinities.
3.3. Application of small ID hardware to characterize therapeutic
complexes
For therapeutic complexes, reproducibility, sensitivity, and
specificity gains must be balanced with the speed of analysis. We
sought to benchmark the utility of the consistently best performing
column, the 1 × 50 mm h-HST/HO-PEO BEH column, across protein
therapeutic applications. Antibody hexamer structures, for example, routinely need characterization to qualify higher order structure features, including relative quantification of subunit to intact
species, clipped species and glycoforms. Yet, due to sensitivity issues exacerbated by the challenge to efficiently transmit high m/z
ions, native MS is generally performed with direct infusion and
static spray tips even when an SEC-UV or SEC-MALS method has
already been established [35,48-50]. For the first time, we have
detected a 900 kDa RGY antibody hexamer species from online native LC-MS. This allows the accurate quantification of the hexamer
to monomer ratio and to look at monomer glycoform enrichment
within the hexamer. As shown in Figure S5, the hexamer species
is chromatographically resolved from the antibody monomer. The
most abundant free monomer Ab species was 529.1 Da less in
mass than the hexamer-dissociated monomer (Fig. 5). This mass
difference corresponds to a HexNAcHex2 residue, confirming prior
work that showed higher-mass glycans are enriched in the hexamer complex [35].
This online SEC approach extends to hexamers formed from
different noncovalent protein subunits. In Fig. 6, the elution profiles of a three-protein complex (74 kDa) are shown. This protomer
structure assembles into a larger hexamer complex to form a 18
protein ternary structure of ∼443 kDa. There was a 0.3 min difference between the hexameric protein and monomer elution times,
enabling relative quantification and the potential to screen across
batches of drug product (Fig. 6ABCD). In Fig. 6F, the trimer pro9
E. Hecht, E. Obiorah, X. Liu et al.
Journal of Chromatography A 1685 (2022) 463638
Metrics, Inc. Q ExactiveTM is a trademark of Thermo Fisher Scientific.
tomer spectra is clearly observed. Comparing the spectra of 6E and
6F, two unique m/z distributions of the dimer are observed, which
provides distinction between the in-solution and gas phase generated species.
Protein-antibody complexes may also be examined with microflow SEC-MS. Lipase-antibody complexes are historically difficult to analyze due to the extensive glycan heterogeneity of the
lipase and the micromolar dissociation constants of the affinity interactions [51,52]. Interrogating these complexes is critical to refining downstream process parameters for a new drug, because host
cell lipases can bypass purification steps and be carried through
to therapeutic products [53]. To design effective purification strategies, the nature of these interactions must be characterized. We recently published work showing that certain complexes can be detected by direct infusion static spray, ion mobility, and microscale
thermophoresis (MST), but these approaches are not amenable to
use as high throughput screening techniques [36]. In the case of
MST, there can also be issues with labeling artifacts. Thus, an SEC
method has long been desired. As shown in Fig. 7, a PLBL2-IgG4
complex was detected at ∼5% the level observed by static spray.
However, SEC enabled the analysis of protein:Ab complexes at a
2:1 ratio, rather than a 10:1 lipase: Ab ratio. Microflow SEC seems
to have minimized ion suppression problems encountered with direct infusion. This advantage opens up the possibility of generating
concentration dose curves for complex formation, which would not
be achievable by static spray. The utility of the small dimension
columns seems therefore to lie in its sensitivity gains, its preservation of native states, and its subunit-level separations.
Data availability
The authors do not have permission to share data.
Acknowledgements
The authors would like to thank Yeliz Sarisozen and Nicole
Lawrence for providing SEC packing materials, Mathew DeLano
for helping to procure different types of column hardware, and
Steven Byrd for the preparation of packed columns. For assistance
in obtaining protein samples, we thank Bingchuan Wei and Shrenik
Mehta. We thank Wayne Fairbrother for scholarly conversations.
Supplementary materials
Supplementary material associated with this article can be
found, in the online version, at doi:10.1016/j.chroma.2022.463638.
References
[1] E. Boeri Erba, C. Petosa, The emerging role of native mass spectrometry in
characterizing the structure and dynamics of macromolecular complexes, Protein Sci. 24 (8) (2015) 1176–1192, doi:10.1002/pro.2661.
[2] A.C. Leney, A.J.R. Heck, Native mass spectrometry: what is in the
name? J. Amer. Soc. Mass Spectrom. 28 (1) (2017) 5–13, doi:10.1007/
s13361- 016- 1545- 3.
[3] G. Chen, L. Tao, Z. Li, Recent advancements in mass spectrometry for higher
order structure characterization of protein therapeutics, Drug Discov. Today 27
(1) (2022) 196–206, doi:10.1016/j.drudis.2021.09.010.
[4] J.F. Kellie, J.C. Tran, W. Jian, B. Jones, J.T. Mehl, Y. Ge, J. Henion, K.P. Bateman,
Intact protein mass spectrometry for therapeutic protein quantitation, pharmacokinetics, and biotransformation in preclinical and clinical studies: an industry perspective, J. Am. Soc. Mass Spectrometry 32 (8) (2021) 1886–1900,
doi:10.1021/jasms.0c00270.
[5] V. Kuzyk, G. Somesen, R. Haselberg, CE-MS for proteomics and intact protein
analysis, in: A. Colnaghi (Ed.), Separation Techniques Applied to Omics Sciences. Advances in Experimental Medicine and Biology, Springer, 2021.
[6] J. Sastre Toraño, R. Ramautar, G. de Jong, Advances in capillary electrophoresis
for the life sciences, J. Chromatogr. B 1118-1119 (2019) 116–136, doi:10.1016/j.
jchromb.2019.04.020.
[7] M. Dawod, N.E. Arvin, R.T. Kennedy, Recent advances in protein analysis by
capillary and microchip electrophoresis, Analyst 142 (11) (2017) 1847–1866,
doi:10.1039/c7an00198c.
[8] L. Schachner, G. Han, M. Dillon, J. Zhou, L. McCarty, D. Ellerman, Y. Yin,
C. Spiess, J.R. Lill, P.J. Carter, W. Sandoval, Characterization of chain pairing
variants of bispecific IgG expressed in a single host cell by high-resolution
native and denaturing mass spectrometry, Anal. Chem. 88 (24) (2016) 12122–
12127, doi:10.1021/acs.analchem.6b02866.
[9] J.F. Valliere-Douglass, W.A. McFee, O. Salas-Solano, Native intact mass determination of antibodies conjugated with Monomethyl Auristatin E and F at interchain cysteine residues, Anal. Chem. 84 (6) (2012) 2843–2849, doi:10.1021/
ac203346c.
[10] K. Muneeruddin, C.E. Bobst, R. Frenkel, D. Houde, I. Turyan, Z. Sosic,
I.A. Kaltashov, Characterization of a PEGylated protein therapeutic by ion exchange chromatography with on-line detection by native ESI MS and MS/MS,
Analyst 142 (2) (2017) 336–344, doi:10.1039/C6AN02041K.
[11] S. Tamara, M.A. den Boer, A.J.R. Heck, High-resolution native mass spectrometry, Chem. Rev. (2021), doi:10.1021/acs.chemrev.1c00212.
´ J.A. Loo, F. Lermyte, Higher[12] M. Zhou, C. Lantz, K.A. Brown, Y. Ge, L. Paša-Tolic,
order structural characterisation of native proteins and complexes by topdown mass spectrometry, Chem. Sci. 11 (48) (2020) 12918–12936, doi:10.1039/
D0SC04392C.
[13] M.S. Wilm, M. Mann, Electrospray and Taylor-Cone theory, Dole’s beam of
macromolecules at last? Int. J. Mass Spectrom. Ion Processes 136 (2) (1994)
167–180, doi:10.1016/0168- 1176(94)04024- 9.
[14] E.W. Chung, D.A. Henriques, D. Renzoni, C.J. Morton, T.D. Mulhern,
M.C. Pitkeathly, J.E. Ladbury, C.V. Robinson, Probing the nature of interactions
in SH2 binding interfaces–evidence from electrospray ionization mass spectrometry, Protein Sci. 8 (10) (1999) 1962–1970, doi:10.1110/ps.8.10.1962.
[15] P. Su, X. Chen, A.J. Smith, M.F. Espenship, H.Y. Samayoa Oviedo, S.M. Wilson, H. Gholipour-Ranjbar, C. Larriba-Andaluz, J. Laskin, Multiplexing of electrospray ionization sources using orthogonal injection into an electrodynamic
ion funnel, Anal. Chem. 93 (33) (2021) 11576–11584, doi:10.1021/acs.analchem.
1c02092.
[16] W. Kim, M. Guo, P. Yang, D. Wang, Microfabricated monolithic multinozzle
emitters for nanoelectrospray mass spectrometry, Anal. Chem. 79 (10) (2007)
3703–3707, doi:10.1021/ac070010j.
4. Conclusion
The need to improve the sensitivity and softness of native MS
analyses is particularly pressing in therapeutic areas, where screening of native protein-ligand binding must be performed in an automated and high throughput manner. SEC-MS is traditionally a slow
technique (at least ten minutes long) but it offers online separations, reproducibility, and a potentially universal, broadly applicable platform. Here, fast elution times of less than 1 minute and
no more than 3.5 minutes are achieved to better meet throughput
demands. Moreover, 10-fold and higher increases in signal are reported. Limits of detection were driven into the high attomole and
lower ranges by employing the microflow devices. Microflow SEC
as shown here also affords minor, but reproducible, separations between subunits. As such it is possible to detect multiple types of
quaternary structures. Coupled to multichannel emitters, we have
also demonstrated an improvement in maintaining the native state
of protein complexes such that it has become possible to detect
micromolar affinity complexes.
Clearly, there is a penalty to miniaturizing SEC without simultaneously making wholesale changes to the LC flowpath. The extra
column tubing and dispersion effects are of significant influence to
the apparent performance of the 1 mm ID column. Nevertheless, a
device that is capable of achieving half the effective peak capacity
of an optimized 4.6 mm ID SEC column represents a step forward
in downsizing size exclusion chromatography and creating increasingly powerful hyphenated analytical approaches.
Declaration of Competing Interest
The authors declare the following competing financial interest(s): Several of the authors are employed by Waters Corporation,
the manufacturer of the prototype columns used for this work and
several are employed by Genentech, Inc., which develops and markets drugs for profit. BEHTM , ACQUITYTM , and UPLCTM are trademarks of Waters Technologies Corporation. VanquishTM is a trademark of Dionex Softron GmbH. ByosTM is a trademark of Protein
10
E. Hecht, E. Obiorah, X. Liu et al.
Journal of Chromatography A 1685 (2022) 463638
[17] S. Su, G.T.T. Gibson, S.M. Mugo, D.M. Marecak, R.D. Oleschuk, Microstructured
photonic fibers as multichannel electrospray emitters, Anal. Chem. 81 (17)
(2009) 7281–7287, doi:10.1021/ac901026t.
[18] M. Moini, L. Jiang, S. Bootwala, High-throughput analysis using gated multiinlet mass spectrometry, Rapid Commun. Mass Spectrom. 25 (6) (2011) 789–
794, doi:10.1002/rcm.4924.
[19] R. Grandori, Origin of the conformation dependence of protein charge-state
distributions in electrospray ionization mass spectrometry, J. Mass Spectrom.
38 (1) (2003) 11–15, doi:10.1002/jms.390.
[20] S.K. Chowdhury, V. Katta, B.T. Chait, Probing conformational changes in proteins by mass spectrometry, J. Am. Chem. Soc. 112 (24) (1990) 9012–9013,
doi:10.1021/ja00180a074.
[21] L. Konermann, D.J. Douglas, Unfolding of proteins monitored by electrospray
ionization mass spectrometry: a comparison of positive and negative ion
modes, J. Am. Soc. Mass Spectrometry 9 (12) (1998) 1248–1254, doi:10.1016/
S1044-0305(98)00103-2.
[22] M. Haberger, M. Leiss, A.-K. Heidenreich, O. Pester, G. Hafenmair, M. Hook,
L. Bonnington, H. Wegele, M. Haindl, D. Reusch, P. Bulau, Rapid characterization of biotherapeutic proteins by size-exclusion chromatography coupled to
native mass spectrometry, Mabs 8 (2) (2016) 331–339, doi:10.1080/19420862.
2015.1122150.
[23] G.T. Roman, J.P. Murphy, Improving sensitivity and linear dynamic range of intact protein analysis using a robust and easy to use microfluidic device, Analyst
142 (7) (2017) 1073–1083, doi:10.1039/C6AN02518H.
[24] Y. Chen, P. Mao, D. Wang, Quantitation of intact proteins in human plasma
using top-down parallel reaction monitoring-MS, Anal. Chem. 90 (18) (2018)
10650–10653, doi:10.1021/acs.analchem.8b02699.
[25] A. Fernández-Pumarega, J.L. Dores-Sousa, S. Eeltink, A comprehensive investigation of the peak capacity for the reversed-phase gradient liquidchromatographic analysis of intact proteins using a polymer-monolithic capillary column, J. Chromatogr. A 1609 (2020) 460462, doi:10.1016/j.chroma.2019.
460462.
[26] Z. Liu, J. Ou, Z. Liu, J. Liu, H. Lin, F. Wang, H. Zou, Separation of intact proteins
by using polyhedral oligomeric silsesquioxane based hybrid monolithic capillary columns, J. Chromatogr. A 1317 (2013) 138–147, doi:10.1016/j.chroma.2013.
09.004.
[27] Y. Wang, B.M. Balgley, P.A. Rudnick, C.S. Lee, Effects of chromatography conditions on intact protein separations for top-down proteomics, J. Chromatogr. A
1073 (1) (2005) 35–41, doi:10.1016/j.chroma.2004.08.140.
[28] D.Y. Kong, S. Gerontas, R.A. McCluckie, M. Mewies, D. Gruber, N.J. TitchenerHooker, Effects of bed compression on protein separation on gel filtration
chromatography at bench and pilot scale, J. Chem. Technol. Biotechnol. 93 (7)
(2018) 1959–1965, doi:10.1002/jctb.5411.
[29] H.G. Barth, C. Jackson, B.E. Boyes, Size exclusion chromatography, Anal. Chem.
66 (12) (1994) 595–620, doi:10.1021/ac0 0 084a022.
[30] Z.L. VanAernum, F. Busch, B.J. Jones, M. Jia, Z. Chen, S.E. Boyken, A. Sahasrabuddhe, D. Baker, V.H. Wysocki, Rapid online buffer exchange for screening of
proteins, protein complexes and cell lysates by native mass spectrometry, Nat.
Protoc. 15 (3) (2020) 1132–1157, doi:10.1038/s41596- 019- 0281- 0.
[31] L.J. Brady, J. Valliere-Douglass, T. Martinez, A. Balland, Molecular mass analysis
of antibodies by on-line SEC-MS, J. Am. Soc. Mass Spectrometry 19 (4) (2008)
502–509, doi:10.1016/j.jasms.20 07.12.0 06.
[32] J. Jones, L. Pack, J.H. Hunter, J.F. Valliere-Douglass, Native size-exclusion
chromatography-mass spectrometry: suitability for antibody-drug conjugate
drug-to-antibody ratio quantitation across a range of chemotypes and drugloading levels, Mabs 12 (1) (2020) 1682895 -1682895, doi:10.1080/19420862.
2019.1682895.
[33] S. Fekete, M. DeLano, A.B. Harrison, S.J. Shiner, J.L. Belanger, K.D. Wyndham,
M.A. Lauber, Size exclusion and ion exchange chromatographic hardware modified with a hydrophilic hybrid surface, Anal. Chem. 94 (7) (2022) 3360–3367,
doi:10.1021/acs.analchem.1c05466.
[34] S. Fekete, L. Kizekai, Y.T. Sarisozen, N. Lawrence, S. Shiner, M. Lauber, Investigating the secondary interactions of packing materials for size-exclusion
chromatography of therapeutic proteins, J. Chromatogr. A 1676 (2022) 463262,
doi:10.1016/j.chroma.2022.463262.
[35] B. Wei, X. Gao, L. Cadang, S. Izadi, P. Liu, H.-M. Zhang, E. Hecht, J. Shim,
G. Magill, J.R. Pabon, L. Dai, W. Phung, E. Lin, C. Wang, K. Whang, S. Sanchez,
J. Oropeza Jr., J. Camperi, J. Zhang, W. Sandoval, Y.T. Zhang, G. Jiang, Fc galactosylation follows consecutive reaction kinetics and enhances immunoglobulin
[36]
[37]
[38]
[39]
[40]
[41]
[42]
[43]
[44]
[45]
[46]
[47]
[48]
[49]
[50]
[51]
[52]
[53]
11
G hexamerization for complement activation, Mabs 13 (1) (2021) 1893427 1893427, doi:10.1080/19420862.2021.1893427.
E.S. Hecht, S. Mehta, A.T. Wecksler, B. Aguilar, N. Swanson, W. Phung, A. Dubey
Kelsoe, W.H. Benner, D. Tesar, R.F. Kelley, W. Sandoval, A. Sreedhara, Insights
into ultra-low affinity lipase-antibody noncovalent complex binding mechanisms, Mabs 14 (1) (2022) 2135183, doi:10.1080/19420862.2022.2135183.
K.D. Wyndham, J.E. O’Gara, T.H. Walter, K.H. Glose, N.L. Lawrence, B.A. Alden,
G.S. Izzo, C.J. Hudalla, P.C. Iraneta, Characterization and evaluation of C18 HPLC
stationary phases based on ethyl-bridged hybrid organic/inorganic particles,
Anal. Chem. 75 (24) (2003) 6781–6788, doi:10.1021/ac034767w.
S.M. Moosavi, S. Ghassabian, Linearity of Calibration Curves for Analytical
Methods: A Review of Criteria for Assessment of Method Reliability, Calibration and Validation of Current Approaches, Intech Open, 2018.
H.-M. Park, V.J. Winton, J.J. Drader, S. Manalili Wheeler, G.A. Lazar, N.L. Kelleher, Y. Liu, J.C. Tran, P.D. Compton, Novel interface for high-throughput analysis of biotherapeutics by electrospray mass spectrometry, Anal. Chem. 92 (2)
(2020) 2186–2193, doi:10.1021/acs.analchem.9b04826.
I.D.G. Campuzano, T. San Miguel, T. Rowe, D. Onea, V.J. Cee, T. Arvedson, J.D. McCarter, High-throughput mass spectrometric analysis of covalent protein-inhibitor adducts for the discovery of irreversible inhibitors:
a complete workflow, SLAS Discov. 21 (2) (2016) 136–144, doi:10.1177/
1087057115621288.
M.O.J. Olson, I.E. Liener, Some physical and chemical properties of Concanavalin A, the Phytohemagglutinin of the Jack Bean∗ , Biochemistry 6 (1)
(1967) 105–111, doi:10.1021/bi00853a018.
D.F. Senear, D.C. Teller, Thermodynamics of concanavalin A dimer-tetramer
self-association: sedimentation equilibrium studies, Biochemistry 20 (11)
(1981) 3076–3083, doi:10.1021/bi00514a014.
A.K. Locke, B.M. Cummins, A.A. Abraham, G.L. Coté, PEGylation of Concanavalin
A to improve its stability for an in vivo glucose sensing assay, Anal. Chem. 86
(18) (2014) 9091–9097, doi:10.1021/ac501791u.
R.D. Gray, R.H. Glew, The kinetics of carbohydrate binding to Concanavalin A,
J. Biol. Chem. 248 (21) (1973) 7547–7551, doi:10.1016/S0021- 9258(19)43325- 5.
Y. Marikar, B. Zachariah, D. Basu, Leaching of concanavalin A during affinity chromatographic isolation of cell surface glycoproteins from human fetal
neurons and glial cells, Anal. Biochem. 201 (2) (1992) 306–310, doi:10.1016/
0 0 03- 2697(92)90343- 6.
W.D. van Dongen, A.J.R. Heck, Binding of selected carbohydrates to apoconcanavalin A studied by electrospray ionization mass spectrometry, Analyst
125 (4) (20 0 0) 583–589, doi:10.1039/A907957B.
A.F.M. Gavriilidou, B. Gülbakan, R. Zenobi, Influence of ammonium acetate concentration on receptor–ligand binding affinities measured by native nano ESIMS: a systematic study, Anal. Chem. 87 (20) (2015) 10378–10384, doi:10.1021/
acs.analchem.5b02478.
J.M. Sopp, S.J. Peters, T.F. Rowley, R.J. Oldham, S. James, I. Mockridge,
R.R. French, A. Turner, S.A. Beers, D.P. Humphreys, M.S. Cragg, On-target IgG
hexamerisation driven by a C-terminal IgM tail-piece fusion variant confers
augmented complement activation, Commun. Biol. 4 (1) (2021) 1031, doi:10.
1038/s42003- 021- 02513- 3.
M.A. den Boer, S.-H. Lai, X. Xue, M.D. van Kampen, B. Bleijlevens, A.J.R. Heck,
Comparative analysis of antibodies and heavily glycosylated macromolecular
immune complexes by size-exclusion chromatography multi-angle light scattering, native charge detection mass spectrometry, and mass photometry, Anal.
Chem. 94 (2) (2022) 892–900, doi:10.1021/acs.analchem.1c03656.
J.-F. Greisch, M.A. den Boer, S.-H. Lai, K. Gallagher, A. Bondt, J. Commandeur,
A.J.R. Heck, Extending native top-down electron capture dissociation to MDa
immunoglobulin complexes provides useful sequence tags covering their critical variable complementarity-determining regions, Anal. Chem. 93 (48) (2021)
16068–16075, doi:10.1021/acs.analchem.1c03740.
B. Tran, V. Grosskopf, X. Wang, J. Yang, D. Walker, C. Yu, P. McDonald, Investigating interactions between phospholipase B-Like 2 and antibodies during Protein A chromatography, J. Chrom. A 1438 (2016) 31–38, doi:10.1016/j.chroma.
2016.01.047.
M. Vanderlaan, W. Sandoval, P. Liu, Hamster phospholipase B-like 2 (PLBL2), a
host cell protein impurity in CHO-derived therapeutic monoclonal antibodies,
BioProcess Int. 13 (2015) 18–29.
M. Vanderlaan, J. Zhu-Shimoni, S. Lin, F. Gunawan, T. Waerner, K.E. Van Cott,
Experience with host cell protein impurities in biopharmaceuticals, Biotechnol.
Prog. 34 (4) (2018) 828–837, doi:10.1002/btpr.2640.