Comparison of solid-phase extraction methods for efficient purification of phosphopeptides with low sample amounts
Bạn đang xem bản rút gọn của tài liệu. Xem và tải ngay bản đầy đủ của tài liệu tại đây (1.77 MB, 8 trang )
Journal of Chromatography A 1685 (2022) 463597
Contents lists available at ScienceDirect
Journal of Chromatography A
journal homepage: www.elsevier.com/locate/chroma
Comparison of solid-phase extraction methods for efficient
purification of phosphopeptides with low sample amounts
Fanni Bugyi a,b , Gábor Tóth a , Kinga Bernadett Kovács c , László Drahos a , Lilla Turiák a,∗
a
MS Proteomics Research Group, Research Centre for Natural Sciences, Magyar tudósok kưrútja 2, 1117 Budapest, Hungary
Hevesy György PhD School of Chemistry, Eötvös Loránd University, Pázmány Péter sétány 1/a, 1117 Budapest, Hungary
c
˝
Department of Physiology, Semmelweis University, Tuzoltó
utca 37-47, H-1094 Budapest, Hungary
b
a r t i c l e
i n f o
Article history:
Received 3 September 2022
Revised 10 October 2022
Accepted 21 October 2022
Available online 23 October 2022
Keywords:
Solid-phase extraction
Purification
Phosphopeptide
Enrichment
Mass spectrometry
a b s t r a c t
Efficient phosphoproteomic analysis of small amounts of biological samples (e.g. tissue biopsies) requires
carefully selected enrichment and purification steps prior to the nanoflow HPLC-MS/MS analysis. Solidphase extraction (SPE) is one of the most commonly used approaches for sample preparation. Several
stationary phases are available for peptide SPE purification, however, most of the published methods
are not optimized to provide good recoveries of phosphorylated peptides. Our goal was to investigate
the performance of 13 self-packed and 3 commercial centrifugal SPE cartridges/spin tips, thus enhancing the efficiency of the phosphoproteomic analysis of small amounts of complex protein mixtures. Eight
reversed-phase (RP), five graphite, two ion-exchange, and one hydrophilic-lipophilic balance (HLB) stationary phase were evaluated. Two RP, one graphite, and the HLB self-packed centrifugal SPE tips provided excellent results for the purification of 1 μg tissue and cell line digests. Using these methods, the
sample loss was significantly reduced compared to one of the commercial SPE methods, 22-58% more
unique phosphopeptides were identified, and the recovery was higher by 132-155%.
© 2022 The Author(s). Published by Elsevier B.V.
This is an open access article under the CC BY license ( />
1. Introduction
Reversible phosphorylation is one of the most common posttranslational modifications (PTMs) of proteins, which plays a key
role in many biological processes [1,2]. The most widespread technique for high-throughput analysis of complex biological samples
is shotgun proteomics based on nanoflow HPLC-MS investigations
and bioinformatics [3,4]. During this process, proteins are enzymatically cleaved into peptides (digestion) facilitating better separation and identification of the target compounds. This approach
requires several sample preparation steps such as enrichment and
purification of the phosphopeptide mixtures for reproducible and
efficient analytical measurements [5,6]. Sample clean-up is a vital
step in proteomics since the interfering contaminants (e.g. salts,
detergents, buffers, and remaining enzymes) can highly influence
the ionization efficiency and sensitivity of peptides and phosphopeptides (PPs). In particular, commonly used reagents during PP
enrichment (e.g. hydroxy acids and glycerin) tend to stick to the
metal parts of the instrument, resulting in clogging, peak tailing,
and reduced stability of the spray. Thus, the purification after PP
∗
Corresponding author: Dr. Lilla Turiák, MS Proteomics Research Group, Research
Centre for Natural Sciences, Magyar tudósok kưrútja 2, 1117 Budapest, Hungary.
E-mail address: (L. Turiák).
enrichment is inevitable with the additional benefit of prolonging
the lifetime of the columns and HPLC-MS equipment.
The most common method for purifying protein digests is solid
phase-extraction (SPE) with reversed-phase (RP) loading [7–10].
The primarily used stationary phase in the field of peptide cleaning
is silica-based sorbents functionalized by C18 chains. Hydrophiliclipophilic balance (HLB) polymeric sorbent is also favorable in proteomic sample preparation due to its ability to retain a wide spectrum of polar and nonpolar compounds [11,12]. There are many
comparative studies in the literature about different RP SPE methods for the analysis of various biological samples, like salivary proteome, porcine retinal protein markers, or human plasma [13–17].
Most of these studies focus on different aspects of performance
like the number of identified proteins, reproducibility, binding capacity, desalting efficiency, or analysis time. Several parameters
may be optimized to increase the efficiency of RP SPE approaches
for the purification of the hydrophilic PPs. For example, cooling the
spin tips extends the identification coverage of PPs and enhances
the precision of the quantitative analysis [18].
Graphite-based stationary phases are commonly used in the
chromatographic separation of polar components due to their excellent recovery and chromatographic efficiency [19]. Their proteomic application is currently on the rise, being mainly used
in the investigation of polar post-translational modifications (e.g.
/>0021-9673/© 2022 The Author(s). Published by Elsevier B.V. This is an open access article under the CC BY license ( />
F. Bugyi, G. Tóth, K.B. Kovács et al.
Journal of Chromatography A 1685 (2022) 463597
glycosylation) and small hydrophilic peptides in both chromatographic and SPE setups [20–23]. Graphite-based SPE methods may
enhance the detection of PPs and provide complementary selectivity since a significant number of PPs are not retained well on
conventional RP sorbents [24].
Electrostatic repulsion hydrophilic interaction liquid chromatography (ERLIC), strong cation exchange (SCX), hydrophilic interaction liquid chromatography (HILIC), and high-pH RP methods are
also applicable for phosphoproteomic sample preparation. ERLIC
and SCX chromatography are feasible mainly for the isolation of
the non-, mono-, and multi-phosphorylated peptides, while HILIC
and high-pH RP chromatography are suitable for additional separation to RP chromatography during the HPLC-MS analysis [5,25-28].
Based on our previous experience, sample loss of 50-60% may
occur during the purification of phosphoproteomic samples in the
case of commonly used C18 SPE methods. Despite a large number of stationary phases available on the market, detailed screening of phosphoproteomic-centered methods has still been lacking.
In this study, we investigated the purification performance of 13
self-packed and 3 commercial centrifugal SPE cartridges/spin tips
and outlined optimized methods for phosphoproteomic analysis of
small amounts of complex protein mixtures.
with LysC-Trypsin mixture for 1 hour (1:100 protein:enzyme ratio, 37°C), and with trypsin for 2 hours (1:25 protein:enzyme ratio,
37°C). The digestion was stopped with FA and the solvents were
evaporated. Cleaning of the peptide mixture was performed using
Isolute C18 (EC) SPE 100 mg/1 mL columns (Biotage, Uppsala, Sweden) as follows. The column was activated with 1.5 mL 100% ACN,
with 1.5 mL 50 mM citric acid in ACN/H2 O, 50:50 (v/v) and with
1.5 mL 0.1% TFA in ACN/H2 O, 50:50 (v/v), then equilibrated with
1.5 mL 0.5% TFA in ACN/H2 O, 5:95 (v/v), and with 1.5 mL loading solvent (0.1% TFA in MeOH/H2 O, 5:95 (v/v)). The samples were
loaded onto the column in 60 μL loading solvent and washed with
1.5 mL of loading solvent. Elution was performed with 1.5 mL 0.1%
TFA in ACN/H2 O, 70:30 (v/v). Then the samples were lyophilized
and stored at -20°C until usage.
2.4. Phosphopeptide enrichment
PierceTM TiO2 Spin Tips (Unicam Plc., Budapest, Hungary) were
used for the enrichment of PPs of both rat smooth muscle digest
and HeLa digest as previously described [30]. Briefly, the column
was activated with 2 × 50 μL wash buffer (0.1% TFA in ACN/H2 O,
40:60 (v/v)) and conditioned with 2 × 50 μL loading buffer (50
mM citric acid, 1.5% TFA in ACN/H2 O, 80:20 (v/v)). The sample
was loaded and re-loaded in 150 μL loading buffer and washed
with 2 × 50 μL loading buffer and with 2 × 50 μL wash buffer. The
PPs were eluted with 1 × 50 μL NH3 (25 m/m% in H2 O)/ACN/H2 O,
16:80:4 (v/v)) and with 2 × 50 μL 4 m/m% NH3 (in H2 O). After every step, tips were centrifuged at 20 0 0 g for 2 minutes, except for
sample loading (10 0 0 g for 10 minutes) and elution (10 0 0 g for
5 minutes). The enriched samples were lyophilized and stored at
–20°C until further use.
2. Materials and methods
2.1. Reagents
Acetonitrile (ACN), LC-MS grade water (H2 O), methanol (MeOH),
and LC-MS grade formic acid (FA) were purchased from VWR International (Debrecen, Hungary). Citric acid (CA), trifluoroacetic acid
(TFA), and heptafluorobutyric acid (HFBA) were purchased from
Sigma-Aldrich (Budapest, Hungary).
2.5. Preparation of the self-packed centrifugal SPE tips
2.2. Samples
Stationary phases of analytical columns and SPE cartridges (indicated in Table 1 with SP sign) were used for the preparation of
the self-packed centrifugal SPE tips. 2 × 100 μL 50 mg/mL methanol
suspension (10 mg resin in total) was pipetted into the empty Glygen fritless SPE pipette tip (SunChrom GmbH, Friedrichsdorf Germany) and then centrifuged at 50 0 0 g for 2 minutes.
A mixture of 1 μg of rat smooth muscle digest enriched for PPs
and 250 fmol Enolase MassPrep Phosphopeptide mix (Waters Hungary, Budapest, Hungary) was used for testing the purification performance of the 16 different SPE cartridges/spin tips. Male Wistar rats (170–250 g, Charles River Laboratories-Semmelweis University, Budapest) were kept on a standard semisynthetic diet. Our
research conforms to the Guide for the Care and Use of Laboratory
Animals (NIH, 8th edition, 2011) as well as national legal and institutional guidelines for animal care. They were approved by the
Animal Care Committee of the Semmelweis University, Budapest
and by Hungarian authorities (No. 001/2139-4/2012).
The second set of experiments was performed on SPE cartridges/spin tips considered to be the most effective for PP purification. 1 μg Pierce HeLa tryptic digest (Unicam Plc., Budapest,
Hungary) enriched for PPs mixed with 250 fmol Enolase MassPrep
Phosphopeptide mix was used for these experiments.
2.6. SPE sample purification
The SPE purifications were performed with 3 commercial and
13 self-packed centrifugal SPE tips. Altogether, 16 different stationary phases were investigated (Table 1), eight reversed phase (RP),
five graphite (G), one strong cation exchanger (SCX), one weak
anion exchanger (WAX), and one hydrophilic-lipophilic balance
copolymer (HLB). Detailed protocols for each purification method
are shown in Table S1. After elution, solvents were evaporated using a heated vacuum centrifuge and stored at –20°C until analysis.
The resulting samples were reconstituted in 8 μL injection solvent
(0.1% FA in ACN/H2 O, 2:98 (v/v)), of which 6 μL was injected.
1 μg rat smooth muscle digest and 1 μg HeLa digest enriched for PPs were used for testing the purification performance
of each method. Both samples contained an additional 250 fmol
Enolase MassPrep Phosphopeptide mix. Four parallel experiments
were performed for the rat sample, and six for the HeLa sample.
No unique control samples were prepared for each method, as it
would have doubled the experimental work and instrument time.
Rather we chose to use a universal control; 1 μg phosphopeptide
enriched but unpurified mixture of rat/HeLa digest and 250 fmol
Enolase MassPrep Phosphopeptide mix were used. This provided
information about the hydrophobic and acidic nature of the sample and gave an estimation on the amount of phosphopeptides lost
during purification.
2.3. Tryptic digestion of rat smooth muscle cells
Rat smooth muscle cells were isolated as previously described
[29], and lysed using the cOmplete Protease Inhibitor (Roche Applied Science, Basel, Switzerland), the cells were incubated at 60°C
for 30 min, sonicated for 45 sec, and then centrifuged at 4°C for
10 min with 180 0 0 g. The pellet was removed, and the buffer of
the supernatant was exchanged to 50 mM ammonium bicarbonate. Then the proteins were unfolded by 0.5% Rapigest and reduced
with 200 mM dithiothreitol in 5% MeOH + 50 mM ammonium bicarbonate solution, incubated at 60°C for 30 minutes. Then proteins were alkylated with 200 mM iodoacetamide in 200 mM ammonium hydrogen carbonate solution and incubated for 30 minutes at room temperature in dark. Then proteins were digested
2
F. Bugyi, G. Tóth, K.B. Kovács et al.
Journal of Chromatography A 1685 (2022) 463597
Table 1
The applied stationary phases and their attributes. PGC: Porous Graphitic Carbon; SP: self-packed; C: commercial.
ID
SORBENT
PARTICLE SIZE (μm)
MANUFACTURER/TYPE
SELF-PACKED/ COMMERCIAL
AMOUNT OF SORBENT USED (mg)
RP-1
RP-2
RP-3
RP-4
RP-5
RP-6
RP-7
RP-8
G-1
G-2
G-3
G-4
G-5
HLB
SCX
WAX
C18
RP
C18
C18
C8
RP
RP
C18
PGC
PGC
Graphite
Graphite+C18
Graphite
HLB
SCX
WAX
5
5
5
5
5
5
5
N.A.
5
3
37-125
N.A.
N.A.
30
5
60
Kromasil-100-5-C18
Phenomenex Ultracarb ODS(30)
Sigma-Aldrich Discovery HS C18
Waters XSelect HSS C18 SB
Waters Sunfire C8
Phenomenex Ultracarb ODS(20)
Thermo Hypersil Gold
Thermo Pierce C18
Thermo Hypercarb
Thermo Hypercarb
Supelco Envi-Carb
Glygen TopTip
Thermo Pierce Graphite
Waters Oasis HLB
Phenomenex Luna SCX
Waters Oasis WAX
SP
SP
SP
SP
SP
SP
SP
C
SP
SP
SP
C
C
SP
SP
SP
10
10
10
10
10
10
10
9
10
10
10
10
10
10
10
10
@ NTerm Q | rare1; Glu->pyro-Glu/-18.010565 @ NTerm E | rare1;
Ammonia-loss/-17.026549 @ NTerm C | rare1; Acetyl/+42.010565
@ Protein NTerm | rare1; Phospho/+79.966331 @ S, T, Y | common3; Deamidated/+0.984016 @ N, Q | rare1; Methyl/+14.015650
@ NTerm, H, K, N, R | rare1. The common modifications were maximized in 3 instances, and the rare modifications were limited to 2
in the case of the rat sample, and it was 1 in the case of the HeLa
sample. From the hits, only peptides with less than a 5% probability of false identification (AbsLogProb ≥ 1.3) were considered reliable hits.
Compass Data Analysis v4.3 was used for the integration of extracted ion chromatogram (EIC) peak areas (AUC). Recovery was
calculated using the four synthetically phosphorylated Enolase
peptides by dividing the given AUC with AUC values measured in
the respective control samples. The isoelectric points were calculated using the IPC – Isoelectric Point Calculator by Kozlowsky [32],
and GRAVY (Grand Average of Hydropathy) scores [33] were calculated by an in-house developed function.
2.7. Mass spectrometry and chromatography analysis
For nanoLC-MS/MS analysis, a Dionex Ultimate 30 0 0 RSLC
nanoLC (Dionex, Sunnyvale, CA, USA) coupled to a Bruker Maxis II
Q-TOF (Bruker Daltonik GmbH, Bremen, Germany) via CaptiveSpray
nanoBooster ionization source was used. Trapping was performed
on an Acclaim PepMap100 C18 trap column (5 μm, 100 μm × 20
mm, Thermo Fisher Scientific, Waltham, MA, USA) with 0.01%
HFBA and 0.1% TFA (H2 O) transport liquid. Then peptides were separated on a Waters Acquity M-Class BEH130 C18 analytical column
at 48°C (1.7 μm, 75 μm × 250 mm) using gradient elution: isocratic
hold at 4% Solvent B for 11 minutes, then elevating Solvent B to
20% in 75 minutes, and to 40% in 15 minutes. Solvent A was 0.1%
FA in H2 O, Solvent B was 0.1% FA in ACN, and the flow rate was
300 nL min−1 .
For MS analysis, data-dependent acquisition measurements
were performed. Spectra were collected with 2.5 sec cycle time
and with a dynamic MS/MS exclusion of the same precursor for
2 min, or if its intensity was at least 3 times larger than before.
Preferred charge states were set between +2 and +5. MS spectra
were acquired at 3 Hz in the 150-2200 m/z range, collision-induced
dissociation was performed on multiply charged precursors at 16
Hz (intensity > 40 0 0 0) and 4 Hz (intensity < 40 0 0 0) for abundant and low-abundance ones, respectively. Collision energies used
were optimized previously to maximize peptide identification [31].
Internal calibration was performed by infusing sodium formate and
data were automatically recalibrated using the Compass Data Analysis (v4.3; Bruker Daltonik GmbH, Bremen, Germany) software.
2.9. Data visualization and availability
Data visualization was done using Microsoft Excel and VIB-BEG
Venn-diagram maker [34]. The graphical abstract was created with
BioRender.com. The mass spectrometry proteomics data have been
deposited to the MassIVE data repository with the dataset identifier MSV0 0 0 090215.
3. Results and discussion
2.8. Data analysis
We compared 16 different stationary phases to investigate the
efficiency of the purification of complex phosphopeptide mixtures.
The purification performance was primarily characterized based on
the number of identified PPs and the recovery. A detailed comparison of the selectivity of the methods based on the hydrophobicity and isoelectric point distributions of the identified PPs was
performed. The best-performing SPE methods were further investigated by the purification of phospho-enriched HeLa cell line digest.
During the experimental planning, our aim was to use the same
protocols for the SPE methods with the same types of sorbents.
Furthermore, in most of the cases, the manufacturer protocols of
commercial SPE cartridges were used. For RP 1-8 SPE methods,
an improved version of the manufacturer protocol of the commercial RP-8 SPE method was applied [35]. For the graphite-based SPE
methods (G-1, G-2, G-3, and G-5), the manufacturer protocol of
the commercial G-5 SPE method was applied. For the graphite+C18
based G-4 SPE method, its manufacturer protocol was applied. The
protocols for HLB and WAX SPE methods were based on the man-
Byonic (v3.6.0, Protein Metrics Inc, San Carlos, CA, USA) was
used for the database search as follows. Uniprot rat database (containing 29942 sequences, downloaded on 10/2020) was used for
the rat smooth muscle sample. Uniprot human database (containing 75069 sequences, downloaded on 10/2020) was used for HeLa
cell line sample. For the rat sample, a focused database was prepared with loose criteria (2% false discovery rate (FDR), other parameters same as the strict search), then the searches were performed against this focused database (containing 175 sequences)
to maximize PTM identification performance. The parameters for
the strict search and for the HeLa cell line sample were the following: precursor mass tolerance of 15 ppm, fragment mass tolerance of 20 ppm, cleavage at lysine and arginine C terminal,
maximum 2 missed cleavages, and 1% FDR limit. The set PTMs
were the following: Carbamidomethyl/+57.021464 @ C | fixed;
Oxidation/+15.994915 @ M | common2; Gln->pyro-Glu/-17.026549
3
F. Bugyi, G. Tóth, K.B. Kovács et al.
Journal of Chromatography A 1685 (2022) 463597
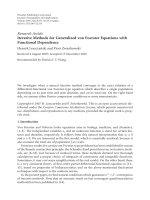
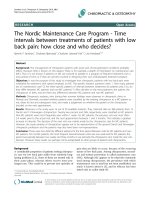
3.1.2. Recovery
Recoveries of the synthetic PPs (HLADLpSK, NVPLpYK, VNQIGpTLSESIK, and VNQIGTLpSEpSIK) were calculated as described in
Section 2.8 for each method. The G-2 method gave the best recoveries for all four PPs (102-179%). Some other methods, like RP3, RP-5, RP-2, HLB, and G-1 also showed good performance; a recovery of at least 85% was measured for all the four components
using these methods (Fig. 1B). Recovery over 100% is a common
phenomenon when working with enriched or purified proteomics
samples containing a relatively low number of proteins. This either indicates matrix effect or it is due to removing contaminants
or other peptides from the samples causing lower ion suppression,
thus a higher recovery. In general, the recovery was the highest for
peptides containing pSpS and pS motifs (on average 120% and 98%,
respectively), while for peptides containing pT and pY it was significantly lower (on average 80% and 72%, respectively). Besides the
pS and pSpS motifs, HLADLpSK and VNQIGTLpSEpSIK peptides contain more apolar amino acids, which might play a key role in their
binding to the RP stationary phase. The WAX spin tips performed
poorly for pS- and pY-containing PPs (3% and 8%, respectively), but
relatively well for pT- and pSpS-containing PPs (62% and 103%, respectively). The unexpectedly high recovery of the peptide carrying a pT motif might appear due to the structure of this peptide,
the negatively charged glutamic acid might bind stronger to the
stationary phase. The two negatively charged phosphate groups on
the doubly phosphorylated peptide ensure strong retention on the
positively charged stationary phase resulting in high recovery of
the peptide. In contrast, the poor recovery of the doubly phosphorylated peptides (8%) using SCX spin tips reflects that the peptide
could not be positively charged enough for retention due to the
two negatively charged phosphate groups.
Fig. 1. Identification performance and recovery of the investigated SPE methods
during the purification of rat digest sample. a) proportion of unique PPs identified
in samples prepared by different SPE methods compared to the control sample; b)
recovery of the synthetically phosphorylated enolase peptides carrying one pS, pY,
pT, and pSpS motifs. For each method, the result of 4 parallel experiments were
combined.
ufacturer’s recommendations. For the SCX SPE method, one of the
University of Washington Proteomics Resource’s protocols (Peptide
fractionation and Clean-Up Protocols) has been applied [36].
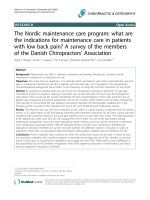
3.1.3. Selectivity
Different spin tips can show higher selectivity for certain peptides according to their hydrophilic/hydrophobic and acidic properties. The GRAVY score expresses the degree of hydrophobicity
of peptides; the more positive the GRAVY score, the more hydrophobic the peptide. The distributions of the hydrophobicity of
the unique PPs identified after purification with RP and graphite
spin tips were highly similar to those of the unpurified control
sample. The number of identified PPs with hydrophobic properties
(GRAVY score > 0) decreased by 2-10%, and the number of identified PPs with highly hydrophilic properties (GRAVY score < —2) increased by up to 12% (Fig. 2A). Using the HLB spin tips, 32% of the
identified PPs were highly hydrophilic (GRAVY score < –2), while
only 4% of identified PPs had hydrophobic properties (GRAVY score
> 0). This difference is attributed to the surface chemistry of the
HLB being developed for stronger retention towards hydrophilic
species [16]. Using the SCX spin tips, no PPs were identified with
hydrophobic properties (GRAVY score > 0). However, the WAX spin
tips showed stronger selectivity for highly hydrophobic PPs, 8% of
the identified PPs had a GRAVY score over 1.
Using most of the investigated RP and graphite spin tips, the
identified PPs had similar acidic distributions to those of the unpurified control sample (Fig. 2B). However, using RP-4, G-1, G-3,
G-5, HLB, and SCX spin tips, 69-84% of the identified PPs were in
the isoelectric point (pI) range 3–5 and 16–31% of them were in
the pI range 5–7, while 62% and 31% of PPs identified in the control sample were in the pI range 3–5 and 5–7, respectively. In contrast, the WAX spin tips had stronger selectivity for PPs with basic
properties, 25% of the PPs had a pI greater than 7, while 8% of PPs
identified in the control sample had a pI greater than 7.
3.1. Initial screening of 16 SPE methods with rat smooth muscle
sample
For testing the purification performance of the 13 self-packed
centrifugal SPE spin tips and 3 commercial SPE spin tips/cartridges,
we used the mixture of 1 μg of rat smooth muscle digested and
enriched for PPs and 250 fmol commercially available Enolase
tryptic digest containing four synthetically phosphorylated peptides (serine, pS (HLADLpSK); threonine, pT (VNQIGpTLSESIK); tyrosine, pY (NVPLpYK); and double serine phosphorylated, pSpS
(VNQIGTLpSEpSIK)).
3.1.1. Identification performance
The number of unique PPs (PPs identified in at least one out of
the four parallel samples) relative to those identified in the unpurified control sample was within a wide range (from -52% to +171%)
using the different SPE tips (Fig. 1A). Using the HLB, RP-3, and RP2 SPE tips, 1.71, 1.48, and 1.43 times more unique PPs were identified compared to the control sample, respectively. The SCX SPE
tips and the WAX SPE tips showed the worst performance, 48%
and 5% fewer PPs were identified than in the unpurified control
sample. One possible explanation is that during the SPE loading
step, the phosphorylated peptides bearing a net negative charge
could not bind to the negatively charged SCX stationary phase. On
the other hand, positively charged PPs could not bind to the positively charged WAX stationary phase. A similar trend was seen for
the average number of identified PPs as well, but the repeatability
(standard deviation regarding the number of identified PPs) of the
RP-2, RP-8, and G-3 methods was superior as compared to the others (Table S2). The ratio of identified PPs in a sample was between
36% and 64% in the case of almost every SPE method. We observed
two extremities: the PP ratio was 11%, and 72% in the case of SCX
and WAX SPE methods, respectively (Table S2).
3.1.4. Summary of initial screening
Many of the investigated self-packed spin tips proved equally
suitable for the purification of rat smooth muscle samples. RP4
F. Bugyi, G. Tóth, K.B. Kovács et al.
Journal of Chromatography A 1685 (2022) 463597
Fig. 2. Selectivity of the investigated SPE methods during initial screening. Relative
distribution of unique PPs of a) GRAVY score range, b) pI range. For each method,
the result of 4 parallel experiments were combined.
2, RP-3, RP-5, G-1, G-2, and HLB centrifugal SPE tips performed
outstandingly regarding the identification and/or recovery. Most of
these SPE tips were unbiased regarding the hydrophobicity and
acidity of PPs, HLB SPE tips showed higher selectivity for hydrophilic peptides and/or peptides with higher acidic properties.
The purification performance of these SPE tips was subjected to
further investigation. Based on the identification performance and
recovery, the tested SCX methodology is not applicable for the
purification of PPs. Although WAX spin tips performed well for
doubly phosphorylated peptides compared to monophosphorylated
peptides, RP and graphite setups proved to be more suitable for the
purification of samples containing highly phosphorylated peptides.
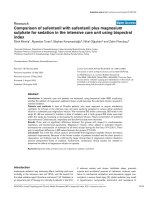
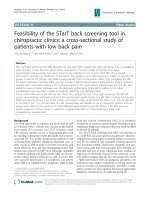
Fig. 3. Identification performance and recovery of the investigated SPE methods
during the purification of HeLa cell line sample. a) number of unique PPs identified in samples prepared by different SPE methods; b) recovery of the synthetically
phosphorylated enolase peptides carrying one pS, pY, pT, and pSpS motifs. For each
method, the result of 6 parallel experiments were combined.
for RP-2 spin tips, and 62-76% for RP-3 spin tips. Commercial RP-8
SPE cartridges and self-packed RP-5 spin tips showed the lowest
recovery, 20-38%, and 32-50%, respectively. The overall recovery of
the Enolase peptides showed a different distribution than in the
experiments with the rat smooth muscle sample. This difference is
mainly attributed to the different origins of the sample resulting
in altered quantity and physicochemical properties of the peptides.
The recovery was the highest for the pS-containing peptide, on average 67%. However, the pY- and pT-containing peptides had also
relatively high recovery values, on average 60% and 61%, respectively. The pSpS-containing peptide had the lowest recovery, on
average 47%. The retention of the doubly phosphorylated peptides
was weaker than the retention of mono-phosphorylated peptides,
thus during the sample loading step, more doubly phosphorylated
peptides might be lost.
3.2. Additional performance estimation of 7 selected SPE methods
with HeLa cell lysate
The selected self-packed centrifugal spin tips (RP-2, RP-3, RP-5,
G-1, G-2, HLB SPE tips) were further investigated with an alternative sample type: HeLa cell line digest, previously enriched for PPs
(Enolase MassPrep Phosphopeptide mix added). RP-8 SPE cartridge
was also included for comparison with a commercial setup.
3.2.1. Identification performance
The number of unique PPs identified was the highest using RP2, RP-3, and HLB spin tips, 1774, 1525, and 1373 PPs, respectively
(Fig. 3A). The average number of identified PPs were the highest
using the RP-2 (1052 ± 159), RP-3 (915 ± 88), and G-2 (803 ±
56) spin tips (Table S3). The fewest PPs were identified using the
RP-8 SPE cartridge (706 ± 32 on average, and 1124 unique PPs),
however, the standard deviation of the number of identified PPs
was one of the lowest. The ratio of the identified PPs in a sample
was 137-147% in the case of the spin tips and the control sample,
and it was 114% using the commercial RP-8 SPE cartridges (Table
S3). This slight decrease in the ratio of the PPs may be attributed
to a loss of PPs with hydrophilic character during sample loading.
3.2.3. Selectivity
The selectivity of the investigated centrifugal spin tips and cartridges was unbiased in terms of the hydrophobicity and acidity of
the identified PPs compared to the unpurified control sample (Fig.
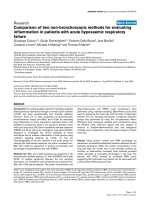
S1A and Fig. S1B). However, large differences in the identified individual peptides were observed. Altogether 2630 unique PPs were
identified in the samples prepared with RP-2, RP-3, G-1, HLB spin
tips, and in the control sample (Fig. 4). 710 unique PPs (27%) were
identified in the case of all 4 spin tips, and the unpurified control
sample. Nearly 30% of PPs were identified using only one method
(116, 207, 80, 123 PPs using RP-3, RP-2, G-2, and HLB spin tips,
respectively, and 268 PPs in the control sample), and nearly 50%
of the PPs were identified in the case of at least 3 methods. It is
in correlation with recently published data, 10-37% of the identified proteins are unique for different SPE methods during peptide
clean-up [13,14]. The different selectivity of these self-packed centrifugal spin tips originates from the slight differences in the surface chemistry of the stationary phases.
3.2.2. Recovery
The recovery of the selected spin tips for the four synthetically
phosphorylated Enolase peptides was similar to those of the rat
smooth muscle sample (Fig. 3B). G-2, RP-2, and RP-3 spin tips performed well, the recovery was 58-88% for G-2 spin tips, 54-79%
5
F. Bugyi, G. Tóth, K.B. Kovács et al.
Journal of Chromatography A 1685 (2022) 463597
Table 2
Summary of the performance of the investigated SPE methods.
Rat smooth muscle sample
ID
Identification
Recovery (n = 4)
Selectivity
RP-2
RP-3
RP-5
RP-8
G-1
G-2
HLB
Number of unique
PPs
Ratio of PPs
HLADLpSK
NVPLpYK
VNQIGpTLSESIK
VNQIGTLpSEpSIK
Hydrophobicity
30
31
29
24
27
28
36
65%
110% ± 21%
89% ± 18%
93% ± 20%
153% ± 24%
unbiased
52%
119% ± 18%
88% ± 17%
104% ± 19%
191% ± 16%
unbiased
56%
113% ± 24%
92% ± 18%
95% ± 6%
156% ± 5%
unbiased
64%
54% ± 33%
31% ± 13%
49% ± 13%
59% ± 34%
unbiased
53%
120% ± 24%
92% ± 21%
85% ± 25%
133% ± 64%
unbiased
45%
148% ± 15%
106% ± 14%
102% ± 11%
179% ± 10%
unbiased
Acidity
unbiased
unbiased
unbiased
unbiased
unbiased
unbiased
52%
117% ± 14%
84% ± 15%
92% ± 7%
162% ± 11%
Higher selectivity for
hydrophilic peptides
Higher selectivity for
acidic peptides
RP-2
RP-3
RP-5
RP-8
G-1
G-2
HLB
1774
1524
1192
1124
1198
1213
1373
142%
79% ± 10%
72% ± 12%
71% ± 9%
54% ± 9%
unbiased
unbiased
207
137%
74% ± 16%
69% ± 13%
76% ± 7%
62% ± 13%
unbiased
unbiased
116
139%
50% ± 6%
46% ± 4%
45% ± 4%
32% ± 6%
unbiased
unbiased
-
114%
32% ± 7%
28% ± 9%
38% ± 11%
20% ± 10%
unbiased
unbiased
-
144%
71% ± 19%
69% ± 12%
63% ± 20%
48% ± 23%
unbiased
unbiased
-
142%
88% ± 10%
74% ± 9%
73% ± 10%
58% ± 8%
unbiased
unbiased
80
147%
78% ± 12%
64% ± 13%
60% ± 11%
51% ± 12%
unbiased
unbiased
123
HeLa cell line sample
ID
Identification
Recovery (n = 6)
Selectivity
Number of unique
PPs
Ratio of PPs
HLADLpSK
NVPLpYK
VNQIGpTLSESIK
VNQIGTLpSEpSIK
Hydrophobicity
Acidity
Individual unique
PPs
fied unique PPs were significantly higher than it was in the unpurified control sample, and the recoveries of the enolase PPs were
extremely high. However, when analyzing the HeLa cell line sample, only the RP-2 SPE method reached the levels of the control
sample regarding the identification performance and recovery. This
difference is attributed to the different complexity of the samples.
The phosphopeptide-enriched rat smooth muscle sample contained
relatively few components, thus most of the interfering components were removed during purification, and a small number of
co-eluting PPs and peptides were observed. On the other hand, the
phosphopeptide-enriched HeLa cell line digest contained almost
20 0 0 PPs and peptides resulting in a vast number of co-eluting
components in the purified sample, thus influencing the ionization
efficiency and identification.
Sample loss during a sample preparation step is inevitable in
the case of highly complex samples, however, these losses can be
minimized using appropriate methods. Excluding the purification
step after PP enrichment seems reasonable; the highest number of
unique PPs were identified in the unpurified control sample in the
case of the HeLa cell line sample. However, residual reagents after PP enrichment (like hydroxy acids, glycerin, citric acid) cause
poor chromatographic performance, clogging of the emitter, and
ion suppression during the HPLC-MS measurements, therefore, purification is inevitable on the long run.
The results obtained with the selected SPE methods (presented
in section 3.2.) were unbiased regarding the hydrophobicity and
acidity of the PPs, but, a different selectivity for individual PPs was
observed. Hence, splitting the sample, and purifying it with different SPE methods seems to be an option, when an extended profiling of PPs is the main goal. However, this requires a larger amount
of sample and multiplies the analysis time.
The implementation of these SPE methods into a routine phosphoproteomic workflow is straightforward, and in our experience,
it is necessary to perform purification both before and after phosphopeptide enrichment. The exact method should always be tested
and partially optimized for the given sample type and matrix.
The preparation of the presented self-packed SPE spin tips is fast,
and the overall time required for the purification with these self-
Fig. 4. Venn-diagram of the identified individual PPs during the purification of
HeLa cell line sample. For each method, the result of 6 parallel experiments were
combined.
3.3. Summary of the performance of SPE spin tips
The investigated self-packed centrifugal RP-2, RP-3, G-2, and
HLB SPE spin tips were found to be excellent for the purification
of small amounts of complex phosphopeptide mixtures (Table 2).
The identification rate and recovery were the highest in the case of
these methods; 1.1–1.6 times more unique PPs were identified and
33–43% higher recovery was achieved compared to the commercial SPE cartridges (e.g. RP-8). However, we observed small differences in the performance characteristics when working with different sample types. Analyzing the rat sample, the numbers of identi6
F. Bugyi, G. Tóth, K.B. Kovács et al.
Journal of Chromatography A 1685 (2022) 463597
packed SPE spin tips is similar to those of the commercial SPE cartridges.
for providing the rat smooth muscle sample. Lilla Turiák is grateful for the support of the János Bolyai Research Scholarship of the
Hungarian Academy of Sciences.
4. Conclusion
Supplementary materials
In this study, we investigated the purification performance of
13 self-packed centrifugal SPE spin tips as well as 3 commercial
SPE cartridges/spin tips to improve the analysis of PPs. We performed an initial screening using 1 μg rat smooth muscle sample,
and additional experiments on the SPE methods considered suitable for PP purification using 1 μg HeLa cell line sample. RP-2, RP3, G-1, and HLB self-packed centrifugal SPE spin tips were found to
be excellent choices for the efficient purification of low amounts
of PP-enriched biological samples. The sample loss during purification is minimized (3-33% in unique PPs and 30-37% in recovery).
Furthermore, the methods are unbiased regarding the hydrophobic
and acidic characteristics of the sample, however, their different
selectivity towards individual PPs should not be excluded.
Supplementary material associated with this article can be
found, in the online version, at doi:10.1016/j.chroma.2022.463597.
References
[1] T. Hunter, Why nature chose phosphate to modify proteins, Philos Trans R Soc
Lond, B, Biol Sci 367 (2012) 2513–2516, doi:10.1098/rstb.2012.0013.
[2] P. Cohen, The regulation of protein function by multisite phosphorylation
– a 25 year update, Trends Biochem Sci 25 (20 0 0) 596–601, doi:10.1016/
S0968-0 0 04(0 0)01712-6.
[3] J. Mayne, Z. Ning, X. Zhang, A.E. Starr, R. Chen, S. Deeke, C.-K. Chiang, B. Xu,
M. Wen, K. Cheng, et al., Bottom-Up Proteomics (2013–2015): Keeping up in
the Era of Systems Biology, Anal Chem 88 (2016) 95–121, doi:10.1021/acs.
analchem.5b04230.
[4] Y. Zhang, B.R. Fonslow, B. Shan, M.-C. Baek, J.R. Yates, Protein Analysis by
Shotgun/Bottom-up Proteomics, Chem Rev 113 (2013) 2343–2394, doi:10.1021/
cr3003533.
[5] J. Urban, A review on recent trends in the phosphoproteomics workflow. From
sample preparation to data analysis, Anal Chim Acta 1199 (2022) 338857,
doi:10.1016/j.aca.2021.338857.
[6] W. Qiu, C.A. Evans, A. Landels, T.K. Pham, P.C. Wright, Phosphopeptide enrichment for phosphoproteomic analysis - A tutorial and review of novel materials,
Anal Chim Acta 1129 (2020) 158–180, doi:10.1016/j.aca.2020.04.053.
[7] R.M. Tubaon, P.R. Haddad, J.P. Quirino, Sample Clean-up Strategies for ESI
Mass Spectrometry Applications in Bottom-up Proteomics: Trends from 2012
to 2016, Poteomics 17 (2017) 170 0 011, doi:10.10 02/pmic.20170 0 011.
[8] M.R. Bladergroen, Y.E.M. van der Burgt, Solid-Phase Extraction Strategies
to Surmount Body Fluid Sample Complexity in High-Throughput Mass
Spectrometry-Based Proteomics, J Anal Methods Chem 2015 (2015) 250131,
doi:10.1155/2015/250131.
[9] Solid-phase extraction in clinical biochemistry, Ann Clin Biochem 39 (2002)
464–477, doi:10.1258/0 0 0456302320314476.
[10] A.K. Callesen, J.S. Madsen, W. Vach, T.A. Kruse, O. Mogensen, O.N. Jensen,
Serum protein profiling by solid phase extraction and mass spectrometry:
A future diagnostics tool? Proteomics 9 (2009) 1428–1441, doi:10.1002/pmic.
20 080 0382.
[11] N.C. Dias, C.F. Poole, Mechanistic study of the sorption properties of OASIS®
HLB and its use in solid-phase extraction, Chromatographia 56 (2002) 269–
275, doi:10.1007/BF02491931.
[12] A. Holtz, N. Basisty, B. Schilling, Quantification and Identification of PostTranslational Modifications Using Modern Proteomics Approaches, Methods
Mol Biol 2228 (2021) 225–235, doi:10.1007/978- 1- 0716- 1024- 4_16.
[13] N. Jehmlich, C. Golatowski, A. Murr, G. Salazar, V.M. Dhople, E. Hammer,
U. Völker, Comparative evaluation of peptide desalting methods for salivary
proteome analysis, Clin Chim Acta 434 (2014) 16–20, doi:10.1016/j.cca.2014.04.
003.
[14] C. Schmelter, S. Funke, J. Treml, A. Beschnitt, N. Perumal, C. Manicam, N. Pfeiffer, F.H. Grus, Comparison of Two Solid-Phase Extraction (SPE) Methods for
the Identification and Quantification of Porcine Retinal Protein Markers by LCMS/MS, Int J Mol Sci 19 (2018), doi:10.3390/ijms19123847.
[15] M. Palmblad, J.S. Vogel, Quantitation of binding, recovery and desalting efficiency of peptides and proteins in solid phase extraction micropipette tips, J
Chromatogr B 814 (2005) 309–313, doi:10.1016/j.jchromb.2004.10.052.
[16] X. Guo, B.S. Kristal, The use of underloaded C18 solid-phase extraction plates increases reproducibility of analysis of tryptic peptides from
unfractionated human plasma, Anal Biochem 426 (2012) 86–90, doi:10.1016/
j.ab.2012.04.003.
[17] F. Benavente, S. Medina-Casanellas, J. Barbosa, Sanz-Nebot, V. Investigation of
commercial sorbents for the analysis of opioid peptides in human plasma by
on-line SPE-CE, J Sep Sci 33 (2010) 1294–1304, doi:10.10 02/jssc.20 090 0669.
[18] K. Ogata, Y. Ishihama, CoolTip: Low-Temperature Solid-Phase Extraction Microcolumn for Capturing Hydrophilic Peptides and Phosphopeptides, Mol Cell Proteom 20 (2021) 100170, doi:10.1016/j.mcpro.2021.100170.
[19] C. West, C. Elfakir, M. Lafosse, Porous graphitic carbon: A versatile stationary phase for liquid chromatography, J Chromatogr A 1217 (2010) 3201–3216,
doi:10.1016/j.chroma.2009.09.052.
[20] E.T. Chin, D.I. Papac, The Use of a Porous Graphitic Carbon Column for Desalting Hydrophilic Peptides prior to Matrix-Assisted Laser Desorption/Ionization
Time-of-Flight Mass Spectrometry, Anal Biochem 273 (1999) 179–185, doi:10.
1006/abio.1999.4242.
[21] W.R. Alley Jr., M.V. Mechref Y Fau - Novotny, M.V Novotny, Use of activated
graphitized carbon chips for liquid chromatography/mass spectrometric and
tandem mass spectrometric analysis of tryptic glycopeptides, Rapid Commun
Mass Spectrom 23 (2009) 495–505, doi:10.1002/rcm.3899.
[22] J. Liu, J. Wang F Fau - Zhu, J Zhu, J. Fau - Mao, J Mao, Z. Fau - Liu, K. Liu Z
Fau - Cheng, H. Cheng K Fau - Qin, H Qin, H. Fau - Zou, H. Zou, Highly efficient N-glycoproteomic sample preparation by combining C(18) and graphi-
Appendices
Appendix A
Table S1. Purification protocols for the investigated SPE spin
tips/cartridges.
Table S2. Average number and ratio of identified PPs during
the initial screening. For each method, 4 parallel experiments were
performed.
Table S3. Average number and ratio of identified PPs during the
purification of HeLa cell line sample. For each method, 6 parallel
experiments were performed.
Appendix B
Figure S1. Selectivity of the investigated SPE methods during the
purification of HeLa cell line sample. Relative distribution of unique
PPs of a) GRAVY score range, b) pI range. For each method, the
result of 6 parallel experiments were combined.
Declaration of Competing Interest
The authors declare that they have no known competing financial interests or personal relationships that could have appeared to
influence the work reported in this paper.
CRediT authorship contribution statement
Fanni Bugyi: Conceptualization, Methodology, Investigation,
Data curation, Visualization, Writing – original draft. Gábor Tóth:
Conceptualization, Methodology, Investigation, Data curation, Visualization, Writing – original draft. Kinga Bernadett Kovács: Resources, Writing – original draft. László Drahos: Writing – original draft, Funding acquisition, Project administration, Supervision.
Lilla Turiák: Writing – original draft, Funding acquisition, Project
administration, Supervision.
Data availability
Data will be made available on request.
Acknowledgment
Supported by the ÚNKP-21-3 New National Excellence Program
and KDP-21 Program of the Ministry for Innovation and Technology from the source of the National Research, Development and Innovation Fund. Funding from the National Research, Development
and Innovation Office (2018-1.2.1-NKP-2018-0 0 0 05 and FK131603)
is acknowledged. The authors are grateful to András Balla at Department of Physiology, Semmelweis University, Budapest, Hungary
7
F. Bugyi, G. Tóth, K.B. Kovács et al.
[23]
[24]
[25]
[26]
[27]
[28]
Journal of Chromatography A 1685 (2022) 463597
tized carbon adsorbents, Anal Bioanal Chem 406 (2014) 3103–3109, doi:10.
10 07/s0 0216- 014- 7716- 9.
S. Piovesana, C.M. Montone, C. Cavaliere, C. Crescenzi, G. La Barbera, A. Laganà,
A.L. Capriotti, Sensitive untargeted identification of short hydrophilic peptides
by high performance liquid chromatography on porous graphitic carbon coupled to high resolution mass spectrometry, J Chromatogr A 1590 (2019) 73–79,
doi:10.1016/j.chroma.2018.12.066.
M.R. Larsen, M.E. Graham, P.J. Robinson, P. Roepstorff, Improved Detection
of Hydrophilic Phosphopeptides Using Graphite Powder Microcolumns and
Mass Spectrometry: Evidence for in Vivo Doubly Phosphorylated Dynamin
I and Dynamin III, Mol Cell Proteom 3 (2004) 456–465, doi:10.1074/mcp.
M30 0105-MCP20 0.
D.E. McNulty, R.S. Annan, Hydrophilic Interaction Chromatography Reduces the
Complexity of the Phosphoproteome and Improves Global Phosphopeptide Isolation and Detection∗ , Mol Cell Proteom 7 (2008) 971–980, doi:10.1074/mcp.
M70 0543-MCP20 0.
A.J. Alpert, Electrostatic Repulsion Hydrophilic Interaction Chromatography for
Isocratic Separation of Charged Solutes and Selective Isolation of Phosphopeptides, Anal Chem 80 (2008) 62–76, doi:10.1021/ac070997p.
A.J. Alpert, O. Hudecz, K. Mechtler, Anion-Exchange Chromatography of Phosphopeptides: Weak Anion Exchange versus Strong Anion Exchange and AnionExchange Chromatography versus Electrostatic Repulsion–Hydrophilic Interaction Chromatography, Anal Chem 87 (2015) 4704–4711, doi:10.1021/ac504420c.
AJ. Alpert, Hydrophilic-interaction chromatography for the separation of peptides, nucleic acids and other polar compounds, J Chromatogr 19 (1990) 177–
196 499, doi:10.1016/s0 021-9673(0 0)96972-3.
[29] J.B. Gém, K.B. Kovács, L. Szalai, G. Szakadáti, E. Porkoláb, B. Szalai, G. Turu,
A.D. Tóth, M. Szekeres, L. Hunyady, A. Balla, Characterization of Type 1 Angiotensin II Receptor Activation Induced Dual-Specificity MAPK Phosphatase
Gene Expression Changes in Rat Vascular Smooth Muscle Cells, Cells 10 (2021)
3538, doi:10.3390/cells10123538.
´ K. Vékey, L. Turiák, L. Drahos, Selective
[30] G. Tóth, F. Bugyi, S. Sugár, G. Mitulovic,
TiO2 Phosphopeptide Enrichment of Complex Samples in the Nanogram Range,
Separations 7 (2020), doi:10.3390/separations7040074.
[31] Á. Révész, T.A. Rokob, D. Jeanne Dit Fouque, L. Turiák, A. Memboeuf, K. Vékey,
L. Drahos, Selection of Collision Energies in Proteomics Mass Spectrometry Experiments for Best Peptide Identification: Study of Mascot Score Energy Dependence Reveals Double Optimum, J Proteome Res 17 (2018) 1898–1906.
[32] L.P. Kozlowski, IPC – Isoelectric Point Calculator, Biol Direct 11 (2016) 55,
doi:10.1186/s13062- 016- 0159- 9.
[33] J. Kyte, R.F. Doolittle, A simple method for displaying the hydropathic character of a protein, J Mol Biol 157 (1982) 105–132, doi:10.1016/0022-2836(82)
90515-0.
[34] Peer, Y.V.D. VIB-BEG Venn-Diagram Maker. Available online: http:
//bioinformatics.psb.ugent.be/webtools/Venn/ (accessed on 16 May 2022).
[35] G. Tóth, S. Sugár, M. Balbisi, B.A. Molnár, F. Bugyi, K.D. Fügedi, L. Drahos,
L. Turiák, Optimized Sample Preparation and Microscale Separation Methods for High-Sensitivity Analysis of Hydrophilic Peptides, Molecules 27 (2022)
6645, doi:10.3390/molecules27196645.
[36] University of Washington Proteomics Resource, Peptide fractionation
and Clean-Up Protocols, />protocols04/UWPR_Protocols_Peptide_Fractionation_and_Cleanup.pdf
(Last
updated 10/4/2011)
8