Determination of eight phosphatidylethanol homologues in blood by reversed phase liquid chromatography–tandem mass spectrometry – How to avoid co-elution of phosphatidylethanols
Bạn đang xem bản rút gọn của tài liệu. Xem và tải ngay bản đầy đủ của tài liệu tại đây (4.24 MB, 9 trang )
Journal of Chromatography A 1684 (2022) 463566
Contents lists available at ScienceDirect
Journal of Chromatography A
journal homepage: www.elsevier.com/locate/chroma
Determination of eight phosphatidylethanol homologues in blood by
reversed phase liquid chromatography–tandem mass spectrometry –
How to avoid co-elution of phosphatidylethanols and unwanted
phospholipids
Marisa Henriques Maria a , Benedicte Marie Jørgenrud b , Thomas Berg b,∗
a
Faculty of Sciences of the University of Lisbon, Campo Grande, Lisboa 1749-016, Portugal
Department of Forensic Sciences, Division of Laboratory Medicine, Section of Drug Abuse Research, Oslo University Hospital, P.O. Box 4950 Nydalen,
N-0424, Lovisenberggt. 6 Oslo 0456, Norway
b
a r t i c l e
i n f o
Article history:
Received 26 August 2022
Revised 11 October 2022
Accepted 12 October 2022
Available online 14 October 2022
Keywords:
Phosphatidylethanol
PEth 16:0/18:1
Reversed phase LC-MS/MS
Alcohol
Blood
a b s t r a c t
Phosphatidylethanols (PEths) are specific, direct alcohol biomarkers with a substantially longer half-life
than ethanol, and can be used to distinguish between heavy- and social drinking. More than forty PEth
homologues have been detected in blood from heavy drinkers, and PEth 16:0/18:1 is the predominant
one. Since PEths are phospholipids it can be difficult to isolate them from unwanted phospholipids during
sample preparation. To minimize possible matrix effects it is therefore important to separate PEths from
other phospholipids during LC-MS/MS analysis. In this study, we have investigated how the retention and
chromatographic separation of eight PEth homologues and the phospholipid background are influenced
by changes in mobile phase composition using two different LC columns, the Acquity BEH C18 column
(50 × 2.1 mm ID, 1.7 μm particles) and the Kinetex biphenyl column (100 × 2.1 mm ID, 1.7 μm particles).
Our findings show that the buffer concentration of the aqueous part of the mobile phase had a huge
effect on the retention of PEth homologues and separation of PEths from unwanted phospholipids. By
using a buffer-free mobile phase consisting of 0.025% ammonia in Type 1 water, pH 10.7, as solvent A
and methanol as solvent B, all eight PEth homologues were separated from both the early eluting lysophospholipids and the later eluting phospholipids with two fatty chains using the BEH C18 column. The
knowledge obtained in this study can be of great importance for those seeking to develop reliable and
robust bioanalytical LC-MS/MS methods for determination of PEth homologues.
© 2022 The Author(s). Published by Elsevier B.V.
This is an open access article under the CC BY license ( />
1. Introduction
Alcohol is a legal psychoactive substance consumed worldwide
during cultural, religious and social practices, and provides perceived satisfaction to many users. However, alcohol use is toxic
for the human body and associated with an increased risk of various negative health effects, injuries and mortality [1–5]. Alcohol
use is also associated with huge economic and social costs individuals and for the society [6–8]. Recently, a growing interest in
phosphatidylethanols (PEths) as biomarkers for alcohol consumption has emerged. PEths are a group of direct alcohol biomarkers with a substantially longer half-life than ethanol, and they are
formed in various tissues exclusively in the presence of alcohol [9–
∗
Corresponding author.
E-mail address: (T. Berg).
12]. When consuming alcohol, the majority of the dose (≈ 92–95%)
is oxidized to acetaldehyde and further to acetate, while about 5%
is excreted unchanged in urine, sweat and breath, and a tiny part is
metabolized to PEths and other non-oxidative metabolites [10,13].
Still, there is a significant correlation between concentration of
PEth in blood and alcohol intake [14,15]. PEth concentrations in
blood can be used to detect alcohol use up to three-four weeks
after abstinence and to distinguish between different drinking patterns, such as heavy and social drinking [15,16] The most abundant
and frequently analyzed PEth homologue is PEth 16:0/18:1 [17,18].
Other PEth homologues frequently found in human blood are PEth
16:0/18:2, PEth 18:0/18:2 and PEth 18:0/18:1. The proportion of
PEth homologues appear to differ according to the drinking habits
and the time passed after the last alcohol intake. Since blood elimination half-life of the various PEths is different, it can be important to include more PEth homologues in cases where one seeks
to discriminate between different drinking patterns and between
/>0021-9673/© 2022 The Author(s). Published by Elsevier B.V. This is an open access article under the CC BY license ( />
M.H. Maria, B.M. Jørgenrud and T. Berg
Journal of Chromatography A 1684 (2022) 463566
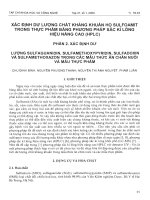
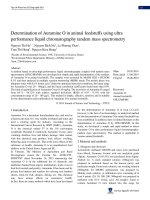
Fig. 1. Simplified molecular structure of most common phospholipids; the phospholipids with glycerol backbone (glycerophopholipids) and those with a sphingoid backbone
(sphingomyelin phospholipids). Figure was created based on information from Xia and Jemal and Lordan et al. (32, 37). a Lyso-phospholipids have only one tail. A hydrogene
(H) has then replaced one chain in either 1-sn or 2-sn position, most commonly H has replaced C=O-R in the 2-sn position. However, most phospholipids got two tails.
b
1-sn position for glycerophospholipids may also be CH2 -O-CH2 -CH2 -R1 (alkyl ether) or CH2 -O-CH=CH-R1 (vinyl ether). c The oxygen in the red ring can be considered as
part of the head group. For instance, in phosphatidylethanol the “ethanol” can be considered to include the oxygene attached to the phosphorus, since R3 = ethyl (see also
Fig. 2).
recent consumption and older consumption of alcohol [19,20]. So
far, nearly 50 different PEth homologues have been found in blood
from heavy drinkers [21].
For targeted qualitative and quantitative bioanalysis of small
molecules in various biological matrices, LC-MS/MS has been one
of the most valuable analytical techniques used for many years
[22–26]. There are many reversed phase (RP) LC-MS/MS methods developed for determination of one or more PEth homologues
in blood [23,27–30]. However, when analyzing PEths, which is a
group of abnormal glycerolphospholipids, other unwanted phospholipids not removed during sample preparation may generate
different challenges, such as changing column performance, increasing column backpressure, and generate matrix effects [31–35].
Phospholipids are a class of lipids and they are essential components in biological membranes, tissue and fluids in both plant
and animal cells [33,36]. They are amphiphilic compounds with
both hydrophilic and lipophilic properties. Their molecular structure contains a polar “head” connected to two (sometimes only
one) non-polar chains of various lengths and various degree of saturation (Fig. 1).
Hundreds of different phospholipids are described in the literature. In general (see Fig. 1) for the polar head; pKa ≈ 0–2 for
the phosphate group (acidic), pKa ≈ 9–11 for the amine group (basic functional head group for cholines, ethanolamines and serines)
and pKa ≈ 3–5 for the carboxyl group (e.g. glycerophospholipids
where R1 or R2 = H), with some changes due to hydrogen bonding [37]. As seen from Fig. 1 there are many sub-classes of phospholipids. Two subgroups can be distinguished by their backbones,
the sphingoid base backbone and the glycerol backbone phospholipids. Other subgroups can be categorized based on the number of fatty chains (“di” or “mono”). Lyso-phospholipids are those
with only one non-polar tail, either at the sn-1 position (1-lysophospholipids) or at the sn-2 position (2-lyso-phospholipids). Subgroups can also be categorized based on the R3 group attached to
the phosphate-moiety, and the most common phospholipids, accounting for 60–70 % of the total plasma phospholipid, is phosphatidylcholines (PCs) [31].
In bioanalytical LC-MS/MS methods it is easy to remove unwanted phospholipids during sample preparation, for instance by
using liquid-liquid extraction (LLE) or supported liquid extraction
(SLE) with an organic solvent(s), such as tert butyl methyl ether
(MTBE) or mixtures of heptane/ethylacetate, ([31,4,38]. However,
the PEths will be removed at the same time [38,39]. By addition of
an alcohol (e.g.: 2-propanol) to the organic solvent used during LLE
or SLE, PEth recovery can be increased, but other unwanted phospholipids will also be extracted and introduced into the LC-MS/MS
[29,38,39].
PEths and other phospholipids have similar molecular structures and physico-chemical properties. Consequently, they will often co-elute during LC-MS/MS analysis. It can therefore be of great
importance to know and understand how to minimize co-elution
between PEths and other phospholipids during LC-MS/MS analysis, which to our knowledge is not previously described in other
published LC-MS/MS methods. In this study, we investigated the
chromatographic separation of as much as eight PEth homologues
and the phospholipid background using different mobile phase
compositions on two different ultra-high performance LC (UHPLC)
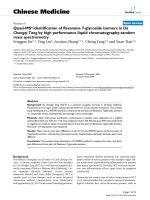
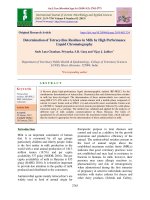
columns. Fig. 2 shows the molecular structure of the eight PEth
homologues investigated in this study. All eight PEth homologues
are among the most commonly occurring in human blood.
2. Materials and methods
2.1. Chemicals and materials
Methanol (MeOH) of LC-MS grade was purchased from Honeywell (Seelze, Germany). Acetonitrile (ACN) of HPLC Far UV grade
was purchased from JT. Baker (Deventer, The Netherlands). Ethyl
2
M.H. Maria, B.M. Jørgenrud and T. Berg
Journal of Chromatography A 1684 (2022) 463566
Fig. 2. Molecular structures of the eight PEth homologues that were included in this study.
acetate, n-heptane 2-propanol, and nitric acid (p.a,) were obtained
from Merck (Darmstadt, Germany). Formic acid (98%) was acquired
from VWR International AS (Oslo, Norway). Aqueous ammonia (>
25%), ammonium formate, and ammonium carbonate were obtained from VWR Chemicals, Prolabo (Leuven, Belgium). Type 1
water (18.2 M ) purified with a Synthesis A 10 milli-Q system
from Millipore (Billerica, MA, USA) was used.
MeOH, vortexed and then placed in the sample organizer for LC–
MS/MS analysis. Injection volume was 1 μL.
2.5. Instrumental analysis
LC-MS/MS analyses were performed on an Acquity UPLC I-class
system with flow through needle (FTN), comprised of a binary solvent manager, sample manager with sample organizer, and a column oven, coupled to a Xevo TQ-S MS/MS, all from Waters (Milford, MA, USA). Chromatographic separations were performed on a
Acquity BEH C18 column (50 × 2.1 mm ID, 1.7 μm particles) from
Waters (Milford, MA, USA) and a Kinetex biphenyl core shell column (100 × 2.1 mm ID, 1.7 μm particles) from Phenomenex (Torrance, CA, USA) at a column temperature of 60 °C. Mobile phase
flow rate was 0.6 mL/min for all tests on the Acquity BEH C18 column whereas it was 0.5 mL/min for the tests performed on the
Kinetex biphenyl column. Injection volume was 1 μL in all tests.
Electrospray ionization (ESI)-MS/MS detection was performed in
negative ESI (ESI− ) with multiple reaction monitoring (MRM) using
argon as collision gas. MS/MS settings were as follows; capillary
voltage 2.6 kV, source temperature 150 °C, desolvation gas temperature 500 °C, cone gas flow 300 L/h and desolvation gas flow
10 0 0 L/hr. Acquisition and processing of data were performed using MasslynxTM software (version 4.1, Waters, Milford, MA, USA).
Table 1 shows the MRM transitions, cone voltages, collision energies and dwell times used for LC-MS/MS analysis of the eight PEth
homologues. For determination of PEth homologue retention times,
LC-MS/MS analyses were performed in MRM mode by injection of
pure working solutions. In contrast, determination of general phospholipid background was performed by parent ion scan of m/z 184
of extracted blood samples prepared by 96-SLE (see Section 2.4),
using positive ESI, cone voltage 50 V, capillary voltage 1.25 kV, MS
and MS/MS mode collision energy of 2 and 40, respectively.
2.2. Blank blood
PEth-free whole blood from employees at the Department of
Forensic Sciences at Oslo University Hospital was collected in 4 mL
Vacuette® K2E K2EDTA tubes from Greiner bio-one (Kremsmünster, Austria).
2.3. Preparation of working solution and standard samples with eight
PEth homologues
PEth 16:0/16:0 was purchased from Avanti Polar, while PEth
16:0/18:1, PEth 16:0/18:2, PEth 16:0/20:4, PEth 17:0/18:1, PEth
18:0/18:1, PEth 18:0/18:2, PEth 18:1/18:1 were purchased from
Echelon Biosciences (Salt Lake City, USA). The stock solutions of
the PEths homologues were prepared in MeOH. Working solutions
were prepared in MeOH by appropriate dilution of the stock solutions. LC-MS/MS analyses of the eight PEth homologues were performed by injection of pure working solutions into the LC-MS/MS
instrument. LC-MS/MS analyses of the phospholipid background
were performed by parent ion m/z 184 scan of extracted blank
blood samples prepared by 96-well SLE (see Section 2.4 for extraction procedure).
2.4. Sample preparation by 96-well SLE that were used for extraction
of blood samples
3. Results and discussion
For investigation of the retention of phospholipid background,
extracted blank whole blood samples analyzed were prepared
by 96-well SLE using [heptane/ethylacetate (1:5, v:v)]/2-propanol
(100:20) as organic solvent, as described in a previous paper [39],
except the addition of Triton-X 100. After 96-well SLE the eluates collected in 96-collection plates were evaporated to dryness
and the residues were reconstituted in 100 μL 2-propanol/ACN or
To minimize possible matrix effects, it is important to understand how PEths can be chromatographically resolved from unwanted phospholipids during LC-MS/MS analysis. In this case, different mobile phase compositions and gradient profiles were investigated on two different UHPLC columns, and some interesting results were found. Each chromatogram shows overlaid chro3
M.H. Maria, B.M. Jørgenrud and T. Berg
Journal of Chromatography A 1684 (2022) 463566
Table 1
MRM transitions, cone voltages, collision energies and dwell times.
MRM transitions
Analyte
PEth 16:0/16:0
PEth 16:0/18:1
PEth 16:0/18:2
PEth 16:0/20:4
PEth 17:0/18:1
PEth 18:0/18:1
PEth 18:0/18:2
PEth 18:1/18:1
675.5
675.5
701.5
701.5
699.5
699.5
723.5
723.5
715.5
715.5
729.5
729.5
727.5
727.5
727.5
727.5
>
>
>
>
>
>
>
>
>
>
>
>
>
>
>
>
255.2
437.3
255.2
281.2
255.2
279.2
303.2
437.3
269.2
281.2
281.2
283.2
279.2
283.2
281.2
463.3
MS/MS parametersa
Cone voltage (V)
Collision energy (eV)
Dwell time (ms)
45
45
60
60
55
55
50
50
60
60
65
65
50
50
60
60
30
30
40
30
40
30
25
25
35
35
40
40
40
40
40
30
10
10
20
20
20
20
20
20
20
20
20
20
20
20
20
20
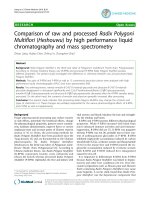
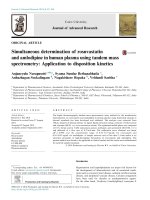
Fig. 3. Chromatographic separation of eight PEths and phospholipid background by LC-MS/MS analysis using an acidic mobile phase (pH 5, left hand side) and a basic mobile
phase (pH 10, right hand side). Concentration of ammonium formate in the aqueous part of the mobile phase were 20 mM (a), 5 mM (b) and 2 mM (c). 2 mM and 5 mM
ammonium formate buffers were prepared by dilution of 20 mM buffer using Type 1 water. Gradient profile: 60% B in 0.0–0.2 min, 60–88% B in 0.2–0.3 min, 88–98% B in
0.3–3.8 min, 98–100% B in 3.8–3.9 min, 100% B in 3.9–6.4 min, 100–60%B in 6.4–6.5 min, 60% B in 6.5–7.0 min. Retention time order for PEth homologues were; 1: PEth
16:0/20:4, 2: PEth 16:0/18:2, 3: PEth 16:0/16:0, 4: PEth 16:0/18:1, 5: PEth 18:1/18:1, 6: PEth 18:0/18:2, 7: PEth 17:0/18:1, 8: PEth 18:0/18:1.
matograms from two subsequently LC-MS/MS analyses; one by injecting working solutions with the eight PEth homologues (MRM
mode) and injection of extracted blood sample for determination
of the phospholipid background (parent ion m/z 184 scan, red
broad peaks). By doing this it was possible to do several injections
of the PEth homologues without injecting the dirtier extracted
blood samples into the system, the latter may change column performance and give retention times variation over time.
3.1. Influence of mobile phase pH and mobile phase buffer
concentration on an Acquity BEH C18 column
When optimizing RP LC separation, mobile phase pH, gradient
profile, choice of organic modifier and choice of column, are important factors. For ionizable compounds (acids, bases) a mobile phase
pH that increases ionization will reduce retention, and vice versa.
These effects are especially observed at pH values near the pKa
4
M.H. Maria, B.M. Jørgenrud and T. Berg
Journal of Chromatography A 1684 (2022) 463566
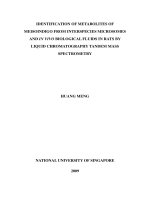
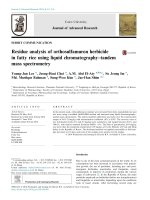
Fig. 4. Chromatographic separation between eight PEth homologues and phospholipid background obtained by LC-MS/MS analysis on three different Acquity BEH C18
columns (50 × 2.1 mm ID, 1.7 μm particles) using an acidic mobile phase consisting of ammonium formate buffer (pH 5) as solvent A and MeOH as solvent B. On all
three columns, mobile phase buffer concentration of 2, 5 and 20 mM was tested, as depicted in figure. None of the three columns were complete new before the tests.
Gradient profile and retention time order for PEths were the same as described for Fig. 3.
Fig. 5. Chromatographic separation between eight PEth homologues and phospholipid background obtained by LC-MS/MS analysis on a BEH C18 column using basic mobile
phases with different buffer concentrations; 20 mM (a), 5 mM (b), 2 mM (c) and 0 mM (d). LC-MS/MS analysis were performed using a mobile phase Solvent A solution of
ammonium formate buffers, pH 10, in Fig. 5a–c, whereas 0.025% ammonia in Type 1 water, pH 10.7, was used in Fig. 5d. Gradient profile and retention time order were the
same as described for Fig. 3.
5
M.H. Maria, B.M. Jørgenrud and T. Berg
Journal of Chromatography A 1684 (2022) 463566
Fig. 6. Chromatographic separation between eight PEth homologues and phospholipid background obtained by LC-MS/MS analysis on a BEH C18 column using basic mobile
phases consisting of 0.025% ammonia (solvent A, pH 10.7) and MeOH (solvent B). Retention times for PEth homologues and phospholipid background shown for LC-MS/MS
analysis before analysis of extracted samples (a), after injection of 50 extracted blood samples (b), after injection of 100 extracted blood samples (c), and after injection of
150 extracted blood samples (d). Gradient profile and retention time order were the same as described inin Fig. 3 caption
value of the compound [40–44]. Since the PEth homologues in this
study have an acidic functional group with pKa value ≈ 1-2, the
retention times of the PEths were not expected to be influenced
much by changes in the mobile phase pH at pH values above 3-4.
Concerning the mobile phase buffer concentration, changing ionic
strength can be a significant parameter for controlling retention of
ionized compounds and for neutral compounds by generating salting out effect (increased retention at higher salt concentrations).
Fig. 3 shows the retention times of the PEths homologues and
phospholipid background obtained by an LC-MS/MS analyses on a
BEH C18 column using an acidic (pH 5) and a basic (pH 10) mobile
phase, both tested with three different buffer concentrations.
The retention times of the PEths homologues and phospholipid background were similar when using both mobile phase pH
5 and pH 10. However, reducing the buffer concentration clearly
reduced the retention of all eight PEth homologues and improved
separation between the PEth homologues and the phospholipid
background (broad red peaks), probably due to salting out effect at higher buffer concentrations. Interestingly, retention of the
unwanted phospholipids seemed almost unaffected by both the
change in both mobile phase pH and by the change in the mobile
phase buffer concentration. The results presented in Fig. 3 shows
good separation between the PEths and the unwanted phospholipids using the 2 mM buffer as solvent A. However, further investigations revealed that retention times of the PEth homologues and
also the separation between PEth and the unwanted phospholipids
were not stable over time, even though column type (Acquity BEH
C18 (50 × 2.1 mm ID, 1.7 μm particles)), gradient profile, column
temperature, mobile phase composition and flow were the same
(Fig. 4).
Based on the results observed in Figs. 3 and 4, it is clear, despite the variation of the retention times, that reducing the buffer
concentration in the aqueous part of the mobile phase resulted in
reduced retention times for the PEths. This issue was further investigated using high pH mobile phases by testing a basic mobile
phase without any buffer (Fig. 5).
Fig. 5 clearly illustrates reduced retention of the eight PEths
when using 0.025 % ammonia in Type 1 water, pH 10.7, compared to using mobile phases with ammonium formate buffer,
pH 10, at various concentrations. The retention of the unwanted
phospholipids seemed almost unaffected by the changes in Solvent A composition. This high pH mobile phase consisting of
0.025% ammonia in Type 1 water as solvent A and MeOH as
solvent B seemed to be the best choice for separation of all
eight PEth homologues from the late eluting phospholipids. Therefore, this mobile phase was used in a subsequent experiment
for investigation of how retention times of PEth homologues varied after analyses of 50, 100, and 150 extracted blood samples
(Fig. 6).
Fig. 6 shows a reduction in the retention times over time for
all PEth homologues after analyzing several extracted blood samples, while retention of the unwanted phospholipids remained the
same. A reason for the changes in the PEths retention times might
be due to background components from the extracted blood samples bonding to and changing the column stationary phase surface.
The challenge with drifting retention times was only tested using
the basic buffer free mobile phase. However, this issue is something worth investigated further in future studies in order to investigate how retention times can be kept as stable as possible over
time. Almost all LC-MS/MS analyses of the eight PEths in this study
6
M.H. Maria, B.M. Jørgenrud and T. Berg
Journal of Chromatography A 1684 (2022) 463566
Fig. 7. Chromatographic separation between eight PEth homologues and phospholipid background obtained by LC-MS/MS analysis on a BEH C18 column using basic mobile
phases consisting of 0.025% ammonia in Type 1 water (pH 10.7) and MeOH. LC-MS/MS analyses were performed using two similar gradients, “Gradient 84–98” (a) and
“Gradient 88–98 (b). Graphic illustration of the both gradient profiles used are included in figure (c). Gradient profiles: 60% B in 0.0–0.2 min, 60–84 (or 88)% B in 0.2–
0.3 min, 84 (or 88) – 98% B in 0.3–3.8 min, 98–100% B in 3.8–3.9 min, 100% B in 3.9–6.4 min, 100–60%B in 6.4–6.5 min, 60% B in 6.5–7.0 min. Retention order for PEth
homologues were the same as described in Fig. 3 caption.
were based on injection of pure working solutions only. However,
a few LC-MS/MS analyses of extracted blood sample mixed (1:1,
v:v) with working solution containing the eight PEths, were performed (data not shown). Generally, improved signal/noise values
and higher peak responses were observed using the buffer free
mobile phase. However, the influence of mobile phase composition on signal/noise and peak responses for PEth homologues in
extracted blood samples should be investigating more thoroughly
in future studies.
In Fig. 7, chromatograms for the eight PEth homologues, the
lyso-phospholipids and the other later eluting phospholipids using
two different mobile phase gradients, is depicted.
The best separation of PEth homologues and the phospholipids
was obtained by using the “84-98 gradient profile” (Fig. 7b). Gradient profiles used in these tests started at 60% MeOH which for
many compounds would lead to early elution and poor separation.
However, as mentioned by Meng et al., for RP LC analysis, phospholipids will normally be retained (“focused”) on the column in
RP LC-MS/MS methods as long as the mobile phase contains ≤ 60
% MeOH [23].
2–12. However, a few tests were also performed on a Kinetex
biphenyl column, which is stable and recommended for use with
mobile phases with a pH between 1.5 and 8.5. Fig. 8 shows retention of the PEth homologues and the phospholipid background
obtained at two mobile phase pH values, both tested with three
different buffer concentrations.
Fig. 8 shows similar results as obtained for the BEH C18
columns, the buffer concentration of the aqueous part of the mobile phase had a great effect on the retention of the PEth homologues and the separation between the PEth homologues and the
phospholipid background. Meanwhile, the change in mobile phase
buffer concentration had minimal effects on the retention of the
phospholipid background. Retention time changes were also investigated further comparing ammonium formate buffer to ammonium acetate buffer, but no or only minor changes were observed. As can also be seen in Fig. 8, the mobile phase with
pH 3.1 lead to slightly increased retention times of the PEths.
This is most probably due to the increase in lipophilicity as
a consequence of reduced ionization at lower pH values (pKa
value for the PEth homologues ≈ 1.5–2). When comparing the
retention order obtained on the BEH C18 columns versus the
Kinetec biphenyl column, PEth homologues with double bonds
generally had increased retention compared to the other PEth
homologues on the Kinetex biphenyl column. This was also as
expected, since the biphenyl stationary phase has more affinity towards compounds with double bonds due to dipole-dipole
interactions.
3.2. Influence of mobile phase pH and mobile phase buffer
concentration on a Kinetex biphenyl column
All previous tests shown in Figs. 3–7 were performed on Acquity BEH C18 columns, which are pH stable within pH values
7
M.H. Maria, B.M. Jørgenrud and T. Berg
Journal of Chromatography A 1684 (2022) 463566
Fig. 8. Chromatographic separation of eight PEth homologues and phospholipid background on a Kinetex Biphenyl column (100 × 2.1 mm ID, 1.7 μm particles), using acidic
mobile phases with a buffer concentration of 20 mM (a), 5 mM (b) and 2 mM (c). Mobile phase composition and pH of solvent A as described in the figure. Phospholipid
background was obtained by parent ion m/z 184 scan. Gradient profile: 10% B in 0.0–0.2 min, 10–84% B in 0.2–0.3 min, 84–96% B in 0.3–4.0 min, 96–100% B in 4.0–4.1 min,
100% B in 4.1–7.5 min, 100–10%B in 7.5–7.6 min, 10% B in 7.6–8.2 min. Mobile phase flow rate was 0.5 mL/min.. PEth homologues retention order (shortest retention time
first): 1: PEth 16:0/16:0, 2: PEth 16:0/18:2, 3: PEth 16:0/20:4, 4: PEth 16:0/18:1, 5: PEth 17:0/18:1, 6: PEth 18:0/18:2, 7: PEth 18:1/18:1, 8: PEth 18:0/18:1.
4. Conclusions
in biological samples. The effects of these parameters on different
LC-MS/MS systems should be further investigated.
Since PEths are phospholipids and difficult to isolate from unwanted phospholipids during sample preparation, it is important
to know how to separate them chromatographically to minimize
the possibility of matrix effects. In this study, retention and separation of eight PEth homologues and the phospholipid background
were investigated by LC-MS/MS analysis using two different UHPLC
columns and mobile phases with different pH values and different
mobile phase buffer concentrations. Our findings show that the retention of the PEth homologues were basically unaltered using mobile phase pH 5–10. This finding was as expected since PEths with
their acidic pKa value at approximately 1.5–2.0 are completely ionized above pH 5. However, the buffer concentration of the aqueous part of the mobile phase had a huge effect on the retention of
PEth homologues, while the unwanted phospholipids seemed almost unaffected. In conclusion it was found that LC-MS/MS analysis on the Acquity BEH C18 column (50 × 2.1 mm ID, 1.7 μm particles) using a buffer free mobile phase consisting of 0.025% ammonia in Type 1 water (pH 10.7) as solvent A and MeOH as solvent B,
separated all eight PEth homologues from the phospholipids, both
the early eluting lyso-phospholipids and the later eluting phospholipids. All PEth homologue peaks were narrow and symmetrical. Optimization of the gradient profile was also important in order to separate the eight PEths from the phospholipids. This study
demonstrates the effect various mobile phase buffer concentrations
and gradient profile have on the retention and separation of PEth
homologues and phospholipid background, which can be of great
importance for those working with RP LC-MS/MS analysis of PEths
Declaration of Competing Interest
The authors declare that they have no known competing financial interests or personal relationships that could have appeared to
influence the work reported in this paper.
CRediT authorship contribution statement
Marisa Henriques Maria: Data curation, Investigation, Writing
– review & editing. Benedicte Marie Jørgenrud: Writing – review
& editing. Thomas Berg: Conceptualization, Data curation, Investigation, Writing – original draft, Writing – review & editing.
Data availability
Data will be made available on request.
Acknowledgments
The authors like to thank Galina Nilsson for assistance and
valuable help in the laboratory and Lena Kristoffersen, Dag Helge
Strand and Kristin Gaare for fruitful discussion regarding LCMS/MS bioanalysis of PEth homologues in blood. The authors also
like to thank Tao Angell-Petersen McQuade for valuable comments
and critical reading of the manuscript.
8
M.H. Maria, B.M. Jørgenrud and T. Berg
Journal of Chromatography A 1684 (2022) 463566
References
[24] L. Novakova, Challenges in the development of bioanalytical liquid
chromatography-mass spectrometry method with emphasis on fast analysis, J. Chromatogr. A 1292 (2013) 25–37 S0021-9673(12)01338-6 [pii],
doi:10.1016/j.chroma.2012.08.087.
[25] F.T. Peters, Recent advances of liquid chromatography-(tandem) mass spectrometry in clinical and forensic toxicology, Clin. Biochem. 44 (1) (2011) 54–65,
doi:10.1016/j.clinbiochem.2010.08.008.
[26] D. Remane, D.K. Wissenbach, F.T. Peters, Recent advances of liquid
chromatography-(tandem) mass spectrometry in clinical and forensic toxicology - an update, Clin. Biochem. 49 (13) (2016) 1051–1071 -14, doi:10.1016/j.
clinbiochem.2016.07.010.
[27] T.N. Andreassen, H. Havnen, O. Spigset, B.M Hasle Falch, R.B. Skråstad, High
throughput UPLC(R)-MSMS method for the analysis of phosphatidylethanol
(PEth) 16:0/18:1, a specific biomarker for alcohol consumption, in whole blood,
J. Anal. Toxicol. 42 (1) (2018) 33–41, doi:10.1093/jat/bkx075.
[28] L.D. Muller, S. Foreid, A comparison of an optimized automated sample preparation of PEth in blood pretreated by freezing versus manual preparation in
whole blood, analyzing by UHPLC - MS/MS, J. Pharm. Biomed. Anal. 212 (2022)
114635, doi:10.1016/j.jpba.2022.114635.
[29] D. Oppolzer, M. Barroso, E. Gallardo, Bioanalytical procedures and developments in the determination of alcohol biomarkers in biological specimens, Bioanalysis 8 (3) (2016) 229–251, doi:10.4155/bio.15.240.
[30] A. Isaksson, L. Walther, T. Hansson, A. Andersson, J. Stenton, A. Blomgren,
High-throughput LC-MS/MS method for determination of the alcohol use
biomarker phosphatidylethanol in clinical samples by use of a simple automated extraction procedure-preanalytical and analytical conditions, J. Appl.
Lab. Med. 2 (6) (2018) 880–892, doi:10.1373/jalm.2017.024828.
[31] M. Jemal, Z. Ouyang, Y.Q. Xia, Systematic LC-MS/MS bioanalytical method development that incorporates plasma phospholipids risk avoidance, usage of incurred sample and well thought-out chromatography, Biomed. Chromatogr. 24
(1) (2010) 2–19, doi:10.1002/bmc.1373.
[32] Y.Q. Xia, M. Jemal, Phospholipids in liquid chromatography/mass spectrometry
bioanalysis: comparison of three tandem mass spectrometric techniques for
monitoring plasma phospholipids, the effect of mobile phase composition on
phospholipids elution and the association of phospholipids with matrix effects,
Rapid Commun. Mass Spectrom. 23 (14) (2009) 2125–2138, doi:10.1002/rcm.
4121.
[33] O.A. Ismaiel, T. Zhang, R.G. Jenkins, H.T. Karnes, Investigation of endogenous blood plasma phospholipids, cholesterol and glycerides that contribute
to matrix effects in bioanalysis by liquid chromatography/mass spectrometry,
J. Chromatogr. B Anal. Technol. Biomed. Life Sci. 878 (31) (2010) 3303–3316,
doi:10.1016/j.jchromb.2010.10.012.
[34] H. Jiang, H. Cao, Y. Zhang, D.M. Fast, Systematic evaluation of supported liquid extraction in reducing matrix effect and improving extraction efficiency in
LC-MS/MS based bioanalysis for 10 model pharmaceutical compounds, J. Chromatogr. B Anal. Technol. Biomed. Life Sci. 891-892 (2012) 71–80, doi:10.1016/j.
jchromb.2012.02.031.
[35] L. Novakova, H. Vlckova, A review of current trends and advances in modern
bio-analytical methods: chromatography and sample preparation, Anal. Chim.
Acta 656 (1) (2009) 8–35 -2S0003-2670(09)01355-5 [pii], doi:10.1016/j.aca.
20 09.10.0 04.
[36] J.L. Little, M.F. Wempe, C.M. Buchanan, Liquid chromatography-mass spectrometry/mass spectrometry method development for drug metabolism studies: examining lipid matrix ionization effects in plasma, J. Chromatogr. B Anal. Technol. Biomed. Life Sci. 833 (2) (2006) 219–230, doi:10.1016/j.jchromb.2006.02.
011.
[37] R. Lordan, A. Tsoupras, I. Zabetakis, Phospholipids of animal and marine origin:
structure, function, and anti-inflammatory properties, Molecules (11) (2017)
22, doi:10.3390/molecules22111964.
[38] T. Berg, E. Eliassen, B. Jørgenrud, S. Kabashi, A. Petukhov, S.T. Bogstrand, Determination of phosphatidylethanol 16:0/18:1 in whole blood by 96-well supported liquid extraction and UHPLC-MS/MS, J. Clin. Lab. Anal. 33 (1) (2019)
e22631, doi:10.1002/jcla.22631.
[39] B. Jorgenrud, E. Skadeberg, J. de Carvalho Ponce, H. Furuhaugen, T. Berg, Determination of the alcohol biomarker phosphatidylethanol 16:0/18:1 and 33 compounds from eight different drug classes in whole blood by LC-MS/MS, J. Pharmacol. Toxicol. Methods 107 (2021) 106939, doi:10.1016/j.vascn.2020.106939.
[40] T. Berg, E. Lundanes, A.S. Christophersen, D.H. Strand, Determination of opiates
and cocaine in urine by high pH mobile phase reversed phase UPLC-MS/MS, J.
Chromatogr. B Anal. Technol. Biomed. Life Sci. 877 (4) (2009) 421–432, doi:10.
1016/j.jchromb.2008.12.052.
[41] H.I.S. Kafeenah, R. Osman, N.K.A. Bakar, Effect of mobile phase pH on the
electrospray ionization efficiency and qualitative analysis of pharmaceuticals
in ESI + LC-MS/MS, J. Chromatogr. Sci. 57 (9) (2019) 847–854, doi:10.1093/
chromsci/bmz061.
[42] J.N. Mess, M. Lahaie, M. Furtado, F. Garofolo, Effect of high pH mobile phase on
the sensitivity of multiple drugs by LC positive electrospray ionization MS/MS,
Bioanalysis 1 (8) (2009) 1419–1430, doi:10.4155/bio.09.133.
[43] A. Tan, J.C. Fanaras, Use of high-pH (basic/alkaline) mobile phases for LC-MS or
LC-MS/MS bioanalysis, Biomed. Chromatogr. 33 (1) (2019) e4409, doi:10.1002/
bmc.4409.
[44] R. LoBrutto, et al., Effect of the eluent pH and acidic modifiers in highperformance liquid chromatography retention of basic analytes, J. Chromatogr.
A 913 (1) (2001) 173–187 -2, doi:10.1016/s0 021-9673(0 0)01012-8.
[1] S.T. Bogstrand, H. Gjerde, P.T. Normann, I. Rossow, Ø. Ekeberg, Alcohol, psychoactive substances and non-fatal road traffic accidents–a case-control study,
BMC Public Health 12 (2012) 734, doi:10.1186/1471- 2458- 12- 734.
[2] S. Kabashi, V. Vindenes, E.A. Bryun, E.A. Koshkina, A.V. Nadezhdin, E.J Tetenova, A.J Kolgashkin, A.E. Petukhov, S.N. Perekhodov, E.N. Davydova, D. Gamboa, T. Hilberg, A. Lerdal, G. Nordby, C. Zhang, S.T. Bogstrand, Harmful alcohol
use among acutely ill hospitalized medical patients in Oslo and Moscow: a
cross-sectional study, Drug Alcohol Depend. 204 (2019) 107588, doi:10.1016/j.
drugalcdep.2019.107588.
[3] J. Rehm, The risks associated with alcohol use and alcoholism, Alcohol Res.
Health 34 (2) (2011) 135–143 PMCID: PMC3307043.
[4] J. Rehm, C. Mathers, S. Popova, M. Thavorncharoensap, Y. Teerawattananon,
J. Patra, Global burden of disease and injury and economic cost attributable to
alcohol use and alcohol-use disorders, Lancet 373 (9682) (2009) 2223–2233,
doi:10.1016/S0140- 6736(09)60746- 7.
[5] World Health OrganizationGlobal Status Report on Alcohol and Health, World
Health Organization, 2014.
[6] J. Manthey, S.A Hassan, S. Carr, C. Kilian, S. Kuitunen-Paul, J. Rehm, What are
the economic costs to society attributable to alcohol use? A systematic review
and modelling study, Pharmacoeconomics 39 (7) (2021) 809–822, doi:10.1007/
s40273- 021- 01031- 8.
[7] H.J. Navarro, C.M. Doran, A.P. Shakeshaft, Measuring costs of alcohol harm to
others: a review of the literature, Drug Alcohol Depend. 114 (2) (2011) 87–99
-3, doi:10.1016/j.drugalcdep.2010.11.009.
[8] E.E. Bouchery, H. Harwood, J. Sacks, C.J. Simon, R.D. Brewer, Economic costs of
excessive alcohol consumption in the US, 2006, Am. J. Prev. Med. 41 (5) (2011)
516–524, doi:10.1016/j.amepre.2011.06.045.
[9] L. Gustavsson, ESBRA 1994 award lecture. phosphatidylethanol formation: specific effects of ethanol mediated via phospholipase D, Alcohol Alcohol. 30 (4)
(1995) 391–406 PMID: 8540905.
[10] M.A. Javors, N. Hill-Kapturczak, J.D. Roache, T.E. Karns-Wright, D.M. Dougherty,
Characterization of the pharmacokinetics of phosphatidylethanol 16:0/18:1 and
16:0/18:2 in human whole blood after alcohol consumption in a clinical laboratory study, Alcohol Clin. Exp. Res. 40 (6) (2016) 1228–1234, doi:10.1111/acer.
13062.
[11] C. Alling, L. Gustavsson, E. Anggard, An abnormal phospholipid in rat organs after ethanol treatment, FEBS Lett. 152 (1) (1983) 24–28, doi:10.1016/
0014- 5793(83)80474- 8.
[12] S. Aradottir, C. Lundquist, C. Alling, Phosphatidylethanol formation in rat organs after ethanol treatment, Biochim. Biophys. Acta 793 (1) (1984) 119–122,
doi:10.1111/j.1530-0277.2002.tb02569.x13.
[13] T.M. Maenhout, M.L. De Buyzere, J.R. Delanghe, Non-oxidative ethanol metabolites as a measure of alcohol intake, Clin. Chim. Acta 415 (2013) 322–329,
doi:10.1016/j.cca.2012.11.014.
[14] H. Andresen-Streichert, A. Müller, A. Glahn, G. Skopp, M. Sterneck, Alcohol
biomarkers in clinical and forensic contexts, Dtsch. Arztebl. Int. 115 (18) (2018)
309–315, doi:10.3238/arztebl.2018.0309.
[15] S. Aradottir, G. Asanovska, S. Gjerss, P. Hansson, C. Alling, PHosphatidylethanol
(PEth) concentrations in blood are correlated to reported alcohol intake in
alcohol-dependent patients, Alcohol Alcohol. 41 (4) (2006) 431–437, doi:10.
1093/alcalc/agl027.
[16] F.M. Wurst, N. Thon, S. Aradottir, S. Hartmann, G.A. Wiesbeck, O. Lesch,
K. Skala, M. Wolfersdorf, W. Weinmann, C. Alling, Phosphatidylethanol: normalization during detoxification, gender aspects and correlation with other
biomarkers and self-reports, Addict. Biol. 15 (1) (2010) 88–95, doi:10.1111/j.
1369-160 0.20 09.0 0185.x.
[17] A. Nalesso, G. Viel, G. Cecchetto, D. Mioni, G. Pessa, D. Favretto, S.D. Ferrara, Quantitative profiling of phosphatidylethanol molecular species in human
blood by liquid chromatography high resolution mass spectrometry, J. Chromatogr. A 1218 (46) (2011) 8423–8431, doi:10.1016/j.chroma.2011.09.068.
[18] Y. Zheng, O. Beck, A. Helander, Method development for routine liquid
chromatography-mass spectrometry measurement of the alcohol biomarker
phosphatidylethanol (PEth) in blood, Clin. Chim. Acta 412 (15) (2011) 1428–
1435 -16, doi:10.1016/j.cca.2011.04.022.
[19] M. Lopez-Cruzan, J.D. Roache, N. Hill-Kapturczak, T.E. Karns-Wright,
D.M. Dougherty, J.J. Sanchez, W. Koek, M.A. Javors, Pharmacokinetics of
phosphatidylethanol 16:0/20:4 in human blood after alcohol intake, Alcohol
Clin. Exp. Res. 42 (11) (2018) 2094–2099, doi:10.1111/acer.13865.
[20] A. Helander, U. Hermansson, O. Beck, Dose-response characteristics of the alcohol biomarker phosphatidylethanol (PEth)-a study of outpatients in treatment for reduced drinking, Alcohol Alcohol. 54 (6) (2019) 567–573, doi:10.
1093/alcalc/agz064.
[21] H. Gnann, C. Engelmann, G. Skopp, M. Winkler, V. Auwärter, S. Dresen, N. Ferreirós, F.M. Wurst, W. Weinmann, Identification of 48 homologues of phosphatidylethanol in blood by LC-ESI-MS/MS, Anal. Bioanal. Chem. 396 (7) (2010)
2415–2423, doi:10.10 07/s0 0216- 010- 3458- 5.
[22] R.N. Xu, L. Fan, M.J. Rieser, T.A. El-Shourbagy, Recent advances in highthroughput quantitative bioanalysis by LC-MS/MS, J. Pharm. Biomed. Anal. 44
(2) (2007) 342–355, doi:10.1016/j.jpba.2007.02.006.
[23] M. Meng, L. Wang, T. Voelker, S. Reuschel, K.C. Van Horne, P. Bennett, A systematic approach for developing a robust LC-MS/MS method for bioanalysis,
Bioanalysis 5 (1) (2013) 91–115, doi:10.4155/bio.12.295.
9