Small, smaller, smallest: Miniaturization of chromatographic process development
Bạn đang xem bản rút gọn của tài liệu. Xem và tải ngay bản đầy đủ của tài liệu tại đây (2.14 MB, 11 trang )
Journal of Chromatography A 1681 (2022) 463451
Contents lists available at ScienceDirect
Journal of Chromatography A
journal homepage: www.elsevier.com/locate/chroma
Small, smaller, smallest: Miniaturization of chromatographic process
development
Tiago Castanheira Silva a , Michel Eppink b,c , Marcel Ottens a,∗
a
Department of Biotechnology, Delft University of Technology, van der Maasweg 9, Delft, 2629 HZ, The Netherlands
Downstream Processing, Byondis B.V., Microweg 22, 6503 GB, Nijmegen, The Netherlands
c
Bioprocessing Engineering, Wageningen University, Droevendaalse steeg 1, 6708PB, Wageningen
b
a r t i c l e
i n f o
Article history:
Received 20 June 2022
Revised 12 August 2022
Accepted 24 August 2022
Available online 27 August 2022
Keywords:
High-Throughput Screening
Batch adsorption protein isotherms
Microfluidic chromatography
Liquid-Handling Stations
Miniaturization
a b s t r a c t
Biopharmaceuticals are becoming increasingly important in modern healthcare. Monoclonal antibodies
(mAb) are one of the most widely used therapeutic proteins and are important for the treatment of
cancer and autoimmune diseases, among others. After cell culture there are still large amounts of other
impurities (e.g. host cell proteins) in solution. Chromatography is usually the first purification step, allowing to increase purity and reduce volume. This comes associated with high costs and chromatography
accounts for a significant portion of total production costs for therapeutic proteins. Chromatographic process development may be time consuming and use large amounts of resins. Therefore, there is increased
interest in finding cheaper techniques for chromatographic process development without compromising
accuracy. This paper presents a highly sophisticated microfluidic chip approach for efficient adsorption
isotherm determinations compared to current chromatographic process development. Implementation of
an image analysis software ensures that chromatographic resin volume is accurately determined. The
adsorption isotherm performance of microfluidics was compared to the robotic Liquid-handling Station
(LHS) and labor intensive Eppendorf tubes. The microfluidic chip allows a 15-fold volume reduction and
resin consumptions as low as 10 0/20 0 nl (20 0/10 0-fold reduction). The microfluidic chip performed comparably to the other miniaturized techniques, using less liquid and resin volume. For process development of expensive products (e.g. monoclonal antibodies), miniaturization (provided by the microfluidic
chip) proved to be the most cost effective alternative whereas for less valuable products (e.g. lysozyme)
automation (provided by the LHS) was the most cost effective alternative.
© 2022 The Author(s). Published by Elsevier B.V.
This is an open access article under the CC BY-NC-ND license
( />
1. Introduction
The past few years have seen increasing general public interest
in the biopharmaceutical industry, mainly in the field of vaccine
production due to the Covid pandemic. For the industry, a fast,
reliable, and preferably cost-effective process development is important to respond to the market’s needs. Patient accessibility to
therapeutic proteins depends on several aspects, such as the cost
of treatment or product availability. Although patent expiration
considerably decreases the retail price of monoclonal antibodies
(mAb), the price may still be prohibitive for patients [1,2]. HighThroughput Screening (HTS) is used to decrease time to market
and reduce development costs, especially in early stages of process
∗
Corresponding author: Department of Biotechnology, Delft University of Technology, Van der Maasweg 9, Delft, 2629 HZ, The Netherlands.
E-mail address: (M. Ottens).
development. Moreover, increased use of mechanistic modeling of
the processes combined with the ability to determine different parameters faster originated High-Throughput Process Development
(HTPD). In the past decades HTPD has proven to be a valuable tool
for faster and cheaper process development [3].
Chromatography plays a key role in the purification of biopharmaceuticals, as it usually is the first purification step in the
downstream process and the one responsible for high purification factors [4]. However, this comes associated with high costs,
since preparative chromatography can be very expensive. Therefore, chromatography accounts for a significant portion of the cost
of producing therapeutic proteins [5]. Process development for
chromatography involves the screening of different consumables
(chromatographic resins, buffers) and conditions to find a suitable
purification process. Equilibrium adsorption isotherms are amongst
the important parameters to be determined for model based chromatographic process development [6]. Batch uptake experiments
/>0021-9673/© 2022 The Author(s). Published by Elsevier B.V. This is an open access article under the CC BY-NC-ND license
( />
T.C. Silva, M. Eppink and M. Ottens
Journal of Chromatography A 1681 (2022) 463451
in 96 well-plates have also been used to calculate the partition
coefficient and separation factor [7,8]. These give an indication
of the purification capabilities of the tested systems. Isotherms
provide insight on the thermodynamics of the studied systems,
which are composed of the different buffers and the resin-protein
pairs [9]. Previously, protein adsorption isotherms in batch uptake
mode were determined using agitated vessels, with sample volume
reaching up to hundreds of milliliters [10]. This method required
large amounts of sample and resin. Current technology enabled researchers to reduce the amount of sample and materials, by using
microtiter plates both with 96-well and 384-well format [11,12].
Researchers started to push for a manifold volume reduction,
due to the high costs of chromatographic resin and sample waste
and limited amount of sample available in early stages of process
development (e.g. clinical trials). Different formats to determine
adsorption isotherms emerged, like the use of plastic (Eppendorf)
tubes, with volume requirements in the milliliter range [13]. Subsequently, Liquid-Handling Stations (LHS) were employed, reducing volume requirements to the sub-milliliter range. These offer a
great automation to screen a plethora of consumables available for
chromatographic process development [14]. Although LHS have become the status quo for both industry and academia [12,15], these
platforms and consumables are expensive and still require a fair
amount of product, which can be scarce in early stages of process
development. It would be beneficial to reduce volume consumption in early-stage process development while maintaining accurate results. Microfluidics presents itself as a viable alternative for
analytics and process development in many areas of the life sciences, often operating in the nanoliter range [16]. Although it has
the obvious advantage of reducing volume (and, therefore, cost),
microfluidics can also be more flexible and versatile than LHS,
when the devices can be designed and produced from zero (for
devices already commercialized this does not apply). Microfluidic
devices have also been used for studying and screening conditions
to determine protein adsorption isotherms [17], and protein purification [18]. Although these studies show the great miniaturization
achieved by microfluidics, the use of a fluorescent label has proven
to interfere with the protein, altering its properties [19,20]. A clear
comparison of different miniaturization techniques is currently not
available in the open literature.
This paper compares different miniaturization techniques for
the determination of protein adsorption isotherms. It discusses the
accuracy, usability, and technology readiness level (TRL) of each
technique. Additionally, the cost of each screening solution is evaluated. Finally, this work shows how to use the small volume (Eppendorfs), smaller volume (LHS), and smallest volume (microfluidics) tools for chromatographic process development.
GmbH, Berlin, Germany. Polydimethylsiloxane (PDMS) was purchased as a Sylgard 184 elastomer kit (Dow Corning; Midland, MI,
USA).
The resin used in the study was SP SepharoseTM Fast Flow
(SP-Sepharose-FF) from Cytiva, Uppsala, Sweden. This is a strong
cation-exchange agarose based resin and has a mean particle size
of 90 μm.
2.2. Buffers and solutions preparation
The lysozyme experiments were performed with sodium phosphate buffer containing 10 mM Na2 HPO4 and varying NaCl concentrations adjusted to pH 6.5 with phosphoric acid. The mAb experiments were performed with buffer containing 25 mM NaOAc and
5 mM NaCl adjusted to pH 4.5 with 2 M NaOH. NaCl was added
to the buffer solutions to adjust the total Na+ concentration of the
solutions. All experiments were performed at room temperature.
0.01% w/v Tween® 20 was added to acetate buffer for the mAb
experiments. The different buffers and solutions were prepared by
dissolving the appropriate amount of chemical in Milli-Q water.
Lysozyme solutions were prepared by dissolving the appropriate amount of protein in the corresponding buffer. MAb solutions
were used in the conditioning buffer that the protein was provided
(mentioned above). All buffers and solutions were filter-sterilized
using 0.20 μm filters.
2.3. Microfluidic chip fabrication
The microfluidic chips were fabricated in two main steps: fabrication of the mastermolds and of the PDMS structures.
2.3.1. Production of mastermolds
The SU-8 mold (mastermold) was fabricated using direct write
optical lithography (DWL). A SU-8 2100 layer of 100 μm was spin
coated on top of a clean Si substrate. The substrate was soft baked
in a hotplate for 5 min at 65 °C and subsequently for 30 min
at 95 °C. The mold was placed in the laserwriter (μMLA Tabletop Maskless Aligner; Heidelberg Instruments Mikrotechnik, Heidelberg, Germany), where it was exposed with a 365 nm laser. The
exposure energy used for this fabrication was 225 mJ/cm2 . After
exposure, the substrate was placed in a hotplate for post exposure
bake for 5 min at 65 °C and 10 min at 95 °C. Afterwards, the mastermold was developed by immersing it in mr-Dev 600 (Microresist, Berlin, Germany) and hand stirring for a minimum of 10 min.
After this, it was rinsed with isopropyl alcohol (IPA) and spin-dried.
Finally, the mastermold was hard baked for 15 min at 150 °C.
2.3.2. Fabrication of PDMS structures
The PDMS microchips were fabricated using standard PDMS
soft lithography [21]. PDMS elastomer was prepared by mixing the
elastomer base and curing agent in a (7:1) ratio. The mixture was
degassed and placed on top off the mold. Simultaneously, a (20:1)
mixture of elastomer base and curing agent was also prepared
and degassed. This mixture was poured on top of glass slides and
spin coated at 2500 rpm for 1 min. The covered mold and glass
slides were baked at 80 °C for 45 min. After baking, the structure
was peeled from the mold, and access holes (inlets and outlets)
of 1.25 mm were punched using a hole-puncher. The structure was
then placed on the PDMS-covered glass slides and sealed. The final
structures were baked overnight at 80 °C.
2. Materials and methods
2.1. Materials
Two different proteins were used in this study: lysozyme from
chicken egg white (Mw of 14 300 Da, pI ≈ 11; Sigma-Aldrich
Chemie GbmH, Steinheim, Germany) and purified monoclonal antibody (Mw of 148 220 Da, pI ≈ 8.6; Byondis B.V., Nijmegen, The
Netherlands).
Sodium phosphate monobasic dehydrate, acetic acid (≥99.8%)
and Tween® 20 were purchased from Sigma-Aldrich Chemie
GbmH, Steinheim, Germany. Phosphoric acid (85%) and sodium
hydroxide were purchased from Mallinckrodt Baker, Deventer,
The Netherlands. Sodium Chloride was purchased from VWRChemicals, Leuven, Belgium. Di-sodium hydrogen phosphate was
purchased from Merck KGaA, Darmstadt, Germany. SU-8 2100 photoresist was purchased from MicroChem, Newton, MA, USA and
Developer mr-Dev 600 was purchased from micro resist technology
2.4. Batch uptake adsorption isotherms
Adsorption isotherms provide information on the equilibrium
concentration of a solute adsorbed to a solid phase (chromatographic resin) at different liquid concentrations. A known amount
2
T.C. Silva, M. Eppink and M. Ottens
Journal of Chromatography A 1681 (2022) 463451
of protein is contacted with a known amount of resin and the
equilibrium liquid concentrations are measured. The time to reach
equilibrium varies according to the different systems. The amount
of protein adsorbed to the solid phase was calculated by a mass
balance, described by the following equation:
qeq =
Vl × cl,initial − cl,eq
Vr
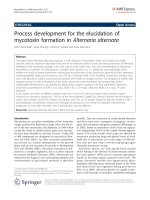
Fig. 1 shows a schematic setup of the microfluidic chip. A peristaltic pump (ISM596D from Cole-Parmer, Wertheim, Germany)
was used to recirculate the solution through the microchip. The
pump used a PharMed® BPT tube (0.51 mm ID; Cole-Parmer,
Wertheim, Germany), which was connected to PolyEtherEtherKetone (PEEK) tubes (0.18 mm ID; BGB, Harderwijk, The Netherlands).
The PEEK tubes were directly connected to the microfluidic chip.
The calculation of the equilibrium concentration was done using a
calibration curve performed before each trial.
To perform the adsorption trials, the tube system was continuously primed with protein solutions of known concentrations, until a plateau was reached in the UV detector. After the plateau was
reached, a protein solution of another concentration was successively primed until all the solutions for the calibration curve were
primed. After this, the last solution to prime was the solution with
the desired initial protein concentration. When the plateau of the
signal was observed the pumping was stopped, and the PEEK tubes
were directly connected to the microchip containing the chromatographic resin (see Fig. 1). After connecting, the pumping was resumed and the solution was recirculated until equilibrium was
reached. Equilibrium was assumed to be reached when the signal stopped changing over time. The equilibrium concentration was
used to calculate the mass balance to determine the amount of adsorbed protein in each trial.
(1)
where qeq is the protein adsorbed to the resin in equilibrium, Vl
is the volume of liquid, Vr is the volume of resin, and cl,initial and
cl,eq are the protein concentrations in the liquid phase in the beginning and after equilibrium is reached, respectively. Equilibrium
adsorption isotherms were obtained with triplicate experiments.
2.4.1. LHS
Batch adsorption isotherm data were generated using a LHS
(Tecan EVO Freedom 200 robotic station; Tecan, Switzerland). The
LHS was equipped with an orbital mixer (Te-Shake), an automated vacuum system (Te-VacS), a multi-well plate reader (InfiniTe Pro 200), a robotic manipulator (RoMa) arm, two different
liquid-handling arms (LiHa and MCA96) and a centrifuge system
(Rotanta).
A known amount of resin (20.8 μL) was added to a 96-well filter plate (Pall Corporation, NY, USA) using a MediaScout® ResiQuot
resin loader device from Atoll (Weingarten, Germany). To wash the
resin, equilibration buffer was pipetted into the filter plate and it
was shaken for 5 min at 1200 rpm, after which the solution was
removed using the vacuum system. This cycle was performed 3
times in total. Protein solutions were subsequently pipetted (800
μL) inside the well plates, which were sealed, and the plates
were agitated at 1200 rpm until equilibrium was reached (2 h for
lysozyme and 18 h for mAb). Once equilibrium was reached, the
filter plate was placed on top of a 2 mL deep-well plate (Eppendorf
AG, Hamburg, Germany) and these were centrifuged together using
the centrifugation system. The supernatant was collected from the
deep well plates to a UV star plate and the equilibrium concentrations were measured using the plate reader. Equilibrium concentrations were estimated using appropriate calibration curves, obtained using the LHS.
2.4.3.2. Bead loading and volume determination for microfluidic chip.
A suspension of 0.5% v/v chromatographic resin in storage buffer
was prepared, by pipetting appropriate amounts of settled resin
and storage buffer. The solution was vortexed and approximately
150 μL of this solution was promptly pipetted directly into the microchip inlet using a micropipette. By suspending the resin and
rapidly pipetting it into the microchip, it is avoided that the resin
settles in the bottom of the pipette tip. This would block the microchip and hinder the entrance of the resin in the channel. Downstream of the channel there are frits. These structures, spaced
50 μm from each other vertically and horizontally, will trap the
beads inside the microchannel. After a sufficient amount of resin
is loaded into the channel, the tip is removed and the microchip is
analyzed in the microscope to estimate the total bead volume.
An accurate bead volume determination is paramount for the
determination of the adsorption isotherms. Pictures of the loaded
channel allow to estimate the number of beads and their radius.
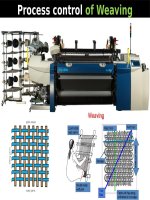
These images are then loaded into a MatLab script for image analysis. Using the built-in function imfindcircles and appropriate parameters, it is possible to estimate the number of beads detected
and the radius, in pixels, of each bead. Using an appropriate calibration (for example the channel’s width, of 10 0 0 μm), it is possible to correlate the bead radius in pixels with the distance per
pixel (μm/px). With the information of the bead radius in micrometers, the bead volume is calculated using the formula for the volume of a sphere. An example of this bead volume determination
can be found in Fig. 2. The beads are then washed with 200 μL
of equilibration buffer. The interstitial porosity of the channel was
not calculated since the experiments focus on studying the adsorption equilibrium of different proteins to a chromatographic resin.
The microfluidic chip is used to mimic the batch adsorption mode
of operation. Therefore, this parameter was considered to not be
important since it provides information for the performance of
packed columns but no relevant information for the equilibrium
data between ligand and solute of interest.
2.4.2. Eppendorfs
The batch adsorption isotherms in Eppendorf tubes were estimated using a similar method to the one described above. The
studies were performed in 1.5 mL tubes. 800 μL of protein solutions were prepared by hand into each of the tubes. The solutions
were then contacted with 20.8 μL of resin (generated using the
same method as described for LHS). The tubes were rotated endover-end at 10 rpm, until equilibrium was reached (the same was
described above). After equilibrium was reached, the tubes were
centrifuged (Sigma 112 from De Spatel B.V., The Netherlands), and
the supernatant was hand-pipetted to a UV star plate, and the
equilibrium concentrations were measured using the plate reader
mentioned above. Equilibrium concentrations were estimated using appropriate calibration curves.
2.4.3. Microfluidic chip
2.4.3.1. Setup and mode of operation. The batch adsorption
isotherms in the microfluidic devices were determined by recirculating protein solution through the microchip, that contained
beads trapped inside. This is achieved with a closed system, where
the same liquid is continuously pumped through the same resin
volume, until equilibrium is reached. In the system, an inline UV–
Vis detector (SPD-20AV; Shimadzu, Kyoto, Japan) with a microflow
cell (0.2 μL), allows to monitor the evolution of the adsorption
over time.
2.4.3.3. Mass balance in microfluidic chip. The mass balance for the
microfluidic chip is similar to the one presented in Eq. (1). However, for the microchip system, the initial protein concentration is
determined for the tubing system, which doesn’t account for the
buffer volume present in the microchip. Therefore, an adjustment
3
T.C. Silva, M. Eppink and M. Ottens
Journal of Chromatography A 1681 (2022) 463451
Fig. 1. Microfluidic experimental setup for the determination of protein adsorption isotherms. A) Schematics of the setup. Yellow lines represent the PharMed® BPT tube
that is connected to the peristaltic pump; black lines represent the PEEK tubing. Arrows show the direction of fluid flow through the system. B) Zoomed in image of the
microfluidic chip with schematics for resin loading into the microchip. The resin is loaded using a micropipette tip and the chromatographic beads are trapped by the frits
further down the channel.
Fig. 2. Image Analysis software. Top Left: Original image used as input for the program. Top right: visualization of the bead radius determination by the MatLab function
imfindcircles. Bottom: Histogram distribution of the bead radius.
Table 1
Overview of liquid and adsorbent volumes used in each experiment with each of
the different methods.
to the previous mass balance equation is needed:
qeq
cl,initial × Vtubing − cl,eq × Vsystem
=
Vr
Vsystem = Vtubing + Vμ−chip + Vl iquid
pl ugs
(2)
(3)
Where Vtubing is the volume of the tubes and the detector of the
spectrophotometer, and Vμ−chip is the volume of the microchip.
With these equations, all the buffer volume present in the final
system (after the tubes are connected to the microchip) is considered. The volume of the “liquid plugs” (Vl iquid pl ugs ) in the mass
balance was determined experimentally by measuring the height
of the plug and considering a diameter of each inlet of 1.25 mm.
This was also confirmed experimentally by running a test without resin inside the microchip and calculating the final liquid volume with the concentration after recirculation (data not shown).
The total liquid volume for each microfluidics experiment was 56
μl and the resin volume per trial was around 200 nl (slight variations from experiment to experiment). The microchip system has
a significantly larger volume than the microchip itself, mostly due
to the tubing needed to operate the system. To reduce this vol-
Method
Adsorbent Volume (μl)
Liquid Volume (μl)
LHS
Eppendorf
μ-chip
μ-chip system (chip+tubing)
20.8
20.8
0.2
0.2
800
800
1.12
56
ume further, the tube length reduction of the peristaltic pump can
be considered. The total adsorbent and liquid volume used in each
methodology is summarized in Table 1.
3. Results and discussion
3.1. Microchip design and operation
A microfluidic chip was designed to determine protein adsorption isotherms in batch uptake mode. The liquid phase (buffer solution containing protein) is permanently contacted with the solid
4
T.C. Silva, M. Eppink and M. Ottens
Journal of Chromatography A 1681 (2022) 463451
Fig. 3. Microfluidic chip design. A – Schematics of the whole microchip. B – Microscope image of the frits and outlet. The black circle is the hole punched with the punching
tool and where the tube will be fit. C – Zoomed in image of the whole frit structure used. D – Zoomed in image of the top frits and indication of distance between frits. B,
C and D are microscope pictures of the same structure, under different magnifications.
phase (chromatographic resin). Usually this is achieved by means
of stirrers (e.g. magnetic stirrer in a glass flask), or by shaking the
solution in shake flasks or orbital shakers (e.g., for the case of LHS).
In the presented microfluidic chip the batch uptake is achieved
by continuously pumping (by means of a peristaltic pump, Fig. 1)
the protein solution through a microchannel where the chromatographic resin is trapped. The channel has a height of 100 μm,
which can accommodate a plethora of resins used in the biopharmaceutical field (e.g. SP Sepharose FF (SP Seph FF) has an average diameter of 90 μm). To trap the beads, frits (pillar-like structures) were included in the design of the microchip. There are different methods one can apply to achieve this [22,23]. The chosen
method was to have 5 frit columns next to each other. Compared
to the studied alternatives (shafts, which is achieved by differences
in height channels, narrowing the channel height to trap the resin),
the frit design showed less flow constrains when performing simple flow simulations (data not shown). Each frit has a diameter of
50 μm, and the vertical and horizontal distance between frits was
also set at 50 μm (Fig. 3). The liquid inlet (Fig. 3-A, right) was designed to have a circular shape that would allow for the bead loading, whereas the liquid outlet (Fig. 3-A, left) was designed with triangles to easily guide the liquid to the outlet and serve as an extra
barrier in case of defected frits that would fail to trap the beads,
thus avoiding major fouling in the tubes.
The liquid flow was ensured by a peristaltic pump. The liquid
flowed from the inlet (Fig. 3A, right circular shape) to the outlet (Fig. 3A, left circular shape with triangle shapes). The beads
were successfully trapped by the frit system, which is important
to avoid fouling of the PEEK tubes used in the system. Besides SP
Seph FF, beads of average particle diameter of 75 μm were also
successfully trapped in the frit system. PDMS-based microfluidic
chips can fail at relatively low pressures, so it is important that
the pressure inside the flowing channel is as low as possible [24].
Therefore, a flow rate of 50 μl/min was employed, which enabled
a good balance between a relatively low pressure in the channel,
low bead compression against the frits, and fast enough recirculation through the system.
3.2. Image analysis
To determine protein adsorption isotherms and ensure results
are reliable, it is important to have a good characterization of the
concentration of protein in the liquid phase as well as the total
resin volume that the protein solution contacts. For the first, inline
monitoring of the absorbance values is used whereas for the second an image analysis program was developed. The crude images
were uploaded to the program and the only processing required
was the conversion from red green blue (RGB) to black and white
and snipping the area to evaluate.
By using the function described in Section 2.4.3.2, it was possible to determine the radius of the chromatographic beads, given
in pixels. The calibration used the channel’s width (as shown in
Fig. 3A) to convert the radius to μm. Fig. 2 shows the output of the
program. The implementation of an appropriate calibration is important for the microfluidic chip results. Furthermore, ImageJ software was also used as an alternative to the described program
to determine the resin volume. It had a worse performance for
the intended purpose, as it was labor intensive and less accurate
(data not shown). Therefore, it was decided that the most suitable method for chromatographic resin volume determination in
the microchip was with the aforementioned program.
3.3. Determination of time to equilibrium
The monitoring of the adsorption of protein to the chromatographic resin was achieved by inline monitoring of the absorbance
values at a wavelength of 280 nm (A280 ). This allows to monitor in
real time the adsorption of protein. In Fig. 4 it is possible to see the
absorbance signal of two different systems throughout the time the
experiments were performed. From this figure it is obvious that
each system has its own characteristic time to equilibrium, which
is the time it takes for the adsorption and desorption of protein
molecules to the chromatographic resin to reach an equilibrium,
meaning that the concentrations in the liquid and solid phase no
5
T.C. Silva, M. Eppink and M. Ottens
Journal of Chromatography A 1681 (2022) 463451
Fig. 4. Time to equilibrium of Lysozyme (A) and mAb (B) on Sp Seph FF. A – Lysozyme in 10 mM Phosphate buffer, pH 6.5, [Na+ ] = 50 mM; B – mAb in 25 mM Acetate
Buffer, pH 4.5, [NaCl] = 5 mM. Dashed line in A shows a closer look at the first 10 min of recirculation, where the signal oscillation can be explained by the presence of
two phenomena: i) already some adsorption from the first pass of protein through the chromatographic beads and ii) local dilution of the solution due to the presence of
protein-free solution present inside the microchip that is reaching the detector. Lysozyme systems reached the plateau around the 100-minute mark whereas mAb system
reached the plateau around the 10 0 0-minute mark.
longer change with time. The time to equilibrium varies dependent
on the protein, buffer, and resin used in each experiment
After recirculation is started (time = 0 min), there is a lag time
before a signal drop is observed. This is because the system was
primed with a protein solution, which is still present in the tubes
between the microchip and the detector. The first valley that can
be seen in Fig. 4, and is highlighted in Fig. 4-A, is representative of
two phenomena: i) the adsorption of the first “protein front” upon
passing through the chromatographic resin for the first time, and
ii) a local dilution of the solution due to the presence of proteinfree buffer inside the microchip. The signal gradually smoothens
as a result of a better mixing and adsorption throughout the duration of the experiment. Eventually, the signal flattens and reaches
a plateau, which indicates the time to equilibrium. It is noteworthy that for the tested resin and systems, the mAb showed the
longest time to equilibrium (around the 10 0 0 min mark), whereas
for lysozyme the systems reached equilibrium before the 120 min
mark. This difference can be explained by the smaller effective diffusivities that mAbs have compared to Lysozyme on SP Seph FF
[25]. The larger mAb molecules take longer to migrate through the
pores into the center of the particles, contributing to a longer time
needed to access all available binding sites.
Fig. 5. Adsorption isotherms of Lysozyme on SP Seph FF, in 10 mM Phosphate
buffer pH 6.5, [Na+ ] = 50 mM, using 3 different methodologies: ( ) microfluidic
chip, ( ) LHS and (♦) Eppendorf tubes. Dashed lines represent the fitting of the different data sets to the Langmuir model. The parameters of the fitting can be found
in Table 2.
Table 2
Langmuir parameters of Lysozyme and mAb adsorption isotherms on SP Seph
FF.
3.4. Protein adsorption isotherms
3.4.1. Lysozyme on SP Seph FF
The adsorption of Lysozyme to SP Seph FF was studied.
Lysozyme has a very high pI, meaning that at the tested conditions
its net charge will always be positive. Since SP Seph FF is a CationExchange (CEX) resin, it was expected that a favorable adsorption
behavior would be observed [26].
The isotherm data presented in Fig. 5 shows the adsorption
isotherms of Lysozyme determined with the 3 different methodologies, as well as the fitted results to a Langmuir isotherm model
(Eq. (4)). The adsorption of Lysozyme to SP Seph FF is highly favorable, visible by the rectangular shape of the three isotherm curves.
q=
qmax KC
1 + KC
Lysozyme
Method
qmax (mg/ml)
K (ml/mg)
μ-chip
LHS
Eppendorf
136.4
98.8
86.8
17.8
33.1
71.7
Method
qmax (mg/ml)
K (ml/mg)
μ-chip
LHS
Eppendorf
148.0
165.6
137.7
5.6
9.3
15.4
mAb
(4)
The regressed parameter values for the qmax and K estimated
from the fitting of the experimental data to Eq. (4) are summarized in Table 2. From the aforementioned figure and table, it is
noticeable that the microfluidic chip estimated higher adsorption
values of Lysozyme to the SP Seph FF for the studied system. Although the estimated values for the microchip are higher than for
the other two methodologies, these are still within the same order of magnitude. The fitted isotherms also show a similar shape,
6
T.C. Silva, M. Eppink and M. Ottens
Journal of Chromatography A 1681 (2022) 463451
meaning that the microchip also shows the highly favorable adsorption behavior of Lysozyme to SP Seph FF.
Proteins can interact with PDMS and non-specific adsorption of
proteins to the PDMS surface has been previously reported [27].
To understand if this phenomena was occurring in our system,
some experiments with no resin inside the microchannel were performed. The results showed a flat signal over the duration of the
trial (data not shown). Furthermore, there is a very low area of
PDMS that contacts the solution at any given point in time and
the liquid is being continuously pumped through the channel. Not
only it is unlikely that there is non-specific adsorption, but this is
greater when the solution is contacted statically with the PDMS
surface [27]. The fluid flow through the microfluidic chip would
contribute to prevent the non-specific adsorption of Lysozyme to
the PDMS surface.
3.4.2. mAb on SP Seph FF
The adsorption of mAbs to SP Seph FF was also studied using the same setup. Initial experiments showed some instability
in the UV signal of the solution containing mAb throughout the
recirculation time. A recent study showed that different kinds of
peristaltic pump tubes can affect the solutions [28]. The authors
saw that the amount of nano and microparticles in solution increased over the pumping trials with water and buffer solutions,
meaning that some particle shedding from the tubes to the solution is occurring. The study showed that there is particle shedding from the tube’s material to the solution, and from the tested
tubes, the one that shed the most particles was PharMed® BPT.
Although the amount of particles present in protein-free solutions
increased with the peristaltic pumping, this was much more pronounced when protein solutions were pumped. This could help explain that the pumping and particle shedding can influence the
stability of the studied protein solution, potentially leading to more
aggregation. Another study by Deiringer and Friess hypothesizes
that protein particle formation is caused by the formation of a protein film in the surface of the tube and consequent tearing of the
film caused by the pump rollers, thus releasing parts of this film
in solution [29]. However, both studies show that the addition of
surfactants to the proteins solutions would significantly reduce this
phenomenon.
Keeping these studies’ observations and our own in mind, the
adsorption studies with the mAb were carried out with a solution
containing 0.01% Tween® 20 to increase the solution’s colloidal
stability. LHS studies showed comparable adsorption between the
solutions with and without the added surfactant (data not shown).
Similarly to what was observed for Lysozyme, it was expected that
mAb would have a favorable adsorption to SP Seph FF at the tested
pH, as it is positively charged in these conditions. The results of the
inline monitoring of the signal with the microfluidic chip, shown in
Fig. 4, were used to define the time to equilibrium needed for this
system.
Fig. 6 shows the adsorption isotherms of mAb with the three
different methodologies, as well as the fitted results to a Langmuir model. From these results, it is possible to see that the adsorption behavior of mAb to SP Seph FF is favorable, characterized
by the slope of the linear part of the isotherm. For this proteinresin pair it is noticeable the microchip results are more in line
with what was determined by the other two methodologies. The
regressed parameter values for the qmax and K estimated from
the fitting of the experimental data to Eq. (4) are summarized in
Table 2.
This system showed the most agreement between the three
methodologies, with the Langmuir fitting for the microfluidic chip
placed between the fitted Langmuir isotherms for the LHS and Eppendorfs. The microfluidic chip can, therefore, capture the adsorption behavior of the Lysozyme and mAb.
Fig. 6. Adsorption isotherms of mAb on SP Seph FF, in 25 mM Acetate buffer pH
4.5 and 5 mM NaCl, using 3 different methodologies: ( ) microfluidic chip, ( ) LHS
and (♦) Eppendorf tubes. Dashed lines represent the fitting of the different data sets
to the Langmuir model. The parameters of the fitting can be found in Table 2.
3.5. Cost considerations
The adsorption isotherms results show that the microfluidic
chip, the LHS, and the Eppendorf tubes are different methodologies
that achieve very similar results for the intended purpose. It would
be good to have a comparison between the three methodologies
in terms of costs and compare the key features of each. For the
cost considerations, four different methodologies were considered:
LHS (both renting and purchasing one), microfluidic chip, and Eppendorf tubes. Three cost categories were considered: equipment
costs, material costs and labor costs. These cost considerations take
into account the current technology state of each methodology
used for the studies adsorption studies.
The equipment costs comprise all the necessary equipment for
the operation of each of the methodologies. The renting price of
the LHS includes all the necessary equipment integrated in the LHS
that is used for the determination of adsorption isotherms. For the
microfluidics systems a shorter depreciation period was considered
for the tubings and wafers due to the greater wear that these are
subjected to and, therefore, shorter lifetimes. The equipment necessary for the fabrication of the mastermold, which is often very
expensive, was not considered. The costs of the device used for
the preparation of the resin plugs for the LHS and Eppendorf studies were not considered. The materials cost estimation is based
on the materials and consumables needed to perform the experiments. The labor cost estimation is based on the hours needed of
active labor, which is the time that an operator needs to actively
work for the determination of the adsorption isotherms. For all the
systems the reagent preparation (buffer and protein solutions) was
considered. For the LHS studies, the operation was considered as
the necessary time to prepare the LHS, resin plug preparation and
supervision of initial stages of the operation, to ensure everything
runs without errors. For the microfluidics studies, the chip production was considered, as well as microchip operation. The latter includes the time that the operator is required to operate the system
and does not include the incubation time. For the Eppendorf studies, besides the reagent preparation, the pipetting of the solutions
used for the study was also considered. The operation included the
preparation of the resin plugs, the loading of the plugs to different
Eppendorf tubes, and operating the rotor. The removal of the supernatant and subsequent dilution (when needed) of the solution
in the 96 well-plate was also considered. A rate of 25€/h of labor
costs was considered for the present study. The considered equip7
T.C. Silva, M. Eppink and M. Ottens
Journal of Chromatography A 1681 (2022) 463451
Table 3
Overview of the needed equipment, materials and labor hours needed for the determination of protein adsorption isotherms for the different methodologies studied.
Equipment Costs
Method
Equipment
Cost (€)
Depreciation
period
Part used for isotherm
determination
yearly equipment
cost (€)
LHS
LHS (rent)
Microfluidic chip
LHS
LHS
Peristaltic Pump
UV-Detector
Other (tubes, connectors, etc.)
Wafer
Multi-well Plate Reader
Rotor
400,000
10,000
3508
15,000
1000
410
10,000
586
10
–
10
10
1
0.5
10
10
0.5
1
1
1
1
1
1
1
20,000
10,000
350.8
1500
1000
820
1000
58.6
Eppendorf
Materials
Method
Materials needed
Amount needed per isotherm
All
Resin
Buffer
Protein
Filter plate
UV plate
Deep-Well Plate
Disposable Tips LHS
PDMS + Curing Agent
Eppendorf tubes
UV plate
Dependent on methodology
Dependent on methodology
Dependent on methodology
0.5 (pieces)
0.5 (pieces)
0.5 (pieces)
0.5 (pieces)
7.5 g
48 (pieces)
0.5 (pieces)
Method
Task
Hours spent per Task per isotherm
All
LHS (Purch. & Rent.)
Microfluidic chip
Reagent prep
Operation
Microchip production
Operation
Pipetting to Eppendorf tubes
Removing supernatant
dilution to UV-Plate
Operation
1
1
0.5
9
1
1.5
0.75
1
LHS (Purch. & Rent.)
Microfluidic chip
Eppendorfs
Labor Hours
Eppendorfs
ment, materials and labor hours per isotherm for each methodology are summarized in Table 3.
The cost determination of the protein isotherms was based on
the three components described above. This was done for two
different scenarios: one where a “cheap” protein was considered
(e.g. Lysozyme, which costs 0.03 €/mg) and another where an “expensive” protein was considered (e.g. mAb, which was estimated
to cost 2.29 €/mg, based on the average price of the infliximab
biosimilar in 2016 [30]). This was considering the determination
of 100 protein adsorption isotherms per year. Besides this, an estimation of the variation of the cost per isotherm with the number
of isotherms determined per year was also performed.
It is possible to see that, out of all the 4 options, the LHS have
the highest material cost, for both scenarios (Fig. 7). This is because of the significantly larger liquid and resin volumes used by
the technique (800 μl and 20.8 μl versus 56 μl and 0.2 μl, respectively) per data point. The Eppendorfs also use the same amount
of liquid and resin volumes, but require less disposables than the
LHS, hence why the materials costs are lower. This difference becomes less evident for the “expensive” protein scenario since the
costs related to the sample represent the higher portion of materials costs for these two methods (LHS and Eppendorfs). However,
the lesser consumables use comes at the expense of added labor
and, consequently, higher labor costs.
The advantage of automation is reflected in the lower labor
costs of the LHS in both scenarios and proves to be an advantage when low-value proteins are studied. On the other hand, the
miniaturization of the adsorption studies proves to be very advan-
tageous when high-value proteins are studied. Increasing protein
costs will change the cost driver of LHS and Eppendorf to the materials whereas the cost driver of the microfluidic chip will always
be the labor costs. The labor needed for the isotherms studies considered the microfluidic chip methodology as it was previously described. However, this could be reduced by increasing the automation of the system, bringing the Labor costs down. Therefore, the
cost performance of the LHS is dependent on the materials prices.
Consequently, a high degree of miniaturization is preferred for very
expensive proteins and a high degree of automation is preferred for
cheap materials.
An increased number of isotherms to be determined per year
also contributes to a “dilution” of the costs per isotherm for the
LHS (see Fig. 8). This is mainly due to a decreasing contribution of
the equipment costs for an increasing number of isotherms determined per year. As expected, the microfluidics costs per isotherm
plateau at a relatively low number of isotherms to be determined per year; this is because the labor costs are the main cost
driver and the labor per isotherm is independent of the number of isotherms to be determined per year. A similar trend can
be observed for the Eppendorfs, as the main cost driver for the
cheap protein is the labor, but for the expensive protein is the
materials. For the renting of the LHS, it was considered that only
120 isotherms could be determined in a 3-month rental period (2
isotherm per day for a 60 working day period). Renting the equipment two times a year would already bring the yearly costs of
the equipment at the same level as purchasing the LHS, which
would then be considered to be more cost-effective. It is important
8
T.C. Silva, M. Eppink and M. Ottens
Journal of Chromatography A 1681 (2022) 463451
Fig. 7. Breakdown of the costs for the determination of protein adsorption isotherms, for a LHS (purchasing and renting), microfluidic chip and Eppendorf tubes, for a base
case of 100 isotherms determined per year. The costs are normalized relative to the methodology of the scenario that has the highest overall cost (LHS for the Expensive
Protein scenario). Left – Scenario for the “expensive” protein; the most expensive method for this scenario was the LHS (purchasing), with an isotherm to be estimated
to cost 665€. Right – Scenario for the “cheap” protein; the most expensive method for this scenario was the microfluidic chip. The percentages show what is the percent
contribution of the Labor, Materials and Equipment cost for each methodology in each scenario (e.g. for LHS in the “cheap” protein scenario, 8% of the isotherm costs were
Labor costs, 15% Material costs and 77% Equipment costs).
Fig. 8. Variation of the price per isotherm with increasing number of isotherms determined per year, for the 4 different methodologies considered. A minimum number of
20 isotherms to be determined per year was considered and for the LHS rent, a maximum number of 120 isotherms per year was considered. A – Scenario for the “cheap”
protein; B – Scenario for the “expensive” protein.
to mention that maintenance costs are not being considered for
this study, which could impact more the yearly equipment costs
of owning the equipment and for renting this would not represent
added costs.
ment. However, the equipment has a high price tag, not affordable
for every lab.
Microfluidics has been taking steps in the field of bioengineering and there are some microfluidics devices that are commercialized (mainly for analytics [14]). At a lower TRL, the microfluidic
chips present, generally, a low level of automation, and on-chip
automation can hinder the versatility of the devices. If the operation of the microchips can have a higher level of automation, the
labor costs can be reduced further. Nevertheless, microfluidics still
offers the highest degree of miniaturization possible, which in the
case of this study, that used an external source for fluid pumping,
still reduced the liquid volume to 56 μl. The tested devices were
used only once, but further testing for the removal of the beads
from inside the channel, by reverse flow, could prove that the de-
3.6. Key features of the different methodologies
LHS remain the status-quo for chromatographic process development for industry and academia. The LHS rely on their high degree of automation and precision and have a higher Technology
Readiness Level than the other two methodologies presented in
this study. Furthermore, and since it has been widely used by industry and academia for more than a decade, there is a wide variety of consumables dedicated to chromatographic process develop9
T.C. Silva, M. Eppink and M. Ottens
Journal of Chromatography A 1681 (2022) 463451
vices are reusable. Since PDMS has a high compatibility with acid
and base, the microfluidic chip can be cleaned with most solutions
used for the removal of proteins and regeneration of chromatographic resins. The use of solvents may pose a problem for PDMS,
as these can react with PDMS (e.g. acetone). However, using lower
concentrations of these solves (e.g. 70% v/v EtOH) for short periods of time should be sufficient for the intended purpose and still
safe to the PDMS chip. Using different materials for the microfluidic chip (e.g. glass or quartz) would also improve the microchip’s
mechanical and chemical resistance.
If the devices can be reused, it would help to reduce the labor
costs. Furthermore, a common approach for microfluidics is parallelization, which for this case could also be an interesting option,
provided that a system could be designed to allow this. Microfluidics is still trying to pave the way into HTS for chromatographic
processes and the high skill required to design and produce the
designs makes it a less attractive alternative. This could be overcome with outsourcing and mass production of the devices or by
finding alternative production techniques (like 3D printers).
Of all the methodologies in this work, Eppendorfs proved to
be the one with the lowest level of automation. The need to prepare all the solutions by hand, removal of supernatant and subsequent dilution in the UV-plate (when needed) required tremendous amounts of pipetting, leading to lengthy runs in the lab and
tedious and cumbersome work. However, it made up by being the
methodology with the most easily accessible materials (which are
common in every lab) and the lowest equipment costs of the three
methodologies.
sired total use, investing in one can be the best option. However,
if no intensive studies are needed year-round, renting a LHS can
be a viable option and the most cost-competitive (Fig. 8). Although
the Eppendorf studies showed a good cost performance, the experimental work involved in the isotherm studies does not allow for
a good throughput and more workers would be needed.
Of the three methodologies, Eppendorfs are the least attractive but could still be used for lower throughputs if companies or
academia are not willing to invest in a LHS or the microfluidic chip.
For intensive studies on protein adsorption isotherms, the LHS is
still the best option, since an increase in throughput (if needed)
does not directly translate in an increase in labor. On the other
hand, if the studied protein is very expensive and/or the amount of
material is very low (e.g. due to low expression levels or in early
stages of process development), the proposed microfluidic chip, in
its current TRL stage, is an attractive alternative to the LHS. Further
studies and improvements in the microfluidic chip production and
possible parallelization could increase the competitiveness of the
microfluidic chip, even for studies involving cheaper samples. This
study showed that the microfluidic chip was able to generate protein adsorption isotherms using a fraction of the materials required
by other methodologies.
4. Conclusions
CRediT authorship contribution statement
Lysozyme and mAb adsorption isotherms were successfully determined using three different methodologies: microfluidic chip,
Liquid-Handling Station, and Eppendorf tubes. An in-house designed and produced microfluidic chip showed comparable results to the other two methodologies. Inline monitoring of the absorbance of the protein solution allowed the microfluidics setup to
estimate the time to equilibrium required for the different systems.
This can be especially relevant when systems that are not reported
in the literature are studied (e.g., the mAb used in this study), thus
allowing for saving time and material for such study in a LHS. Industry perceives microfluidics as a viable option to contribute to
HTPD [31], and our study showed that microfluidics can compete
with the status-quo of HTPD for chromatography.
For the correct estimation of adsorbed protein, accurate protein
concentration in the liquid phase is needed (usually achieved by
using spectrophotometry) as well as accurate resin volume determination. For the latter, devices for the generation of resin plugs
are used for the LHS (and the same device was used for the Eppendorf experiments in this study), but microfluidics resin volume
determination was often imprecise [18] or cumbersome [17]. By
implementing the Image Analysis in our studies, we were able to
accurately estimate the resin volume in each microfluidics experiment.
The microfluidic chip allowed to perform protein adsorption
studies to chromatographic resin using only 200 nl of resin and
with a total system volume of 56 μl. This represents a 100-fold
reduction in resin and a 15-fold reduction in solution. Such large
reductions in material and sample proved to be advantageous
when considering the cost of isotherm studies for expensive proteins. However, the large labor costs meant that it was not costcompetitive when cheap proteins were studied. Of the three methods used, microfluidics presents the lowest TRL. Further studies
could help increase automation of the proposed system, thus reducing labor costs of microfluidics. The large level of automation
offered by LHS is still very attractive, and depending on the de-
Tiago Castanheira Silva: Conceptualization, Methodology, Software, Validation, Formal analysis, Investigation, Writing – original
draft, Visualization. Michel Eppink: Conceptualization, Resources,
Writing – review & editing. Marcel Ottens: Conceptualization, Resources, Supervision, Writing – review & editing, Funding acquisition.
Declaration of Competing Interest
The authors declare that they have no known competing financial interests or personal relationships that could have appeared to
influence the work reported in this paper.
Acknowledgements
This work has received funding from the European Union’s
Horizon 2020 research and innovation program under the Marie
Skłodowska-Curie grant agreement No 812909 CODOBIO, within
the Marie Skłodowska-Curie International Training Networks
framework.
References
[1] A.L. Grilo, A. Mantalaris, The increasingly human and profitable monoclonal
antibody market, Trends Biotechnol. 37 (1) (2019) 9–16, doi:10.1016/j.tibtech.
2018.05.014.
[2] G. Jagschies, E. Lindskog, K. Lacki, P.M. Galliher, Biopharmaceutical Processing:
Development, Design, and Implementation of Manufacturing Processes, Elsevier, 2018, doi:10.1016/C2014- 0- 01092- 1.
[3] K.M. Łacki,
˛
High throughput process development in biomanufacturing, Curr.
Opin. Chem. Eng. 6 (2014) 25–32, doi:10.1016/j.coche.2014.08.004.
[4] A.T. Hanke, M. Ottens, Purifying biopharmaceuticals: knowledge-based chromatographic process development, Trends Biotechnol. 32 (4) (2014) 210–220,
doi:10.1016/j.tibtech.2014.02.001.
[5] A.A. Shukla, J. Thömmes, Recent advances in large-scale production of monoclonal antibodies and related proteins, Trends Biotechnol. 28 (5) (2010) 253–
261, doi:10.1016/j.tibtech.2010.02.001.
´ A. van der Padt, M. Jacobs, M. Ottens, Model-based high[6] B.K. Nfor, J. Ripic,
throughput process development for chromatographic whey proteins separation, Biotechnol. J. 7 (10) (2012) 1221–1232, doi:10.10 02/biot.20120 0191.
[7] J.F. Kramarczyk, B.D. Kelley, J.L. Coffman, High-throughput screening of chromatographic separations: II. Hydrophobic interaction, Biotechnol. Bioeng. 100
(4) (2008) 707–720, doi:10.1002/bit.21907.
[8] D.L. Wensel, B.D. Kelley, J.L. Coffman, High-throughput screening of chromatographic separations: III. Monoclonal antibodies on ceramic hydroxyapatite,
Biotechnol. Bioeng. 100 (5) (2008) 839–854, doi:10.1002/bit.21906.
10
T.C. Silva, M. Eppink and M. Ottens
Journal of Chromatography A 1681 (2022) 463451
[9] G. Carta, A. Jungbauer, Protein Chromatography: Process Development and
Scale-up, John Wiley & Sons, 2020, doi:10.1002/9783527630158.
[10] C. Chang, A.M. Lenhoff, Comparison of protein adsorption isotherms and uptake rates in preparative cation-exchange materials, J. Chromatogr. A 827 (2)
(1998) 281–293, doi:10.1016/S0 021-9673(98)0 0796-1.
[11] J. Kittelmann, M. Ottens, J. Hubbuch, Robust high-throughput batch screening
method in 384-well format with optical in-line resin quantification, J. Chromatogr. B 988 (2015) 98–105, doi:10.1016/j.jchromb.2015.02.028.
[12] B.K. Nfor, M. Noverraz, S. Chilamkurthi, P.D. Verhaert, L.A. van der Wielen,
M. Ottens, High-throughput isotherm determination and thermodynamic modeling of protein adsorption on mixed mode adsorbents, J. Chromatogr. A 1217
(44) (2010) 6829–6850, doi:10.1016/j.chroma.2010.07.069.
[13] A. Creasy, G. Barker, Y. Yao, G. Carta, Systematic interpolation method predicts protein chromatographic elution from batch isotherm data without a
detailed mechanistic isotherm model, Biotechnol. J. 10 (9) (2015) 1400–1411,
doi:10.1002/biot.201500089.
[14] T.C. Silva, M. Eppink, M. Ottens, Automation and miniaturization: enabling
tools for fast, high-throughput process development in integrated continuous
biomanufacturing, J. Chem. Technol. Biotechnol. (2021), doi:10.1002/jctb.6792.
[15] N. Field, S. Konstantinidis, A. Velayudhan, High-throughput investigation of
single and binary protein adsorption isotherms in anion exchange chromatography employing multivariate analysis, J. Chromatogr. A 1510 (2017) 13–24,
doi:10.1016/j.chroma.2017.06.012.
[16] L.J. Millet, J.D. Lucheon, R.F. Standaert, S.T. Retterer, M.J. Doktycz, Modular microfluidics for point-of-care protein purifications, Lab Chip 15 (8) (2015) 1799–
1811, doi:10.1039/C5LC0 0 094G.
[17] H.S. Rho, A.T. Hanke, M. Ottens, H. Gardeniers, A microfluidic device for the
batch adsorption of a protein on adsorbent particles, Analyst 142 (19) (2017)
3656–3665, doi:10.1039/c7an00917h.
[18] I.s.F. Pinto, R.R. Soares, S.A. Rosa, M.R. Aires-Barros, V. Chu, J.o.P. Conde,
A.M. Azevedo, High-throughput nanoliter-scale analysis and optimization of
multimodal chromatography for the capture of monoclonal antibodies, Anal.
Chem. 88 (16) (2016) 7959–7967, doi:10.1021/acs.analchem.6b00781.
[19] M.N. São Pedro, A.M. Azevedo, M.R. Aires-Barros, R.R. Soares, Minimizing the
influence of fluorescent tags on IgG partition in PEG–salt aqueous two-phase
systems for rapid screening applications, Biotechnol. J. 14 (8) (2019) 1800640,
doi:10.10 02/biot.20180 0640.
[20] J. Romanowska, D.B. Kokh, R.C. Wade, When the label matters: adsorption of
labeled and unlabeled proteins on charged surfaces, Nano Lett. 15 (11) (2015)
7508–7513, doi:10.1021/acs.nanolett.5b03168.
[21] Y. Xia, G.M. Whitesides, Soft lithography, Ann. Rev. Mater. Sci. 28 (1) (1998)
153–184, doi:10.1146/annurev.matsci.28.1.153.
[22] A. Kecskemeti, A. Gaspar, Particle-based liquid chromatographic separations in
microfluidic devices - a review, Anal. Chim. Acta 1021 (2018) 1–19, doi:10.1016/
j.aca.2018.01.064.
[23] J.P. Kutter, Liquid phase chromatography on microchips, J. Chromatogr. A 1221
(2012) 72–82.
[24] E. Sollier, C. Murray, P. Maoddi, D. Di Carlo, Rapid prototyping polymers for
microfluidic devices and high pressure injections, Lab Chip 11 (22) (2011)
3752–3765.
[25] T.E. Bankston, M.C. Stone, G. Carta, Theory and applications of refractive indexbased optical microscopy to measure protein mass transfer in spherical adsorbent particles, J. Chromatogr. A 1188 (2) (2008) 242–254, doi:10.1016/j.chroma.
2008.02.076.
[26] F. Dismer, M. Petzold, J. Hubbuch, Effects of ionic strength and mobile phase
pH on the binding orientation of lysozyme on different ion-exchange adsorbents, J. Chromatogr. A 1194 (1) (2008) 11–21, doi:10.1016/j.chroma.2007.12.
085.
[27] A. Gökaltun, Y.B.A. Kang, M.L. Yarmush, O.B. Usta, A. Asatekin, Simple surface modification of poly (dimethylsiloxane) via surface segregating smart
polymers for biomicrofluidics, Sci Rep 9 (1) (2019) 1–14, doi:10.1038/
s41598- 019- 43625- 5.
[28] C. Her, L.M. Tanenbaum, S. Bandi, T.W. Randolph, R. Thirumangalathu,
K.M. Mallela, J.F. Carpenter, Y. Elias, Effects of tubing type, operating parameters, and surfactants on particle formation during peristaltic filling pump
processing of a mAb formulation, J. Pharm. Sci. 109 (4) (2020) 1439–1448,
doi:10.1016/j.xphs.2020.01.009.
[29] N. Deiringer, W. Friess, Proteins on the rack: mechanistic studies on protein
particle formation during peristaltic pumping, J. Pharm. Sci. (2022), doi:10.
1016/j.xphs.2022.01.035.
[30] M.I. Aladul, R.W. Fitzpatrick, S.R. Chapman, Impact of infliximab and etanercept biosimilars on biological disease-modifying antirheumatic drugs utilisation and NHS budget in the UK, BioDrugs 31 (6) (2017) 533–544, doi:10.1007/
s40259- 017- 0252- 3.
[31] M.N. São Pedro, T.C. Silva, R. Patil, M. Ottens, White paper on high-throughput
process development for integrated continuous biomanufacturing, Biotechnol.
Bioeng. 118 (9) (2021) 3275–3286, doi:10.1002/bit.27757.
11