Bayesian optimization using multiple directional objective functions allows the rapid inverse fitting of parameters for chromatography simulations
Bạn đang xem bản rút gọn của tài liệu. Xem và tải ngay bản đầy đủ của tài liệu tại đây (2.69 MB, 16 trang )
Journal of Chromatography A 1679 (2022) 463408
Contents lists available at ScienceDirect
Journal of Chromatography A
journal homepage: www.elsevier.com/locate/chroma
Bayesian optimization using multiple directional objective functions
allows the rapid inverse fitting of parameters for chromatography
simulations
Ronald Colin Jäpel a , Johannes Felix Buyel a,b,∗
a
b
Fraunhofer Institute for Molecular Biology and Applied Ecology IME, Forckenbeckstrasse 6, Aachen 52074, Germany
Institute for Molecular Biotechnology, RWTH Aachen University, Worringerweg 1, Aachen 52074, Germany
a r t i c l e
i n f o
Article history:
Received 24 April 2022
Revised 27 July 2022
Accepted 29 July 2022
Available online 9 August 2022
Keywords:
Ion-exchange chromatography
Mechanistic model
Numeric optimization
Parameter estimation
Steric mass action (SMA) model
a b s t r a c t
The modeling of chromatographic separations can speed up downstream process development, reducing the time to market and corresponding development costs for new products such as pharmaceuticals.
However, calibrating such models by identifying suitable parameter values for mass transport and sorption is a major, time-consuming challenge that can hinder model development and improvement. We
therefore designed a new approach based on Bayesian optimization (BayesOpt) and Gaussian processes
that reduced the time required to compute relevant chromatography parameters by up to two orders of
magnitude compared to a multistart gradient descent and a genetic algorithm. We compared the three
approaches side by side to process several internal and external datasets for ion exchange chromatography (based on a steric mass action isotherm) and hydrophobic interaction chromatography (a modified
version of a recently published five-parameter isotherm) as well as different input data types (gradient elution data alone vs gradient elution and breakthrough data). We found that BayesOpt computation
was consistently faster than the other approaches when using either single-core or 12-cores computer
processing units. The error of the BayesOpt parameter estimates was higher than that of the competing
algorithms, but still two orders of magnitude less than the variability of our experimental data, indicating BayesOpts applicability for chromatography modeling. The low computational demand of BayesOpt
will facilitate rapid model development and improvement even for large datasets (e.g., > 100 proteins)
and increase its suitability for research laboratories or small and medium enterprises lacking access to
dedicated mainframe computers.
© 2022 The Authors. Published by Elsevier B.V.
This is an open access article under the CC BY-NC-ND license
( />
1. Introduction
Chromatography is widely used for the purification of biopharmaceutical proteins [1–3] but can be a major cost driver during
production and process development [4]. Such costs can be limited
by the model-driven optimization of chromatographic separation,
which reduces experimental screening to the most relevant operational conditions. Modeling can also improve process understanding and can facilitate adaptive process control [5].
Chromatography models often consist of a mass transport component that can be simulated using the general rate model [6,7]
and an adsorption component, describing protein interaction with
∗
Corresponding author at: Institute for Molecular Biotechnology, RWTH Aachen
University, Worringerweg 1, Aachen 52074, Germany.
E-mail address: (J.F. Buyel).
a stationary phase, using isotherms such as the steric mass action (SMA) model [8]. Both components require the calibration of
several parameter values so that the model results match the experimental data. However, current calibration algorithms, such as
multistart gradient descent, genetic algorithms and Markov chain
Monte Carlo, require extensive computational time to identify appropriate sets of parameter values. This is a bottleneck hindering
the widespread application of model-based process development
because the necessary computational infrastructure is often available only to specialized research facilities or large companies. Accordingly, research laboratories as well as small and medium enterprises would be empowered to use chromatography modeling
tools if the computational time could be reduced. This could be
achieved by combining Gaussian processes (GP) and Bayesian optimization (BayesOpt).
/>0021-9673/© 2022 The Authors. Published by Elsevier B.V. This is an open access article under the CC BY-NC-ND license ( />
R.C. Jäpel and J.F. Buyel
Journal of Chromatography A 1679 (2022) 463408
A GP is a likelihood distribution over functions covering (multiple) continuous dimensions, such that every collection of values
drawn from the GP is a multivariate Gaussian distribution [9,10].
In GP regression, a GP can be used to approximate an unknown
function by estimating the expected function values and the associated uncertainties based on a (small) set of known data points
in the parameter space. During BayesOpt, GP regression can therefore be used to identify extrema of unknown functions, which are
called objective functions in this context. First, a GP is fitted to a
set of initial data points, i.e. parameter combinations at which the
objective function has been evaluated. Then the mean and variance predicted by the GP for each point in the parameter space
are combined using an acquisition function to select the next point
at which the objective function should be evaluated [11]. The acquisition function can balance exploitation, i.e. focusing parameter
improvement near the current optimal region, and exploration, i.e.
focusing on regions of the objective function where uncertainty is
high and global optima might be hidden.
We reasoned that BayesOpt can therefore be applied to the inverse fitting of chromatography parameters to be used in simulations in a multi-step process. First, one or more objective functions
are defined that can capture the performance of a parameter fit.
For example, the time offset between the maxima of an experimentally determined protein elution peak and the corresponding
simulated peak can reveal how well the parameters of the underlying model were estimated (e.g., isotherm and mass transport parameters). These objective functions are then evaluated for an initial set of points distributed across the parameter search space.
In the context of chromatography, an objective function evaluation is equivalent to simulating protein binding and elution and
each point of evaluation corresponds to a combination of parameter value estimates for isotherm and mass transport. Then, a GP
is created for each objective function and each GP is fitted to the
initial set of evaluation results. Thereafter, the mean and variance
estimates of the GPs are combined in a single acquisition function and a new set of parameter values is selected to be evaluated
next. The resulting new values of the objective functions (e.g., the
offset between the experimental and simulated peak maxima) are
then added to the data collection available to the respective GPs,
the mean and variance estimates are updated and used to choose
the next combination of chromatography parameter for evaluation
through simulation.
This BayesOpt procedure has been shown to be advantageous
over other regression methods and converges to the global optimum faster than these if a set of prerequisites is met [12,13].
Specifically, (i) there are few data points available because the creation of data (i.e., objective function evaluation, here: simulating
a chromatographic separation) is time consuming, (ii) estimates of
uncertainty are of interest, and/or (iii) the shape of the objective
functions are unknown but their smoothness is similar in all dimensions [11]. In contrast, the performance of BayesOpt may suffer
if (i) the number of data points increases because the computation
of the GPs scales with O(n³), and/or (ii) if the objective functions
are not smooth or their smoothness varies locally [14].
Here we present a novel method for the calibration of chromatography models using GPs. Specifically, we propose three new
approaches for BayesOpt to mitigate the performance issues that
arise if the objective function is not smooth, has regions varying
in smoothness, or if large numbers of data points must be considered simultaneously. First, we developed the concept of directional
objective functions. Second, we aggregated multiple directional objective functions into a combined objective function. Third, we incorporated dimensional trimming to reduce the calculation time as
the number of data points in the GP increases. We applied these
approaches to the simultaneous determination of mass transport
and isotherm parameters in the context of protein chromatography
simulations. As an isotherm, we used either the well-established
steric mass action (SMA) model for ion exchange chromatography
[8] or a novel isotherm for hydrophobic interaction chromatography (HIC).
2. Materials and methods
2.1. Computational hardware
All computations were run on Intel Xeon E5-2630 v3 computer
processing units (CPUs) with 3.5 GB random access memory (RAM)
per CPU core.
2.2. Chromatography simulations
All chromatography simulations were computed using CADET
software [15,16,34,35]. We compiled the binaries based on CADET
release 3.1.2, adding a hydrophobic interaction isotherm modified
from the original version [17]. Individual simulations were set
up in CADET as a three-unit-operation model comprising the inlet, column and outlet. Target chromatograms were generated in
CADET using the parameter values specified in Table S1. The calculated protein concentration at the outlet unit (mol per cubic meter over time) was saved to ∗ .csv files. The CADETMatch package
v0.6.23 (commit 873a81c3b6f593313212c243018b7e5122d770c3)
obtained from />was the latest available version at the time of this study and was
used to handle genetic algorithm parameter fitting and multistart
gradient descent parameter fitting [18,17]. Hyper-parameters for
these algorithms were taken from the examples distributed with
CADETMatch in the “Example 2” folder. The dextran example from
the same source was used for the non-pore-penetrating tracer
datasets, the NonBindingProtein example was used for the porepenetrating tracer datasets, and the Isotherm example was used for
the SMA datasets. For HIC parameter fitting, the hyper-parameters
from the “Example 2/Isotherm” example were used with a genetic
algorithm generation-population size of 50 instead of 20, based on
the software creator’s advice.
We maintained two separate conda virtual environments for (i)
our BayesOpt and gradient descent algorithms as well as (ii) the
CADETMatch package to prevent package conflicts. All calculations
were started in the BayesOpt virtual environment. For CADETMatch
evaluations, we used the Popen class of the subprocess module to
start a new process in which we activated the second environment
and ran the CADETMatch calls in that process. The additional overhead time (∼0.2 s) was subtracted from all CADETMatch results
before comparing the performance with other algorithms.
2.3. Algorithm performance comparison
Algorithm performance was compared based on (i) duration, (ii)
the parameter estimation error calculated as the Euclidian distance
of fitted-to-target parameter values in a normalized (0–1) multiparameter space, and (iii) the relative sum squared error (rSSE) of
a simulation using the fitted parameter values compared to the target curves. The rSSE was calculated by taking the sum of squared
errors (SSEs) and dividing it by the total sum of squares (TSS) of
the target curve Eqs. (1)–(3).
rSSE =
SSE
T SS
(1)
n
SSE =
(yi − yi )2
(2)
(yi − 0 )2
(3)
i=0
n
T SS =
i=0
2
R.C. Jäpel and J.F. Buyel
Journal of Chromatography A 1679 (2022) 463408
ˆ represents the simulaWhere y represents the target values and y
tion results using the fitted parameter values for all n data points.
The sample size n ranged from 206 to 20,001 depending on the
simulation.
Dividing SSE by TSS compensated for differences in signal scale
between the elution and breakthrough experiments. From this
point onward, SSE always refers to the sum of squared errors between a target chromatogram and a simulated chromatogram.
2.6. Calculation of objective functions
The agreement between simulated and target chromatograms
was quantified using three case-dependent objective functions.
Tracers and gradient elution peaks were assessed based on (i)
the retention time difference between the peaks, (ii) the height
difference at peak maximum, and (iii) the peak skew difference
(Fig. 1A). The retention time difference was evaluated by calculating the cross correlation between the target peak and the simulated peak using scipy.signal.correlate [20]. The offset with the
highest correlation coefficient was used as the time difference as
previously explained [18,19].
The height difference was calculated using Eq. (9):
2.4. Example isotherms for performance testing
Ion exchange chromatography was simulated using the SMA
isotherm [8,15,16] that describes the change in protein bound to
the stationary phase dqi over time dt while accounting for the salt
concentration, number of protein–ligand interactions and shielded
binding sites Eqs. (4) and (5).
dqi
ν
= ka,i c p,i (q¯ 0 ) i − kd,i qi csνi
dt
Ncomp −1
q¯ 0 =
−
νj + σj qj
height = (max(ytarget ) − max(ysim ) )/max(ytarget )
(4)
where max(ysim ) is the maximum value of the simulated peak and
max(ytarget ) is the maximum value of the target peak. The peak
skew was calculated by first treating peaks as probability distributions, dividing them by the area under the curve and then applying
Eq. (10):
(5)
skew = (μ − ν )/σ
j=1
dqi
ν
= keq,i c p,i (q¯ 0 ) i − qi csνi
dt
skew = skewsim − skewtarget
q m
dq
= keq (1 −
) c p − q · 0.1mβ
dt
qmax
(6)
= (ttarget − tsim )/ttarget
(12)
where
is the value of the objective function, ttarget is the metric
for the target chromatogram (e.g., the time taken to reach 50% of
the maximum concentration) and tsim is the same metric for the
simulated chromatogram. The independent variables of all objective functions were scaled to [-1,1] using Eq. (13) to improve the
numerical stability of the algorithms.
(7)
where m is the number of binding sites and β is the number of
bulk-like water molecules that stabilize all m binding sites. The parameter β is calculated using Eq. (8):
β = β0 exp(β1 cs )
(11)
Breakthrough curves were compared based on (i) the difference
in the maximum concentration, (ii) the difference in the time required to reach 50% of the maximum concentration, and (iii) the
difference in the time required to increase from 50% to 98% maximum concentration (Fig. 1B). All three values were calculated as
percent differences relative to the target chromatograms Eq. (12).
For the simulation of HIC, a previously described isotherm
[17] was modified (Eq. (7)) to enable its integration into the CADET
framework, which will be published separately.
kkin
(10)
where μ is the distribution mean, ν is its median and σ is the
standard deviation. The difference in skewness was calculated as
the skew of the simulated chromatogramminus the skew of the
target chromatogram as shown in Eq. (11):
where t is the time, qi is the concentration of the ith protein bound
to the stationary phase, ka,i is the adsorption constant of the i-th
protein, cp,i is the soluble concentration in the particle pores of the
ith protein, q̅0 is the number of free binding sites on the stationary
phase, ν i is the characteristic charge of the ith protein, kd,i is the
desorption constant of the ith protein, cs is the salt concentration
in the mobile phase,
is the total ionic capacity of the stationary
phase, and σ i is the shielding (steric) factor of the i-th protein.
It is useful to divide Eq. (5) by kd and define ka /kd as keq and
the reciprocal of kd as kkin , which results in Eq. (6):
kkin,i
(9)
x =
x
(|x| + 1 )
(13)
where x’ is the scaled independent variable of an objective function
and x is the original unscaled variable. The source code is available
on github ( />
(8)
where β 0 is the number of bulk-like water molecules at infinite
dilution and β 1 is a scaling factor that describes the influence of
the salt concentration on the number of bulk-like water molecules.
2.7. Calculation of GPs in Python
2.5. Statistical testing
We
used
the
GaussianProcessRegressor
class
from
sklearn.gaussian_process to calculate all GPs [21]. To aggregate
multiple objective functions, we modified a previously published
[22] BayesOpt algorithm by overwriting its BayesianOptimization
class with a class that can handle multidimensional objective
functions. This new class was created to hold a GP for each
objective function while exposing only a single GP fit and a single
GP predict method. Python’s duck-typing allows for the new class
to seamlessly replace the regular GaussianProcessRegressor class
from sklearn.gaussian_process. We also extended the new class to
allow the transformation of the independent variable (x) space
to a unit hypercube, which improves the numeric stability as
discussed above. The rational quadratic kernel was chosen for
all subsequent optimizations because it generated the highest
log marginal likelihood compared to all other available kernels,
All groups of replicated results were assessed for normality using a Shapiro–Wilk test (α ≤ 0.05) as computed with
scipy.stats.shapiro [20]. Normally distributed data were analyzed using a two-sample, two-sided Welch’s t-test computed
with scipy.stats.ttest_ind, whereas non-normally distributed data
were analyzed using a Kruskal–Wallis H-test computed with
scipy.stats.kruskal (α ≤ 0.05 in both cases). The sample sizes was
n= 6 when comparing durations and n= 12 when comparing
parameter estimation errors. In all figures, asterisks indicate significance: ∗ p ≤ 0.05 (significant), ∗∗ p ≤ 0.01 (highly significant),
∗∗∗ p ≤ 0.001 (most significant). In the figures and tables, a superscript w indicates the application of Welch’s t-test whereas a superscript k indicates the application of the Kruskal–Wallis H-test.
3
R.C. Jäpel and J.F. Buyel
Journal of Chromatography A 1679 (2022) 463408
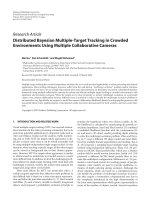
Fig. 1. Graphical representation of the six objective functions used to assess the quality of chromatographic simulation results, specifically the coincidence of experimental
and simulated (gradient elution) peaks and breakthrough curves. A. Gradient elution peaks were compared based on differences in peak retention time, peak height and
skew. B. Breakthrough curves were compared based on the difference in the maximum concentration peak height, the time to reach 50% of that concentration, and the time
required to increase from 50% to 98% of the maximum concentration.
as calculated using the log_marginal_likelihood method of the
GaussianProcessRegressor class of the scikit-learn python package
[21] on several sample datasets [23,24]. This is desirable because the log marginal likelihood describes the probability of the
observed data given the assumed model, i.e., kernel.
rameters (Section 4.2). The “IEX Preliminary test” dataset was used
as a reference task (Table S1). Non-significant parameters were
eliminated from the model by automated backwards selection using a p-value threshold of 0.05. The final model achieved an R² of
0.699, an adjusted R² of 0.694 and a predicted R² of 0.688, indicating a suitable model quality (Table S2). Numerical minimization of
the response (computational time) resulted in the optimal parameter settings shown in Table 1.
2.8. Hyperparameter optimization
Hyperparameters (Table 1) for the dimensional trimming algorithm (Section 3.4) were optimized using an I-optimal design of
experiments (DoE) approach with 382 runs of third-order polynomial complexity built in Design-Expert v13 [25]. DoE parameter ranges were chosen based on a set of scouting and screening
experiments (data not shown) and the response was the computational time required by BayesOpt to estimate all SMA isotherm pa-
2.9. Testing BayesOpt with experimental chromatography data
Exocellobiohydrolase 1 (CBH1; UniProt ID P62694) derived
from Trichoderma reesei preparation Celluclast 1.5 (Novozymes A/S,
Bagsværd, Denmark) was purified from a 1:20 v v−1 dilution with
equilibration buffer (25 mM sodium phosphate, pH 7.5). Purifi4
R.C. Jäpel and J.F. Buyel
Journal of Chromatography A 1679 (2022) 463408
Table 1
DoE for hyperparameter optimization of dimensional trimming applied during BayesOpt.
Parameter [-]
Symbol [-]
Type [-]
Minimum [-]
Maximum [-]
Predicted optimum [-]
Number of initial candidate points
Number of search points
Starting value of the exploration-exploitation factor κ
Best point threshold
ncp
nsp
Numeric
Numeric
Numeric
Numeric
1.0
5.0
0.0
1.0
5.0
105.0
1.0
9.0
1.0
19.0
0.0
7.0
κ start
nbp
3. Theory and calculation
cation was performed using a 46 mL Q Sepharose HP XK26/20
Column (GE Healthcare, Chicago, USA) mounted to an ÄKTA pure
25 M system (Cytiva, Marlborough, USA). The column was equilibrated with five column volumes (cv) of equilibration buffer, followed by loading 0.2 L (∼5 cv) of the Celluclast dilution. We
then applied 5 cv of equilibration buffer for washing followed by
a step-wise elution (25 mM sodium phosphate 1.0 M sodium chloride (∼50 mS cm−1 ), pH 7.5), including elution steps at 23.0, 26.0,
and 50.0 mS cm−1 . The flow rate was 10.0 mL min−1 (11.6 m h−1 )
and 4.0 mL fractions were analyzed by lithium dodecylsulfate polyacrylamide gel electrophoresis (LDS-PAGE) [26,1]. Fractions containing CBH1 were pooled and had a purity of 98% as per densitometric analysis. The pooled sample was buffer exchanged into
sample buffer (25 mM sodium phosphate, 25 mM sodium chloride, pH 7.0, 7.00 mS cm−1 ) using Vivaspin filter (Sartorius, Göttingen, Germany) and the CBH1 concentration was 3.78 mg L−1
based on a microtiter-plate Bradford assay (Thermo Fisher Scientific Inc., USA) [27,2]. We loaded 1.0 or 35.2 mL of purified CBH1
for gradient elution and frontal experiments respectively using a
1 mL Q Sepharose HP pre-packed column (Cytiva) mounted to a
dedicated ÄKTA pure 25 L system (Cytiva). The column had been
equilibrated for 10 cv in the modeling equilibration buffer (25 mM
sodium phosphate, 25 mM sodium chloride, pH 7.0) before sample loading and was washed for 5 cv using the same buffer after
sample loading. Linear gradient elutions of CBH1 were carried out
over 5, 30 or 120 cv up to 100% elution buffer (25 mM sodium
phosphate, 500 mM sodium chloride, pH 7.0). Protein elution was
monitored as ultraviolet light adsorption at 280 nm. The flow rate
was 0.50 mL min−1 (7.80 m h−1 ) at all times.
The resulting chromatograms were preprocessed by removing
the salt-induced drift in the UV measurements. A linear correlation
between the UV adsorption and the conductivity signal was estimated based on the data points during the wash steps both before
and after the gradient elutions. Based on this correlation, the UV
signal was corrected for each data point based on the conductivity
measured at that point. An exponentially modified Gaussian distribution Eqs. (14) and (15) [28,3] was fitted to the chromatogram to
remove noise and impurities from the signal.
f (x; h,
x−μ 2
μ, σ , τ ) = h · e−0.5( σ )
x−μ
σ π
1 π
·
· erfcx √
−
τ 2
σ
2 τ
erfcx(x ) = exp x
2
2 ∞
2
· √ ∫ e −θ d θ
π
3.1. Directional objective functions
As stated above, BayesOpt performs best using smooth objective
functions. The objective function most often chosen for the inverse
fitting of chromatography models is a minimization of the SSE of
the protein elution concentration profile between the experiment
and the simulation [19]. The SSE objective function has multiple
localminima and multiple abrupt changes in slope. For example,
running simulations with varying keq and a true keq of 1.00 (other
parameters follow the “IEX Preliminary test” in Table S1) resulted
in a local minimum of SSE at a keq of 10−4 and a sharp drop towards the global keq minimum at 1.00 (Fig. 2A and D; note the
log10 scale of the x-axis). Accordingly, the SSE objective function is
not well suited for BayesOpt.
Alternatively, the absolute value (i.e., the magnitude) of the
time difference between the simulated and target peak may be
used to assess the quality of fitted parameter values (Fig. 2B and
E). This function contains only a single global minimum to which
minimizing algorithms will converge regardless of the starting conditions. However, the function cannot be differentiated in that minimum, which is characterized by an abrupt change in slope. This
property compromises the objective function’s smoothness and
thus impedes the performance of GPs, as discussed above.
In contrast, the actual value of the time offset forms a smooth
objective function (Fig. 2C and F) and has the additional benefit of
providing information whether a simulated peak appears “earlier”
or “later” than the target peak with the optimum being zero. Here,
we introduce the term ‘directional objective function’ for objective
functions whose optimum is zero and that yield suboptimal values in both the negative and positive number space. Hence, they
provide additional information showing in which direction a parameter value should be modified for optimization. However, directional objective functions introduce a computational challenge
because their optimum is not a minimum or maximum and thus
cannot be identified effectively using any optimizer available to
use. A new optimization algorithm is therefore required to identify the optimum, specifically the parameter value(s) that optimize
the agreement between simulated and experimental data. Therefore, we developed an option to construct such an algorithm.
(14)
3.2. Adapting the acquisition function to directional objective
functions
(15)
x
During BayesOpt, an acquisition function is used to choose the
next point in the parameter space for evaluation using the objective function(s). Common examples include the upper confidence
bound, the expected improvement, and the probability of improvement [11]. The probability of improvement is the likelihood that
the objective function at a point in the parameter space that has
previously not been evaluated will yield a better parameter value
estimate than the best value known up to that iteration in the optimization process. The expected improvement quantifies the result by multiplying the likelihood by the relative improvement that
can be gained compared to the previous optimum. Both probability
Where x is the retention time, f(x) is the UV signal, μ is the
mean of the Gaussian component, σ is the standard deviation of
the Gaussian component, h is the height of the Gaussian component, τ is exponent relaxation time, θ is the pseudo variable over
which erfcx is integrated and erfcx is the scaled complementary
error function.
The distribution parameters were estimated using the curve_fit
method from scipy.optimize [20]. The resulting distribution was
used as a concentration profile and was subjected to the same parameter fitting described for synthetic data above.
5
R.C. Jäpel and J.F. Buyel
Journal of Chromatography A 1679 (2022) 463408
Fig. 2. Objective functions for parameter estimation and their approximations using a Gaussian process during Bayesian optimization with SMA parameter keq as an example.
A and D. Sum squared error (SSE) between the elution concentration profiles of simulated and target peaks. B and E. Absolute value of the relative time difference between
the simulated and target peaks. C and F. Relative time difference between the simulated and target peaks. The top row represents the beginning of the parameter fitting
when coverage of the parameter space is sparse (four data points), whereas the bottom row represents a state close to the end of the optimization with nine data points
(including three close to the optimum) added to the Gaussian processes.
functions return zeros for large fractions of the parameter space if
BayesOpt is close to completion (i.e., the actual optimum), because
the probabilities of improvement in certain regions approach zero.
Specifically, the ratio of the GP uncertainty to the objective function’s output range becomes very small. Accordingly, the function
in these regions does not have a slope that would point to the
optimum, which is therefore difficult to identify at this stage because new points for evaluation are identified inefficiently. In contrast, the upper confidence bound does not suffer from this limitation because it returns non-zero values even within undesirable
regions. We therefore used the upper confidence bound as an acquisition function for the BayesOpt algorithm but replaced its default formula (Eq. (16)) with the one of the lower confidence bound
(LCB) as shown in Eq. (17), which allowed us to construct the objective functions as minimization tasks (Section 2.6).
f ( μ, σ ) = μ + σ · κ
(16)
f ( μ, σ ) = μ − σ · κ
(17)
its experimental counterpart. Using the absolute value of the GP
mean would create a minimum at the optimal function value but
this absolute value function cannot be differentiated when the dependent variable is zero, effectively impeding the performance of
the gradient-based local optimization of the acquisition function.
We therefore approximated the absolute value function by Eq. (18),
which is differentiable in each point and has a maximum deviation
from the true absolute value of 5 × 10⁻⁹ . This difference was considered negligible because the range of the objective functions was
scaled to span from –1.0 to 1.0 in order to maximize the numerical
stability of the algorithm (see above).
f ( μ, σ ) =
μ2
μ2 + 10−8
− σ · κ ≈ |μ| − σ · κ
(18)
We chose not to transform the standard deviation of the objective functions into the statistically correct folded normal distribution because the latter compromised key aspects of the acquisition
function when the normal distribution’s range crossed below zero.
Specifically, regions with high uncertainty were deemed less favorable for exploration by the acquisition function when using the
folded normal distribution, effectively contradicting the purpose of
exploration (Fig. 3A). Instead, we used the untransformed uncertainty of the objective function(s). Even though this caused some
results to predict negative error values that should be impossible
in theory (Fig. 3, shaded areas below zero), the acquisition function successfully chose the expected locations of interest and the
algorithm converged to the correct parameter values.
where μ is the mean of the GP, σ is the GP standard deviation
and κ is the exploration–exploitation tradeoff factor, with high values of κ favoring the exploration of regions with high uncertainties
over regions close to the values currently yielding the best results
with respect to the objective function(s). However, in the form of
Eq. (17), the mean GP value can be negative for sub-optimal parameter conditions, e.g. a simulated peak appearing earlier than
6
R.C. Jäpel and J.F. Buyel
Journal of Chromatography A 1679 (2022) 463408
Fig. 3. Evaluation of the lower confidence bound (LCB) acquisition function in three scenarios of Gaussian processes (GP) using either an untransformed uncertainty (normal
distribution, green) or the formally correct folded normal distribution (orange). A. Scenario with a constant mean (blue line) and varying uncertainty (shaded area). The
LCB with a folded normal distribution disregards regions of high uncertainty in the GP and is therefore not useful to identify the next parameter value to be evaluated. B.
Scenario with a varying mean and constant uncertainty. Both acquisition functions correctly identify the location where the next parameter values should be evaluated. C.
Scenario with a varying mean and varying uncertainty. The minimum of the LCB with unmodified uncertainty (normal distribution) is closer to where the mean approaches
zero than the minimum of the LCB with folded normal distribution. Note that a scenario with constant mean and constant uncertainty is not shown because the GP starts
after an initial iteration has been performed and there is a non-uniform prior of the objective function.
3.3. Multiple objective functions and their aggregation
ple directional objective functions can resolve this ambiguity when
multiple parameters need to be optimized at the same time, which
is the case for an SMA isotherm, especially when mass transport is
also considered.
We therefore built a new optimizer that maintains individual
GPs for each objective function and combines all GP estimates of
the objective functions into a single, aggregated objective function
during the evaluation step performed by the acquisition function.
We selected the arithmetic mean to aggregate the individual objective functions (Eq. (19)), with the option to add weightings to
A single directional objective function is typically capable of
identifying an optimum for only a single independent parameter to
be fitted. However, when multiple parameter values need to be optimized, a single directional objective function will probably result
in a set of indistinguishable optima: instead of a single root (intersection with the objective function at zero value) there will be a
line or area of roots in the multi-dimensional parameter space for
which the objective function adopts a zero value. Combining multi-
7
R.C. Jäpel and J.F. Buyel
Journal of Chromatography A 1679 (2022) 463408
the individual objective functions present in the code but unused
for the results in this paper (Eq. (20)). For example, the weightings
can help to fine-tune the fitting process, for example by placing
emphasis on peak height and skew over retention time (Fig. 1).
Similarly, alternative aggregation functions may also be used to introduce a weighting between individual directional objective functions, such as the geometric mean or the harmonic mean.
f (x ) =
1
n
n
x2i
x2i + 10−8
i=1
f (w, x ) =
1
n
n
i=1
≈
1
n
best data points were identified, where np is the number of parameters to be fitted, and the boundaries of the parameter space
were shrunk to the ranges spanned by these points. Thereafter, the
procedure entered the next iteration until a termination-threshold
score of 0.005 was achieved, which was equivalent to an average
error of 0.5% across the multiple objective functions. This threshold
can be reduced if higher precision is required at the cost of longer
computation times. Alternative termination criteria may be specified, such as a fixed number of CADET evaluations. The method
can rapidly shrink the parameter space in the case of simple optima (Fig. 5). Should multiple local optima exist for one or several
of the parameters to be fitted, the range of the corresponding parameter(s) will shrink only as far as possible while still including
these optima.
n
|xi |
(19)
i=1
(wi · xi )2
(wi · xi )2 + 10−8
≈
1
n
n
|wi · xi |
(20)
i=1
Where f(x) is the aggregated objective function, n is the number
of individual objective functions to be aggregated, xi is the value of
the ith objective function and wi is the weighting assigned to the
i-th objective function.
An estimate of the combined uncertainty of the aggregated objective function is also required to solve the acquisition function
(Eq. (18)). Calculating this uncertainty in a closed form was impractical, because the form depends on the number of objective
functions involved and would require adaptation if the number
and/or nature of the functions change. Estimating the combined
uncertainty using a Monte Carlo method instead [29] increased the
calculation costs about 40-fold (data not shown). Therefore, the individual standard deviations were combined using the rules of error propagation (Eq. (21)), which can also be adapted to the use of
weightings (Eq. (22)).
f (σ ) =
n
i=1
σi2
3.5. Algorithm termination condition
We chose a stall threshold of less than stall (here 0.001) improvement over nstall data points with respect to the combined
score functions to define a termination criterion for the algorithm.
As the score functions were formulated as percentage differences
between the target values and the simulated values, a delta of
0.001 corresponded to an error of 0.1%, which we deemed acceptable. For nstall we chose nsp , the number points determined for the
dimensional shrinking section. As a result, if an entire iteration of
the dimensional shrinking procedure elapses without further improvement, the algorithm ended as it had most likely converged to
the best possible solution given the respective data input.
4. Results and discussion
(21)
n
4.1. Inverse fitting of transport and porosity parameter values
f (w, σ ) =
n
i=1
( w i · σi )
2
n
Transport parameters and porosities must be determined to set
the boundary conditions for the modeling of packed-bed chromatography columns [31]. We assumed that experimental conditions such as the column length and volumetric flow rate would be
known. We used the lumped rate model with pores to fit values for
the column porosity (i.e., inter-particle porosity), particle porosity
(i.e., intra-particle porosity), axial dispersion coefficient, and film
diffusion coefficient [7,32]. We used two types of input data to fit
these mass transport parameters: (i) non-pore-penetrating tracer
data to determine the column porosity and the axial dispersion
coefficient, and (ii) pore-penetrating tracer data to determine the
particle porosity and the film diffusion coefficient. For subsequent
experiments to determine the transport parameters, the adsorption
constant ka was set to zero to eliminate interactions between the
components and the stationary phase. For the experiments with
non-pore-penetrating tracers, the particle porosity and film diffusion were also set to zero.
We compared the performance of BayesOpt, a multi-start gradient descent algorithm, and a genetic algorithm using four datasets
(Figs. 6A, S1, Table S4) that captured the variability of singleprotein peak shapes that we have previously encountered during
the determination of SMA parameters [33]. If restricted to one CPU
core, BayesOpt was on average 15 % faster than the multi-start gradient descent algorithm and 4.3-fold faster than the genetic algorithm (Fig. 6B). When parallelizing over 12 CPU cores, the BayesOpt
algorithm was on average 37 % slower than gradient descent and
7 % faster than the genetic algorithm (Fig. 6C). Overall, the time
required for BayesOpt calculations was less than 5 min and was
thus compatible with model updating on a daily basis even for
large collections of chromatography data featuring more than 100
individual calculations, for example representing different proteins
and chromatography conditions. The parameter estimation error in
(22)
Where n is the number of individual objective functions with uncertainties to be aggregated and σ i is the standard deviation of the
ith objective function.
3.4. Dimensional trimming
As described in the introduction, a caveat of BayesOpt is the
increasing computational cost of the fitting and evaluation of GPs
as the number of data points increases. For example, the time required to fit and evaluate the GPs for each search step compared to
the time required for the CADET simulations during each step increased substantially over the course of parameter estimation runs
(Fig. 4A and B). Therefore, it would take more time to compute the
parameter values used to execute the next chromatography simulation using CADET than to conduct that simulation. We therefore
modified our algorithm to trim down the parameter dimensions
after a certain number of GP evaluation steps, effectively limiting
the duration of GP computation (Fig. 4C and D).
The trimming procedure (Fig. 5) used a pre-optimized set of
hyperparameters (Table 1, Section 2.8) and started by filling the
parameter space with an initial set of candidate points (ncp ) to
be evaluated using CADET. These points were distributed throughout the parameter space using the Enhanced Stochastic Evolutionary algorithm from the python surrogate modeling toolbox (SMT)
package, which produces low-discrepancy Latin hypercube sampling distributions [30]. Once these points had been evaluated by
CADET, BayesOpt used the GP estimates to select a fixed number of search points (nsp ) with κ decreasing from a starting value
(kstart ) to zero, effectively shifting the focus from exploration to exploitation during search point selection. Thereafter, the np × nbp
8
R.C. Jäpel and J.F. Buyel
Journal of Chromatography A 1679 (2022) 463408
Fig. 4. Computation time required for chromatography parameter estimation and its dependence on isotherm complexity and the size of the parameter search space. A. SMA
parameter estimation (ka , kd , ν and σ ) and the resulting change in duration of CADET and GP computation times using a fixed parameter space throughout the process. B.
HIC parameter estimation (keq , kkin , m, β 0 and β 1 ) and the resulting change in duration of CADET and GP computation times using a fixed parameter space throughout the
process. C. As in A, but including a dimensional trimming step for the GP. D. As in B, but including a dimensional trimming step for the GP. The trimming procedure (Fig. 5)
causes abrupt changes in the GP duration of operation in panels C and D.
the BayesOpt method was at least 100-fold lower than the standard deviation of the same parameters in replicated experiments
[33] (Table S3). Overall, we deemed the BayesOpt error acceptable for the estimation of transport parameters in chromatography
models, even though it was significantly (p ≤ 0.001) higher than
the multi-start gradient descent error for all datasets except the
external pore-penetrating dataset (Fig. 6D).
sults because the actual parameter values of real proteins are unknown. However, we can compare the standard deviations of the
parameter estimates, produced by the algorithms on artificial data,
to the standard deviation of the same parameters obtained from
replicated experiments. We found that at worst the standard deviation of BayesOpt (4.14 × 10⁻³ , n= 12) was ‘only’ two orders of magnitude lower than the experimental standard deviation
obtained for ribulose-1,5-bisphosphate carboxylase-oxygenase (RuBisCO) (7.21 × 10⁻¹ , n= 3) on 1 mL Q Sepharose HP column fitted
by gradient descent (Table S5). Therefore, the error introduced by
BayesOpt was only 0.6% of the experimental uncertainty, which we
consider acceptable. Furthermore, the differences between the predicted and target chromatograms were marginal in all cases (Figs.
S2–S5). Therefore, we deemed BayesOpt suitable for the estimation
of SMA parameters in chromatography models based on combined
breakthrough and gradient elution data but concede that multistart gradient descent and the genetic algorithm can achieve higher
parameter certainties.
4.2. Inverse fitting of SMA isotherm parameter values
Calibrating an SMA model based on experimental data can be
achieved by (i) estimating ka , kd , ν and σ based on gradient elution
and a breakthrough data, or (ii) estimating keq (i.e., the ratio of ka
and kd ) and ν based on several gradient elutions [8,31]. When testing the three algorithms on in silico generated datasets in the first
scenario (gradient elution and breakthrough data, Fig. 7), we found
that convergence was achieved on a single CPU core on average
∼12-fold faster using BayesOpt compared to the multistart gradient descent algorithm and ∼22-fold faster compared to the genetic
algorithm (Fig. 7C, Table S6). When parameter fitting was executed
on 12 CPU cores in parallel, BayesOpt was still 3-fold faster than
the multi-start gradient descent algorithm and 4-fold faster than
the genetic algorithm (Fig. 7D).
Similarly to the results for the transport parameters, BayesOpt
generated higher parameter estimation errors and larger rSSE values compared to the multistart gradient descent algorithm on all
datasets except for the external dataset (Fig. 7E and F). We cannot compare the parameter estimation errors to experimental re-
4.3. Inverse fitting of SMA isotherm parameters keq and ν based on
gradient elution data
More than 500 mg of pure protein is typically required for
breakthrough curve experiments [33], which is difficult to obtain
during early downstream process development. Because the information derived from these curves (i.e., an estimate of σ and thus
column capacity) is not usually required at that development stage,
estimating keq (i.e., the ratio of ka and kd ) and ν based on gradient
9
R.C. Jäpel and J.F. Buyel
Journal of Chromatography A 1679 (2022) 463408
Fig. 5. Graphical representation of the steps in the algorithm used for dimensional trimming. A. An initial set of candidate points (ncp ) is distributed throughout the
parameter space using the Enhanced Stochastic Evolutionary algorithm. B. GP estimates are used to select additional search points (nsp ), initially focusing on exploration –
the sampling of high-uncertainty regions in the parameter space. C. By iteratively reducing the exploration–exploitation factor κ for each search point, GP selections favor
exploitation (i.e., investigate regions close to the current optimum) in the course of search point selection. D. The top np × nbp points in terms of the objective function
value are identified to form the basis of a new parameter range, where np is the number of parameters to be optimized and nbp is the best point threshold. E. The parameter
range spanned by the np × nbp points is used to define new boundaries for the values of the parameters to be fitted. F–H. The new boundaries are applied and the search
is reiterated until a termination condition is reached (see Section 3.5). Each dot in the panels represents an aggregated objective function score for a given set of parameter
values (e.g., SMA parameters). Objective function scores were calculated as described in Section 2.6 and aggregated as described in Section 3.3.
elution experiments alone is another relevant task in chromatography modeling. We evaluated all three algorithms on three in silico
datasets using three elution curves of 5, 30 and 120 column volumes (cv) each (Fig. 8). The external dataset was not used because
it contained only a single gradient elution profile. On a single CPU
core, we found that BayesOpt was on average 25.0-fold faster than
the multi-start gradient descent algorithm and 37.9-fold faster than
the genetic algorithms. On 12 CPU cores, BayesOpt was on average
∼7-fold faster than both alternative algorithms (Table S7).
As before, the peak shapes of the simulated and target chromatograms were very similar for all approaches (Figs. S6–S8), even
though BayesOpt had significantly (p ≤ 0.001) higher parameter estimation errors and rSSE values compared to the gradient descent
algorithm on two of the three in silico datasets and significantly
lower (p ≤ 0.001) errors on the internal dataset 3. The variability
introduced by BayesOpt never exceed 1.3% of the standard deviation of the parameter values experimentally determined by replicated measurements (Table S5). We therefore considered BayesOpt
10
R.C. Jäpel and J.F. Buyel
Journal of Chromatography A 1679 (2022) 463408
Fig. 6. Performance of transport parameter estimations for three inverse fitting algorithms using non-binding tracer experiments. Algorithm performance was evaluated on
two datasets (internal and external) each for non-pore-penetrating tracers to determine the column porosity and column dispersion, as well as pore-penetrating tracers to
determine the particle porosity and film diffusion. A. In silico target chromatograms representing the target curves to be fitted based on representative parameter values
(Table S1). B. Violin plots of the duration of the inverse fitting calculation using a single CPU core (n= 6). C. As in B, but for parallel computing on 12 CPU cores. D. Violin
plot of the parameter estimation error after fitting, calculated as the Euclidean distance between the true and fitted parameter values in a normalized four-dimensional
(inter-particle porosity, intra-particle porosity, axial dispersion coefficient, and film diffusion coefficient) parameter space (n= 12). E. Violin plot of the sum squared error
(SSE) between the target and fitted chromatograms divided by the sum squared total of the target chromatogram, yielding the relative SSE (rSSE) (n= 12). Asterisks in B–E
indicate significance: ∗ p ≤ 0.05, ∗ ∗ p ≤ 0.01, ∗ ∗ ∗ p ≤ 0.001. Superscript w indicates the use of Welch’s test whereas superscript k indicates the use of the Kruskal–Wallis H-test
to assess statistically significant differences. The violin plot whisker bars show the full range of the distribution, and the width of the shaded area shows the distribution
density.
11
R.C. Jäpel and J.F. Buyel
Journal of Chromatography A 1679 (2022) 463408
Fig. 7. SMA parameter (ka , kd , ν and σ ) estimation performance of three inverse fitting algorithms using a gradient elution and a breakthrough curve. Algorithm performance
was measured over four reference datasets differing in column dimensions and flowrates (external data vs internal data) as well as the corresponding SMA binding parameters
(different for all datasets) (Table S1). A. In silico as well as experimental target chromatograms of gradient elutions for each of the five datasets using a representative gradient
length of 30 cv. B. Breakthrough curves of the datasets as in A C. Violin plot of the duration of the inverse fitting calculation using a single CPU core (n= 6). D. As in C,
but using 12 CPU cores in parallel. E. Violin plot of the parameter estimation error calculated as the Euclidean distance between the true and fitted parameter values in a
normalized four-dimensional parameter space (n= 12). F. Violin plot of the sum squared error (SSE) between the target and simulated chromatograms divided by the sum
squared total of the target chromatogram yielding the relative SSE (rSSE) (n= 12). Asterisks in B–E indicate significance: ∗ p ≤ 0.05, ∗ ∗ p ≤ 0.01, ∗ ∗ ∗ p ≤ 0.001. Superscript w
indicates the use of Welch’s test whereas superscript k indicates the use of the Kruskal–Wallis H-test to assess statistically significant differences. The violin plot whisker
bars show the full range of the distribution, and the width of the shaded area shows the distribution density.
12
R.C. Jäpel and J.F. Buyel
Journal of Chromatography A 1679 (2022) 463408
Fig. 8. SMA parameter (keq and ν ) estimation performance of three inverse fitting algorithms using data based on three elution gradients of 5, 30 and 120 column volumes
(cv). The performance of each algorithm was determined using three datasets, which differed in their transport parameters (Table S1). A. In silico as well as experimental
target chromatograms for each of the three datasets calculated for a 30 cv gradient. B. Violin plot of the duration of the inverse fitting calculation using a single CPU core
(n= 6). C. As in B, but using 12 CPU cores in parallel. D. Violin plot of the parameter estimation error calculated as the Euclidean distance between the true and fitted
parameter values in a normalized two-dimensional parameter space (n= 12). E. Violin plot of the sum squared error (SSE) between the target and simulated chromatograms
divided by the sum squared total of the target chromatogram yielding the relative SSE (rSSE) (n= = 12). Asterisks in B–E indicate significance: ∗ p ≤ 0.05, ∗ ∗ p ≤ 0.01,
∗∗∗
p ≤ 0.001. Superscript w indicates the use of Welch’s test whereas superscript k indicates the use of the Kruskal–Wallis H-test to assess statistically significant differences.
The violin plot whisker bars show the full range of the distribution, and the width of the shaded area shows the distribution density.
13
R.C. Jäpel and J.F. Buyel
Journal of Chromatography A 1679 (2022) 463408
Fig. 9. HIC binding parameter (keq , kkin , m, β 0 and β 1 ) estimation performance of three inverse fitting algorithms based on data from three gradient elutions over 5, 30 and
120 column volumes (cv) as well as a breakthrough curve. The performance of each algorithm was determined on one dataset, which was generated using the only binding
parameter combination we could find that allowed precise parameter identification (Table S1). A. In silico target chromatogram calculated for a 30 cv gradient. B. In silico
breakthrough curve for an HIC isotherm. C. Violin plot of the duration of the inverse fitting calculation using a single CPU core (n= 6). D. As in C, but using 12 CPU cores in
parallel. E. Violin plot of the parameter estimation error calculated as the Euclidean distance between the true and fitted parameter values in a normalized two-dimensional
parameter space (n= 12). F. Violin plot of the sum squared error (SSE) between the target and simulated chromatograms divided by the sum squared total of the target
chromatogram, yielding the relative SSE (rSSE) (n = 12). Asterisks in C–F indicate significance: ∗ p ≤ 0.05, ∗ ∗ p ≤ 0.01, ∗ ∗ ∗ p ≤ 0.001. Superscript w indicates the use of Welch’s
test whereas superscript k indicates the use of the Kruskal–Wallis H-test to assess statistically significant differences. The violin plot whisker bars show the full range of the
distribution, and the width of the shaded area shows the distribution density.
14
R.C. Jäpel and J.F. Buyel
Journal of Chromatography A 1679 (2022) 463408
suitable to estimate SMA binding parameters for chromatography
models based on multiple gradient elution data.
5. Conclusions
We have developed a new algorithm for chromatography parameter fitting using a Bayesian optimization approach. The fitting
of all transport and SMA isotherm parameters based on three gradient elutions or a gradient and a breakthrough curve was ∼10fold faster with BayesOpt than a gradient descent algorithm using
a single CPU core (46 min vs 478 min). This improvement in speed
is particularly relevant if multiple calculations must be carried out
in parallel on a single computer, for example when fitting parameters for multiple proteins (as would be required to simulate the behavior of a crude host cell protein mixture containing a product).
Although the speed of BayesOpt was partially offset by a higher
variability of the parameter estimates, it was nevertheless two orders of magnitude lower than the variability in replicate experimental measurements indicating that the fitting quality was sufficient for applications such as predicting the separation of protein
mixtures during in silico process development. In this context, we
have not observed relevant solution instabilities using isotherms of
the SMA and HIC complexity. However, if the number of parameters and proteins to be fitted simultaneously were to be increased
in future model setups, the condition of the optimization problem
will require re-examination to ensure BayesOpt can be applied successfully. Specifically, BayesOpt can be more demanding in terms
of the mathematical problem being well conditioned as discussed
above [12,13]. For example, if the slope around the optimum of the
objective function is shallow and in the same order of magnitude
as the termination threshold of the algorithm, the latter may prematurely terminate in a region that is not as close to the actual
optimum as it should be.
An additional benefit of BayesOpt is that it provides estimates
of the relevant ranges for the fitted chromatography parameters,
e.g. for isotherms, thus facilitating an analysis about the reliability
of the corresponding model predictions.
The current BayesOpt algorithm was optimized to estimate
chromatography parameters based on experimental data obtained
with pure compounds (e.g., purified proteins). The next step is
therefore to expand the approach and apply it to parameter estimation based on multicomponent competitive binding experiments. The same applies to handling combined breakthrough and
gradient elution data as inputs for the program. Further tuning
may also be required to deal with heavily tailing peaks (e.g., for experiments with dextran) as well as the automated pre-processing
of experimental data (e.g., smoothing) as described in [19]. In this
context, further testing BayesOpt with experimental data containing various degrees of noise will be important. Like a genetic algorithm, BayesOpt returns an estimate of the influence of the fitted parameters over all objective functions and across the entire
parameter space, whereas gradient descent returns only a single
optimum. Combined with the short computation time, BayesOpt
is a valuable tool for the screening of parameter space, providing
insights into the influence of parameters on the experimental results. BayesOpt will be especially rewarding when handling large
datasets (e.g., > 100 proteins).
4.4. Preliminary verification of BayesOpt performance on
experimental data
Testing BayesOpt on synthetic data in silico (Sections 4.1 to 4.3)
was necessary to obtain absolute performance measures, i.e. compare the results achieved by the algorithm with those from competing approaches against known target values, e.g. for isotherm
parameters, which are unknown for experimental data. However,
experimental data contain several ‘features’ that potentially interfere with a smooth execution of parameter fitting and that can
therefore deteriorate the performance under authentic conditions.
For example, noise, drift and shift in the (UV) signal of a chromatogram can reduce the fidelity of an exponentially-modified
Gauss fit, which is often used to approximate an experimental elution peak before starting the actual mass transport and isotherm
parameter fitting [33]. Furthermore, impurities such as aggregates,
degradation products or other proteins can cause peak shoulders,
tailing and fronting additionally aggravating the aforementioned
problem.
Because the types and manifestations of such noise features are
diverse, an exhaustive assessment of the performance of BayesOpt
on experimental data is beyond the scope of this study. Here, we
have limited our testing of BayesOpt using experimental input data
to CBH1 as a representative protein in terms of peak shape based
on our current experience. We find that the duration of BayesOpt
for the fitting of all SMA binding parameters was 44.4 ± 15.7 min
(± standard deviation; n= 6) using 1 CPU core (Fig. 7). This was
∼7-times faster than multi-start gradient descent and ∼11-times
faster than a genetic algorithm. The fitting of only keq and ν took
24.4 ± 6.7 min (n = 6) using 1 CPU core (Fig. 8). This was ∼2times faster than multi-start gradient descent and ∼60-times faster
than a genetic algorithm. Furthermore, we found that BayesOpt
converged consistently with a small variability in the fitted chromatography parameters (Table S5) and reached significantly lower
rSSE results than both other algorithms (Figs. 7F and 8E as well
as Figs. S9 and S10). We concluded that, based on the limited data
tested so far, BayesOpt can successfully identify isotherm and mass
transport parameters using experimental input data.
4.5. Inverse fitting of HIC isotherm parameters
In contrast to the SMA isotherm, the modified (Eq. (7)) HIC
isotherm used binding parameters keq , kkin , m, β 0 and β 1 [17].
Here, we estimated the five parameters based on three gradient elutions and one breakthrough curve (Fig. 9). Due to time
constraints the multi-start gradient descent and the genetic algorithm could not be evaluated on a single CPU core for datasets
2 and 3 and will only be compared to BayesOpt on the 12 CPU
core setup. When using 12 CPU cores, BayesOpt accelerated the
calculation by 6.0-fold compared to the multi-start gradient descent algorithm and 4.0-fold compared to the genetic algorithm
on average over three in silico datasets (Fig. 9C and D, Table S8).
For datasets 1 and 3, there were no visible difference between
the simulated and target chromatograms (Fig. S9) for the three
methods, despite BayesOpt resulting in significantly (p ≤ 0.001)
higher parameter estimation errors compared to the other algorithms. On dataset 2, multi-start gradient descent failed to converge on the global optimum during all iterations, which causes
the high parameter estimation error and rSSE results (Fig. 9E and F,
Figs. (S11–13)
Consent for publication
All authors have seen a draft version of the manuscript and
concur with its submission.
Data availability statement
The data that support the findings of this study are available
from the corresponding author upon reasonable request.
15
R.C. Jäpel and J.F. Buyel
Journal of Chromatography A 1679 (2022) 463408
Funding
[14] J. Mockus, Bayesian Approach to Global Optimization: Theory and Applications,
Springer Science & Business Media, 1989.
[15] S. Leweke, E. von Lieres, Chromatography analysis and design toolkit (CADET),
Comput. Chem. Eng. 113 (2018) 274–294, doi:10.1016/j.compchemeng.2018.02.
025.
[16] E. von Lieres, J. Andersson, A fast and accurate solver for the general rate
model of column liquid chromatography, Comput. Chem. Eng. 34 (2010) 1180–
1191, doi:10.1016/j.compchemeng.2010.03.008.
[17] G. Wang, T. Hahn, J. Hubbuch, Water on hydrophobic surfaces: mechanistic
modeling of hydrophobic interaction chromatography, J. Chromatogr. A 1465
(2016) 71–78, doi:10.1016/j.chroma.2016.07.085.
[18] W. Heyman, CADET-Match, 2019. />commit a5e89cab3304d8a4f158cd826144948490e0be30 (accessed 3 May
2019).
[19] W. Heymann, J. Glaser, F. Schlegel, W. Johnson, P. Rolandi, E. von Lieres, Advanced score system and automated search strategies for parameter estimation in mechanistic chromatography modeling, J. Chromatogr. A 1661 (2022)
462693, doi:10.1016/j.chroma.2021.462693.
[20] P. Virtanen, R. Gommers, T.E. Oliphant, M. Haberland, T. Reddy, D. Cournapeau,
E. Burovski, P. Peterson, W. Weckesser, J. Bright, S.J. van der Walt, M. Brett,
J. Wilson, K.J. Millman, N. Mayorov, A.R.J. Nelson, E. Jones, R. Kern, E. Larson, C.J. Carey, Polat, VanderPlas, Jake, D. Laxalde, J. Perktold, R. Cimrman,
I. Henriksen, E.A. Quintero, C.R. Harris, A.M. Archibald, A.H. Ribeiro, F. Pedregosa, P. van Mulbregt, SciPy 1.0 Contributors, SciPy 1.0: fundamental algorithms for scientific computing in Python, Nat. Methods 17 (2020) 261–272,
doi:10.1038/s41592- 019- 0686- 2.
[21] F. Pedregosa, G. Varoquaux, A. Gramfort, V. Michel, B. Thirion, O. Grisel,
M. Blondel, P. Prettenhofer, R. Weiss, V. Dubourg, J.erplas V, A. Passos, D. Cournapeau, M. Brucher, M. Perrot, E. Duchesnay, SciKit-learn: machine learning in
Python, J. Mach. Learn. Res. 12 (2011) 2825–2830.
[22] F. Nogueira, Bayesian optimization: open source constrained global optimization tool for Python, 2014. />commit 8ce2292895137477963cf1bafa4e71fa20b2ce49 (accessed 3 May 2019)
[23] A.B. Abdessalem, N. Dervilis, D.J. Wagg, K. Worden, Automatic kernel selection
for gaussian processes regression with approximate Bayesian Computation and
Sequential Monte Carlo, Front. Built Environ. 3 (2017) 52, doi:10.3389/fbuil.
2017.0 0 052.
[24] D. Duvenaud, J.R. Lloyd, R. Grosse, J.B. Tenenbaum, Z. Ghahramani, Structure
discovery in nonparametric regression through compositional kernel search,
in: Proceedings of the 30th International Conference on Machine Learning,
2013.
[25] , Design-Expert, 11, Stat-Ease Inc., 2018.
[26] M. Knödler, C. Rühl, P. Opdensteinen, J.F. Buyel, Activated cross-linked agarose
for the rapid development of affinity chromatography resins –antibody capture
as a case study, J. Vis. Exp. (2019), doi:10.3791/59933.
[27] J.F. Buyel, R. Fischer, Scale-down models to optimize a filter train for the downstream purification of recombinant pharmaceutical proteins produced in tobacco leaves, Biotechnol. J. 9 (2014) 415–425, doi:10.10 02/biot.20130 0369.
[28] R. Delley, Series for the exponentially modified Gaussian peak shape, Anal.
Chem. 57 (1985) 388, doi:10.1021/ac00279a094.
[29] R.Y. Rubinstein, D.P. Kroese, Simulation and the Monte Carlo Method, 3rd ed.,
Wiley Publishing, 2016.
[30] M.A. Bouhlel, J.T. Hwang, N. Bartoli, R. Lafage, J. Morlier, J.R. Martins, A Python
surrogate modeling framework with derivatives, Adv. Eng. Softw. 135 (2019)
102662, doi:10.1016/j.advengsoft.2019.03.005.
[31] K. Frank, C.R. Bernau, J.F. Buyel, Spherical nanoparticles can be used as nonpenetrating tracers to determine the extra-particle void volume in packed-bed
chromatography columns, J. Chromatogr. A 1675 (2022) 463174, doi:10.1016/j.
chroma.2022.463174.
[32] A. Felinger, G. Guiochon, Comparison of the kinetic models of linear chromatography, Chromatographia (2004) 60, doi:10.1365/s10337- 004- 0288- 7.
[33] C.R. Bernau, R.C. Jäpel, J.W. Hübbers, S. Nölting, P. Opdensteinen, J.F. Buyel,
Precision analysis for the determination of steric mass action parameters using eight tobacco host cell proteins, J. Chromatogr. A 1652 (2021) 462379,
doi:10.1016/j.chroma.2021.462379.
[34] A. Püttmann, S. Schnittert, S. Leweke, E. von Lieres, Utilizing algorithmic differentiation to efficiently compute chromatograms and parameter sensitivities,
Chem. Eng. Sci. 139 (2016) 152–162, doi:10.1016/j.ces.2015.08.050.
[35] A. Püttmann, S. Schnittert, U. Naumann, E. von Lieres, Fast and accurate parameter sensitivities for the general rate model of column liquid chromatography,
Comput. Chem. Eng. 56 (2013) 46–57, doi:10.1016/j.compchemeng.2013.04.021.
This work was funded in part by the Fraunhofer-Gesellschaft
through grant 125-600164 and the state of North-Rhine-Westphalia
grant number 423.
Declaration of Competing Interest
The authors have no conflict of interest to declare.
CRediT authorship contribution statement
Ronald Colin Jäpel: Investigation, Conceptualization, Data curation, Writing – review & editing. Johannes Felix Buyel: Investigation, Formal analysis, Writing – original draft, Funding acquisition.
Acknowledgements
We wish to thank Dr. Richard M Twyman for editorial assistance and William Heymann for assistance with the implementation of the genetic algorithm.
Supplementary materials
Supplementary material associated with this article can be
found, in the online version, at doi:10.1016/j.chroma.2022.463408.
References
[1] R. Freitag, Chromatographic techniques in the downstream processing of proteins in biotechnology, Methods Mol. Biol. 1104 (2014) 419–458, doi:10.1007/
978- 1- 62703- 733- 4_25.
[2] L. Hagel, G. Jagschies, G.K. Sofer, Handbook of Process Chromatography: Development, Manufacturing, Validation and Economics, 2nd ed, Academic, London,
2008.
[3] G. Carta, A. Jungbauer, Protein Chromatography: Process Development and
Scale-Up, Wiley-VCH, Weinheim, 2010.
[4] J.F. Buyel, R. Fischer, A juice extractor can simplify the downstream processing of plant-derived biopharmaceutical proteins compared to blade-based homogenizers, Process Biochem. 50 (2015) 859–866, doi:10.1016/j.procbio.2015.
02.017.
[5] F. Steinebach, M. Angarita, D.J. Karst, T. Müller-Späth, M. Morbidelli, Model
based adaptive control of a continuous capture process for monoclonal antibodies production, J. Chromatogr. A 1444 (2016) 50–56, doi:10.1016/j.chroma.
2016.03.014.
[6] H. Schmidt-Traub, Preparative Chromatography of Fine Chemicals and Pharmaceutical Agents, Wiley-VCH, Weinheim, Great Britain, 2005.
[7] G. Guiochon, D.G. Shirazi, A. Felinger, A.M. Katti, Fundamentals of Preparative
and Nonlinear Chromatography, 2nd ed., Academic Press, Boston, 2006.
[8] C.A. Brooks, S.M. Cramer, Steric mass-action ion exchange: displacement profiles and induced salt gradients, AIChE J. 38 (1992) 1969–1978, doi:10.1002/aic.
690381212.
[9] C.E. Rasmussen, C.K.I. Williams, Gaussian Processes for Machine Learning, MIT
Press, 2006.
[10] N. Quadrianto, K. Kersting, Z. Xu, C. Sammut, G.I. Webb, Gaussian process, in:
Encyclopedia of Machine Learning, Springer US, Boston, MA, 2010, pp. 428–
439, doi:10.1007/978- 0- 387- 30164- 8_324.
[11] F. Archetti, A. Candelieri, Bayesian Optimization and Data Science, Springer International Publishing, Cham, 2019, doi:10.1007/978- 3- 030- 24494- 1.
[12] J. Mockus, Application of Bayesian approach to numerical methods of global
and stochastic optimization, J. Glob. Optim. 4 (1994) 347–365, doi:10.1007/
BF01099263.
[13] D.R. Jones, A taxonomy of global optimization methods based on response surfaces, J. Glob. Optim. 21 (2001) 345–383, doi:10.1023/A:1012771025575.
16