Recycling gradient-elution liquid chromatography for the analysis of chemical-composition distributions of polymers
Bạn đang xem bản rút gọn của tài liệu. Xem và tải ngay bản đầy đủ của tài liệu tại đây (3.04 MB, 11 trang )
Journal of Chromatography A 1679 (2022) 463386
Contents lists available at ScienceDirect
Journal of Chromatography A
journal homepage: www.elsevier.com/locate/chroma
Recycling gradient-elution liquid chromatography for the analysis of
chemical-composition distributions of polymers
Leon E. Niezen a,b,∗ , Bastiaan B.P. Staal c , Christiane Lang c , Harry J.A. Philipsen d ,
Bob W.J. Pirok a,b , Govert W. Somsen b,e , Peter J. Schoenmakers a,b
a
Analytical Chemistry Group, van ’t Hoff Institute for Molecular Sciences, Faculty of Science, University of Amsterdam, Science Park 904, Amsterdam, XH
1098, The Netherlands
Centre for Analytical Sciences Amsterdam (CASA), The Netherlands
c
BASF SE, Carl-Bosch-Strasse 38, Ludwigshafen am Rhein 67056, Germany
d
DSM Engineering Materials B.V., Urmonderbaan 22, Geleen, RD 6167 The Netherlands
e
Division of Bioanalytical Chemistry, Amsterdam Institute of Molecular and Life Sciences, Vrije Universiteit Amsterdam, Amsterdam, The Netherlands
b
a r t i c l e
i n f o
Article history:
Received 31 May 2022
Revised 13 July 2022
Accepted 27 July 2022
Available online 28 July 2022
Keywords:
Gradient Recycling
Liquid Chromatography
Gradient elution
Polymer analysis
a b s t r a c t
Synthetic polymers typically show dispersity in molecular weight and potentially in chemical composition. For the analysis of the chemical-composition distribution (CCD) gradient liquid chromatography
may be used. The CCD obtained using this method is often convoluted with an underlying molecularweight distribution (MWD). In this paper we demonstrate that the influence of the MWD can be reduced
using very steep gradients and that such gradients are best realized utilizing recycling gradient liquid
chromatography (LC LC). This method allows for a more-accurate determination of the CCD and the
assessment of (approximate) critical conditions (if these exist), even when high-molecular-weight standards of narrow dispersity are not readily available. The performance and usefulness of the approach is
demonstrated for several polystyrene standards, and for the separation of statistical copolymers consisting of styrene/methyl methacrylate and methyl methacrylate/butyl methacrylate. For the latter case, approximate critical compositions of the copolymers were calculated from the critical compositions of two
homopolymers and one copolymer of known chemical composition, allowing for a determination of the
CCD of unknown samples. Using this approach it is shown that the copolymers elute significantly closer
to the predicted critical compositions after recycling of the gradient. This is most clear for the lowestmolecular-weight copolymer (Mw = 4.2 kDa), for which the difference between measured and predicted
elution composition decreases from 7.9% without recycling to 1.4% after recycling.
© 2022 The Authors. Published by Elsevier B.V.
This is an open access article under the CC BY license ( />
1. Introduction
Synthetic polymers play an important role in our current society. The use and applications of these materials is widespread;
examples include polyurethane foam cushions, use of aramid in
optical fiber cables and jet engine enclosures, the use of polytetrafluoroethylene in low friction bearings or non-stick pans, and
many more. To continue to develop new products tailored towards
specific applications, the analysis of these materials and their underlying distributions is vital. For homopolymers these include distributions in size or molecular weight (MWD), degree of branching (DBD), functionality-type/end-group (FTD), or molecular architecture (MAD). For copolymers additional distributions in terms of
∗
Corresponding author.
E-mail address: (L.E. Niezen).
chemical composition (CCD) and sequence or block length (BLD)
exist and specific distributions, such as on degree-of-substitution
and/or tacticity are important characteristics of specific types of
polymers. To analyze and understand the relationship between
these distributions and the resulting material properties, typically
some form of liquid chromatography (LC) is utilized [1–5]. One example is size-exclusion chromatography (SEC), which is the current benchmark for the analysis of the MWD and is often coupled to various detectors to provide additional information such as
on the change in average chemical composition across the molecular weight distribution [6,7] or to assess the degree of branching [8]. To determine the CCD there is not a single, generally accepted method. Gradient-elution LC methods, including reversedphase liquid chromatography (RPLC) and normal-phase liquid chromatography (NPLC) are most common, but isocratic LC methods
such as temperature-gradient interaction chromatography (TGIC)
/>0021-9673/© 2022 The Authors. Published by Elsevier B.V. This is an open access article under the CC BY license ( />
L.E. Niezen, B.B.P. Staal, C. Lang et al.
Journal of Chromatography A 1679 (2022) 463386
[9–11], barrier methods such as SEC-gradients (or gradient SEC,
gSEC) [12,13], and thermal field-flow-fractionation (ThFFF) [14] are
also used.
To properly determine the MWD or the CCD, both distributions
must not simultaneously influence the separation. Typically this is
not the case since the retention of a polymer increases approximately exponentially with molecular weight in the case of isocratic LC separations [15–17]. Both the MWD and CCD may be determined by using two-dimensional liquid chromatography (2D-LC)
or comprehensive 2D-LC (LC×LC), which can simultaneously provide information on molar mass and chemical composition distributions if a method such as RPLC is coupled with SEC. However, in
certain cases it can be desirable to have a one-dimensional method
available that can provide information on solely the CCD, as this
avoids the practical complexity of 2D-LC. Currently there are no
easy-to-implement methods that do so, although examples of such
separations exist [18–20]. One approach which may potentially be
applied for this is recycling liquid chromatography (LC LC). This
method, which was introduced several decades ago [21,22], aims
to improve column performance by artificially increasing the column length. Nowadays the method is primarily used for specific
(preparative) purification purposes, but has otherwise mostly been
abandoned as a result of improvements in column and system performance [23–26]. However, the combination of gradient-elution
and LC LC may prove especially beneficial to obtain a separation
less affected by the MWD. This is because it allows for a reduction
of the molecular weight influence through an increase in the gradient steepness, which should reduce the influence of molar mass,
by virtually increasing the column hold-up volume (V0 ) without
being limited by pressure or requiring an increase in column diameter.
Our objective in the present work was to investigate the applicability of gradient elution LC LC for achieving a separation that is
dominated by the CCD, while minimizing the effect of the molecular weight. To lay the foundation for such an approach, several
practical aspects of column selection first needed to be considered
and the approach was tested for narrow polystyrene standards,
which were considered an ideal model system. The ultimate objective was to obtain high-resolution separations of copolymers with
very similar average composition and broad MWD and to clearly
distinguish effects of the CCD and the MWD in the chromatogram.
Challenging samples consisted of two (statistical) styrene/methyl
methacrylate (S/MMA) copolymers and statistical copolymers of
methyl methacrylate and butyl methacrylate (MMA/BMA). With
this work we aim to explore the benefits of LC LC, and to establish when and how the method may be used for the analysis of
synthetic (co-)polymers.
on (or partitioning into) the stationary phase (i.e. liquid adsorption
chromatography (LAC)); iii) the polymer elutes without a significant molecular-weight dependence, often attributed to a balance
between enthalpic adsorption and entropic exclusion (but more
accurately solely the balance between enthalpy and entropy) and
termed liquid chromatography at critical conditions (LCCC) [27–
29]; iv) the polymer does not elute at all. For a homopolymer subjected to LAC the retention factor (k) increases approximately exponentially with molar mass, so that Case ii can easily turn into
Case iv. To avoid this, gradient-elution is generally preferred for the
LAC analysis of high-molecular-weight analytes. In case of a gradient, ϕ increases with time, which typically (if the initial k is sufficiently large) leads to a decrease in k with time [15–17,30–33].
When the initial mobile-phase composition is chosen such that
k is large (kinit > 10) for all analytes and the injection solvent is
not significantly stronger than the starting eluent [34], sample focusing will occur at the top of the column. As the gradient progresses, k decreases and the analyte’s velocity will increase as it is
caught up by the gradient, until it leaves the column. At the time
of leaving the column the local retention factor of the analyte has
become (much) smaller compared to the starting conditions. This
is the main reason why peaks in gradient-elution chromatograms
are much narrower than well-retained peaks in isocratic LC. In addition, peaks may be compressed thanks to the gradient, which
causes the rear of the peak to travel faster than the front [35–37].
However, retention in LAC is also strongly affected by analyte
molecular weight. This causes broad and typically fronting peaks
for polymers with a broad MWD. The ultimate elution pattern of
the polymer depends on the actual gradient program and on the
MWD. To understand the influence of the MWD during gradient
elution, it must be known how the distribution of (local) retention factors vary with the (local) mobile-phase composition. With
this knowledge one can describe the elution behaviour of the polymer distribution in a similar way as for small molecules by solving
the differential gradient Eq. [15–17,28,30–33,38–42]. Many different models have been proposed to describe the variation of the
retention factor with mobile-phase composition [43]. Examples include models that are generally used for small molecules, such as
the log-linear model, commonly referred to as the linear-solvent
strength (LSS) model [16,17,44], quadratic-solvent strength (QSS)
[40] and Neue-Kuss [45] models, but also polymer-specific models that aim to incorporate entropic exclusion effects [28,39]. As
has previously been shown by multiple authors [16,17,39], simpler models such as the LSS model can often adequately describe
the retention of a polymer in gradient-LC, most likely as a result of the typically (very) small range in ϕ across which highmolecular-weight analytes elute with reasonable retention factors
(e.g. 1 < k < 10). When using the log-linear (LSS) model it is assumed that the logarithm of the retention factor varies linearly
with mobile-phase composition,
1.1. Theory
To reduce the influence of a polymer’s molar mass in RPLC,
one must have an indication of how the retention time (tR ) of a
polymer is influenced by its chemical composition and molecular
weight. Under isocratic conditions the retention time increases linearly with the analyte retention factor (k), which is governed by
the distribution equilibrium of the analyte between the stationary and the mobile phase. k varies with the (volume) fraction of
strong solvent in the mobile phase (ϕ ). When the solubility of the
analyte polymer in the mobile phase is not a limiting factor, one
of four situations can occur, namely i) the polymer elutes in order of high to low molecular weight before the void volume of
the column without experiencing any interaction with the stationary phase, and thus eluting primarily based on its hydrodynamic
volume (i.e. size exclusion chromatography (SEC)); ii) the polymer
elutes in order of low to high molecular weight at a volume larger
than the void volume of the column, due to differential adsorption
ln k = ln k0 − Sϕ
(1)
in which k0 is the retention factor extrapolated to ϕ = 0 and S is a
parameter that captures the change in retention with mobile phase
composition. Assuming a linear gradient and taking the above approach to determine the dependence of tR on ϕ (with ϕ = ddtϕ ),
one may define the intrinsic gradient steepness (b, defined as the
rate of change in k during the gradient per volume of mobile phase
passing through the column for a specific analyte). According to
the linear-solvent-strength (LSS) concept of Snyder [44] b is defined as
b=−
d (ln k ) dϕ
t0 = S
dϕ dt
ϕ
V0
=S
VG
ϕ
t0
=S
tG
ϕ
V0
tG F
(2)
where V0 and t0 are the column hold-up volume and time, respectively, ϕ is the composition range spanned by the gradient,
2
L.E. Niezen, B.B.P. Staal, C. Lang et al.
Journal of Chromatography A 1679 (2022) 463386
F is the volumetric flowrate, and tG and VG are the duration and
the volume of the gradient, respectively. Time and volume are related by the flow rate, i.e., t0 = V0 /F and VG = tG F . Therefore, b does
not vary with F at constant VG , but does vary with F at constant
tG . In Eq. 2 S depends on the molecular weight and the chemical composition of the analyte. It has been shown that S increases
with molecular weight for a homologues series [15] and, hence, for
polymers of similar structure/composition.
From isocratic experiments performed on narrow polymer standards it is known that at some particular ϕ (the so-called “critical composition”, ϕcrit ) the influence of the molecular weight may
vanish. At this mobile-phase composition the retention factor k is
identical for all members of a homopolymeric series, irrespective
of molecular weight [27–29]. Unless specific interactions occur, for
example with end groups, the value of k at this critical composition tends to be very small, resulting in elution close to t0 . Performing an isocratic separation at this composition can give insights in end-group and block-length distributions. However, isocratic separations at the critical conditions are difficult to perform
and virtually impossible for separations of (high molecular weight)
copolymers, because ϕcrit strongly depends on the composition of
the copolymer. For statistical copolymers without strongly adsorbing end groups k varies due to chemical composition and molecular weight. For high-molecular-weight molecules S is very large, so
that analyte molecules do not migrate at ϕ values below the critical composition (i.e. weaker solvents). In case of gradient elution,
large analytes are completely retained on the column until the critical composition is reached. If an analyte molecule falls behind, it
will catch up due to SEC effects; if it were to run ahead, it would
immediately stop migrating, because of the weaker solvent composition. Hence, all high-molecular-weight components of a series
tend to be focussed at the critical composition.
The LSS model yields a simple approximation for the retention
factor at the moment of elution (ke ),
ke =
k0
bk0 + 1
length to increase V0 would cause an increase in the plate number
and the peak capacity, but is limited by restrictions on the pressure and the analysis time. The above discussion suggests that it
would be highly attractive to achieve the required high (effective)
gradient steepness by increasing V0 through lengthening the column, without increasing the pressure drop. This is exactly what
can be achieved by repeatedly recycling the gradient.
1.2. Summary of potential advantages and disadvantages
In the present work such an LC LC setup is realized by using
a single ten-port valve, which allows for the initially created gradient to be alternated between two columns, increasing the gradient steepness by virtually increasing the column length. LC LC
seems to be an effective method to achieve very small ke values for analytes of divergent molecular weights, while potentially
maintaining a high selectivity with regard to the chemical composition. Furthermore, in LC LC the flow rate does not have to
be reduced, since the increase in (effective) column length does
not result in an increase in pressure. Maintaining a high flow
rate reduces system-induced deformation of a low-volume gradient caused by the mixer and avoids an increase in the dwell time
[46,47]. LC LC is, therefore, expected to be considerably faster than
a non-recycling approach where a low flow rate must be used.
However, LC LC is possibly not without disadvantages. Columninduced gradient deformation caused by adsorption or absorption of mobile-phase components (“solvent de-mixing”) may play
a larger role [48,49], as may a possible build-up of impurities (depending on their retention characteristics). LC LC requires fast column equilibration. This is not expected to be a problem for RPLC,
but it may be for other methods, such as hydrophilic-interaction
liquid chromatography (HILIC) and ion-exchange chromatography
V
(IEC). To remedy this, a larger initial ratio of V0 , so that the graG
dient fills a smaller % of the column and allows for longer equilibration of the stationary phase, would be required. Finally, because very small values of ke are reached at the moment of elution,
extra-column band broadening may become more significant.
(3)
which for very large values of k0 , and not extremely shallow gradients, simplifies to ke = 1b . Because S values are large for highmolecular-weight analytes, b values are also large (Eq. 2) and each
analyte has a similarly small retention factor at the point of elution
(ke ). In contrast, the low-molecular-weight (oligomeric) members
V
have much smaller S values and larger values of ϕ V0 (i.e. steeper
G
gradients) are needed to minimize the effect of molecular weight
on the elution composition (and, thus, on the elution time). For
steep gradients (large values of b) the elution time depends solely
on the chemical composition of the analyte and the selectivity depends primarily on ϕ . All copolymers created from monomers A
and B are expected to elute between the respective critical compositions of the two homopolymers, i.e. ϕcrit, A to ϕcrit,B . The highest chemical selectivity for copolymers with a narrow chemicalcomposition distribution is obtained with steep gradients that span
a narrow range in mobile phase composition ( ϕ ) around the critical point of the copolymer ϕcrit, AB . To compensate for the narrow
2. Experimental
Two different systems (A and B), in two different laboratories
(referred to below as laboratory A and laboratory B), were used
for different parts of this work for comparison and to demonstrate
the transferability of the method. In case the utilized system is not
indicated, system A was used.
2.1. Laboratory A
2.1.1. Equipment and software
System A, located in Germany, consisted of an Acquity Quaternary Solvent Manager, an Acquity Column Heater, an Acquity PDA
Detector, equipped with a pressure-resistant UV cell (up to 413
bar), and an Acquity Sample Manager with flow-through needle
(FTN), all purchased from Waters (Milford, MA, USA). System control and data acquisition was performed using WinGPC software
purchased from PSS Polymer Standards Service GmbH (Mainz, Germany).
range (small ϕ ), V0 must be made high, either by reducing the
G
gradient volume (e.g. by reducing the flow rate, while keeping tG
constant, or by shortening tG ), or by increasing the column volume (V0 ). Reducing the flow rate whilst keeping tG constant implies a reduction of the linear velocity, and an increase in analysis
time. A lower gradient volume also increases the risk of systeminduced gradient deformation, depending on the ratio of the gradiV
ent volume to the system’s dwell volume ( V G ) [46,47]. It is genV
VG
dwell
erally recommended that this ratio ( V
2.1.2. Chemicals and materials
Acetonitrile (ACN, ≥99.9%, LC-MS Grade) was purchased from
Honeywell Research Chemicals (Seelze, Germany) and tetrahydrofuran (THF, 99.9%, Isocratic grade, unstabilized) from Bernd Kraft
(Oberhausen, Germany). Narrow polystyrene standards were obtained from Polymer Standards Service GmbH.
dwell
) should remain around
or above unity. Reducing tG would reduce the analysis time, but
would lead to a decrease in peak capacity. An increase in column
3
L.E. Niezen, B.B.P. Staal, C. Lang et al.
Journal of Chromatography A 1679 (2022) 463386
2.2. Laboratory B
2.4. Data analysis
2.2.1. Equipment and software
System B, located in The Netherlands, included a (G1322A)
1100 degasser, (G1311A) 1100 quaternary pump, an (G1329A) 1100
auto-sampler, and an (G1316A) 1100 column oven, all purchased
from Agilent (Waldbronn, Germany). An LC-10 AVvp UV detector,
equipped with a pressure-resistant UV cell (up to 80 bar) was purchased from Shimadzu (Kyoto, Japan).
System control was performed using Agilent ChemStation. Data
acquisition was performed using Shimadzu LabSolutions software.
All data analysis (e.g. alignment, background correction, chromatogram reshaping and peak analysis) was performed in MATLAB
R2021a, purchased from Mathworks (Natick, MA, USA).
3. Results & Discussion
3.1. Design and initial experiments
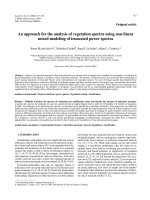
3.1.1. Design of the LC LC set-up
To perform the recycling gradient experiments a ten-port valve
and two identical columns were utilized. A scheme of the set-up is
shown as Fig. 1-A. For the experiment the gradient is only created
a single time and is continuously recycled between two columns.
Because it is not possible to recycle a gradient that exceeds a single column volume without losing part of the gradient to waste,
the gradient volume was always kept below the void volume of
one column. A pressure-resistant UV-detector was installed in-line
to allow monitoring of the separation and the gradient during each
cycle. Fig. 1-B shows an example of the data obtained from this
in-line UV detector when running LC LC of a test compound. A
recurring signal is obtained that may be “folded” in a similar manner as is commonly done for modulations in LC×LC or comprehensive two-dimensional gas chromatography (GC×GC) (Fig. 1-C). The
folded data can then be visualized as either a stacked plot (left) or
as a surface plot (right).
2.2.2. Chemicals and Materials
THF and non-stabilized THF (99.9%, LC-MS Grade, unstabilized)
were obtained from VWR Chemicals (Darmstadt, Germany), ACN
(≥99.9%, LC-MS Grade) and methanol (MeOH, 99.9%, LC-MS Grade)
were obtained from Biosolve B.V. (Valkenswaard, the Netherlands). 2,2 -Azodi(2-MethylButyroNitrile) (AMBN, 98%) and Methylmethacrylate monomers (MMA, 99%) were obtained from Sigma
Aldrich (Steinheim, Germany). Styrene monomers (ST, 99%) was
obtained from Fluka (Seelze, Germany). 1-Butanon (MEK, 99%) was
obtained from Acros (Geel, Belgium). All water was purified inhouse using a Satorius Arium 611VF at a resistivity of 18.2 M ·cm
obtained from Sartorius (Göttingen, Germany). A polystyrene (PS)
standards kit was obtained from Polymer Standards Service GmbH.
2.3. Material and methods common to Laboratory A and B
(V
+V
)+V
2V
+V
The duration of the first cycle was 0,1 0,F2 dwell ≈ 0 F dwell .
In the present case two columns of (nearly) equal volume were
used (V0 ≈ V0,1 ≈ V0,2 ). However, in principle any combination of
columns (packed with the same particles) may be used when unequal switching times are used, provided that the gradient volume remains below the smallest of the two column volumes (VG ≤
min{V0,1 , V0,2 }). After the first cycle, the gradient (with the analytes positioned in it) was redirected to the first column. The gradient was then alternated between columns for a number of n cyV
cles with a constant recycle time of F0 . Folding the individual cycles (Fig. 1-C) reveals a few important aspects of LC LC. Firstly, it
is possible to track the progression of an analyte within the gradient. Secondly, it shows that selecting the correct recycle timing
is critical, especially when a very large number of cycles is to be
performed. When the timing of each cycle is off, the gradient and
the position of the analytes are not aligned in each run. In Fig. 1-C
the selected cycle time was about 1.2 s too short. The dotted line
in Fig. 1-C corresponds to a benchmark point (signal disturbance
around the moment the valve is switched) in the chromatograms
from each cycle. If the correct cycle time is used such a line becomes vertical. In most cases the correct cycle timing could be accurately determined by aligning each cycle based on characteristic
features in the background signal.
Certain equipment and chemicals, as well as procedures, were
transferred and therefore identical in both laboratories. These are
included in this section.
2.3.1. Equipment and procedure
For the recycling experiments two sets of two 250 × 4.6 mm
Nucleosil columns (C18 and bare silica), both containing 5-μm particles with a pore size of 40 0 0 A˚ were obtained from Macherey
Nagel (Düren, Germany). Two 250 × 4.6 mm C18 columns containing 5-μm particles with a pore size of 120 A˚ were obtained from
YMC (Kyoto, Japan). Additionally, two 250 × 4.6 mm Imtakt Presto
FF-C18 columns from Imtakt (Kyoto, Japan), containing non-porous
2-μm particles, were also evaluated.
For the SEC experiments three 150 × 4.6 mm Acquity APC XT
columns containing 1.7-μm particles with a pore size of 45 A˚ were
used. Non-stabilized THF was used as eluent.
A 10-port 2-position UHPLC valve (MXT715-102) was purchased
from Rheodyne, IDEX Corporation (Lake Forest, IL, USA). An Arduino Uno Rev 3 was purchased from a local electronics supplier
and was used to control the timing of the 10-port valve, irrespective of the system used.
In all cases the approximate cycle timing was determined from
a blank THF injection and a 0-100% gradient of THF in ACN was
run to determine the dwell volume. Unless otherwise mentioned,
the temperature of the column oven was set to 30 ºC.
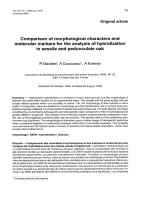
3.1.2. Experimental evaluation of gradient deformation
From previous work it is known that steep gradients come with
a higher risk of strong column-induced gradient deformation [49].
To practically assess the magnitude of this effect and its consequences for LC LC, several initial tests were performed on a variety of columns. A reasonably large PS standard (113 kDa, PS6)
was followed during a number of cycles. For all experiments the
same gradient from 0-100% THF in ACN in 3 min was used. For
the different columns the flowrate was adjusted so that the gradient volume remained below V0 . For the 120 and 40 0 0 A˚ columns
V0 was about 3.1 mL, so a flowrate of 1 mL·min–1 was used. For
the non-porous C18 columns V0 was about 1.2 mL so a flowrate
of 0.4 mL·min–1 was used. The results of these initial experiments
are illustrated in Fig. 2 for several sets of columns with different
2.3.2. Chemicals
Five (statistical) copolymer samples consisting of styrene and
methyl methacrylate (S/MMA), with average compositions of:
84/16; 71/29; 57/43; 42/58; 25/75, were synthesized in-house in
laboratory B using thermally-initiated free-radical polymerization.
The full procedure is included in the supplementary information
(section S1).
Six different (statistical) copolymer samples consisting of
methyl methacrylate and butyl methacrylate (MMA/BMA) were obtained from DSM (Waalwijk, The Netherlands). A block copolymer from MMA/BMA was obtained from Polymer Standards Service
GmbH.
4
L.E. Niezen, B.B.P. Staal, C. Lang et al.
Journal of Chromatography A 1679 (2022) 463386
Fig. 1. A) Schematic illustration of the recycling-gradient set-up, B) Trace from the in-line DAD resulting from the recycling gradient with the switching moments of the
valve indicated by the dotted lines, C) Data folded and aligned, displayed as stacked individual cycles (left) or as a surface plot (right).
˚ 5-μm C18 columns, B) 40 0 0 A,
˚ 5-μm C18 columns, C) 40 0 0
Fig. 2. LC LC of PS6 (113 kDa) using recycling of a 3-min 0-100% THF in ACN gradient for a couple of A) 120 A,
˚ 5-μm bare silica columns and D) non-porous 2-μm C18 columns
A,
stationary-phase chemistries, pore sizes, and particle sizes. The decision to recycle the entirety of the gradient ( ϕ = 1, VG = V0 ) was
based on the desire to cover a wide range of possible critical compositions (ϕcrit ). This is especially relevant when little or no information is available on the retention characteristics of the sample
(i.e. no known information on the distributions of ln k0 and S, or
on ϕcrit ). This will often be the case when analysing (co-)polymers.
From Fig. 2 it may be concluded that the worst result was obtained for the 120 A˚ C18 columns. The shape of the background
absorbance signal due to the gradient is seen to drastically change
and the PS6 peak (indicated by the asterisk) in the gradient becomes eventually obscured (Fig. 2-A). Apparently, the column is
not sufficiently equilibrated between cycles. Also, a spurious peak
appears in the first cycle, and can be more clearly seen in the second cycle (indicated by the red arrow). A convex shape of the lead-
ing part of the gradient is indicative of solvent de-mixing caused
by the preferential adsorption of the more-UV-active and most
non-polar solvent (THF) on the column. Due to the inadequate
equilibration of the column and an apparent saturation of the stationary phase with THF, no useful results were obtained. After
only three cycles the peak corresponding to PS6 completely overlaps with a “breakthrough peak” of THF. In contrast, for both the
columns containing 40 0 0 A˚ particles (Fig. 2-B for C18 particles and
Fig. 2-C for bare-silica particles), as well as the columns containing non-porous C18 particles (Fig. 2-D) the traces for each cycle
are much more consistent and the PS6 standard readily assumes its
position around the critical composition for polystyrene in the gradient (which is expected considering its relatively large molecular
weight). For all columns other than the 120 A˚ C18 columns, a gradual increase in the pressure was consistently observed during each
5
L.E. Niezen, B.B.P. Staal, C. Lang et al.
Journal of Chromatography A 1679 (2022) 463386
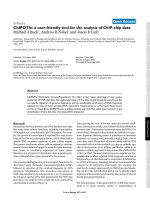
Fig. 3. LC LC of PS1-6. A) non-porous C18 columns using a 3-min gradient of 20-80% THF in ACN at a flow rate of 0.4 mL.min–1 ; B) 40 0 0 A˚ C18 columns using a 3-min
gradient of 20-80% THF in ACN at a flow rate of 1 mL.min–1 ; C) 40 0 0 A˚ bare-silica columns using a 3-min gradient of 0-100% THF in ACN at a flow rate of 1 mL.min–1 . The
first-cycle chromatograms are shown in the bottom panel; the last (20th or 10th ) cycle chromatograms are shown in the top panel. The central panel displays the surface
plots for all cycles.
cycle, due to an increase in the fraction of the more-viscous THF.
In conclusion, successful recycling of the full gradient ( ϕ = 1,
VG = V0 ) could not be achieved in columns that contained parti˚ likely because the required equicles with small pores (120 A),
libration time for these columns was much longer than for the
wide pore packings [50]. However, if an application is run across
a narrower range of compositions (smaller ϕ ), small-pore particles with large available surface areas may still feasibly be used.
In the present study all further experiments were conducted using the stationary phases with 40 0 0 A˚ pores and the non-porous
particles.
dent of molecular weight. A comparison of Fig. 3-A and Fig. 3-B
also demonstrates that, in case of gradient elution, the presence
of pores does not determine whether a (pseudo) critical composition exists. For the bare-silica columns (Fig. 3-C), only a marginal
reduction in the molecular-weight influence was observed, which
indicates the absence of critical conditions on these columns and
with this combination of solvents. The separation obtained using
the bare-silica columns (Fig. 3-C) is nearly independent of the effective column length and there is little or no variation in the retention factor at the moment of elution (ke ) with b. This demonstrates that LC LC may, within one experiment, also provide information on the underlying elution behaviour, as the minor influence
of an increase in column length indicates that elution is governed
more so by solubility (ACN to THF corresponding to a non-solvent
to solvent gradient) than by interaction with the column. This results in another potential practical application of LC LC, namely
the ability to determine approximate critical conditions when narrow standards are not available, as is very often the case (e.g. for
copolymers).
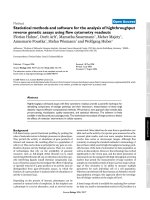
For all analytes the changes in peak width and shape as a function of cycle number were assessed for both the non-porous and
40 0 0-A˚ C18 packings (Fig. 4).
The obtained peak-width parameters on the columns packed
with non-porous particles was, in most cases, a factor two to three
smaller than those obtained for the 40 0 0 A˚ C18 columns, likely
thanks to faster mass-transfer in these columns, because of the
smaller particle size (2-μm vs. 5-μm) and the absence of pores. Additionally, irrespective of the column used, the shape of the peak
depends on the molecular weight of the analyte and small differences can be observed in the peak widths between successive
cycles (“zig-zag” effect). Apparently, the chromatogram depends
slightly on which of the two columns the gradient has passed
through before entering the in-line DAD. This may be explained
by differences in the packing, the stationary phase itself, or small
3.1.3. LC LC of PS standards on various columns
To investigate the applicability of the method for reducing the
molecular-weight influence on retention, PS standards of different
molecular weight were used as a model system. Peak molecular
weights (Mp ) and polydispersity indices (PDI, in brackets) were
4.29 kDa (1.05), 10.4 kDa (1.03), 19.6 kDa (1.03), 43.3 kDa (1.03),
70.9 kDa (1.03), and 113 kDa (1.03), respectively, henceforth referred to as PS1 through PS6. The separation obtained for these
standards on the non-porous C18, the 40 0 0 A˚ C18, and the 40 0 0
A˚ bare-silica columns is illustrated in Fig. 3. Examples of the nonaligned signals are included in the supplementary material (Fig. S1, section S2).
These experiments confirm that the influence of the molecular
weight is progressively reduced with an increasing number of cycles in case of the C18 columns (for both the non-porous particles,
Fig. 3-A, and the 40 0 0 A˚ particles, Fig. 3-B). The mitigation of the
molecular-weight effect concurs with an increase in the effective
gradient steepness (b). On the non-porous columns (Fig. 3-A), the
difference in elution composition between PS1 (4.29 kDa) and PS6
(113 kDa) is reduced from ϕ = 17% (first cycle, i.e. no recycling)
to ϕ < 0.1% (20 cycles). Evidently, when the gradient steepness
is sufficiently large, the elution order becomes essentially indepen6
L.E. Niezen, B.B.P. Staal, C. Lang et al.
Journal of Chromatography A 1679 (2022) 463386
Fig. 4. Front and tail peak widths (in mL) obtained during LC LC of PS1-6; widths are measured to the peak center line at 10% of the maximum peak height, and depicted
as function of cycle number. Blue circles: front peak widths; red diamonds: tail peak widths. Gradient: 3-min 20-80% THF in ACN. A) non-porous C18 particles; flow rate,
0.4 mL.min–1 ; B) 40 0 0 A˚ C18 particles; flow rate, 1 mL.min–1 .
differences in the pressure for the two columns. The latter effect
is a less likely explanation, because LC LC requires only moderate
pressures. An eventual pressure effect may be expected to be more
pronounced for high-molecular-weight analytes, which from previous studies are known to experience relatively large changes in
partial molar volume with a change in pressure compared to small
analytes [51–53], which cannot be discerned from Fig. 4. Concerning the shape of the peak, two processes can be observed. Firstly,
the peak fronting decreased significantly with cycle number, most
noticeably for the low-molecular-weight analytes and marginally
for PS5 and PS6. Secondly, the peak tailing increased with cycle
number, again less strongly for the high-molecular-weight standards. The first process is likely a result of the selectivity with respect to molecular weight, which is much larger for PS1 than for
PS6, as a result of the much shallower effective gradient that this
standard experiences (i.e. lower value of b, because of smaller S
values). The second process may be a result of either chromatographic peak broadening or an inversion of the molecular weight
dependence around the “pseudo” critical composition. Using gradient elution the peak width (in volume units, σV ) may be described
using Eq. 4:
V
σV = G √0 (1 + ke )
N
of these experiments, as performed on the non-porous-particle C18
columns, are illustrated in Fig. 5.
Small differences in elution time (and thus molecular weight)
are found to remain after 10 cycles, especially for fractions 3
and 4 ( Mp ≈ 1.1 kDa). Additionally, the average Mp (as determined by calibration relative to a different set of PS standards)
differed slightly from the listed value. Irrespective of these differences, all later fractions showed nearly consistent peak molecular
weights. This confirms that the observed peak tailing is a result
of chromatographic and extra-column dispersion, rather than selectivity. Chromatographic peak broadening occurs predominantly
at the trailing edge of the peak. This can be explained by the
fact that, after the molecular-weight effect on retention is fully diminished (no remaining selectivity as observed in Fig. 5), a peaksharpening effect due to the gradient likely prevails at the front of
the peaks. Molecules that run ahead of the peak (and thus the gradient) will slow down due to the increase in weak solvent and get
back in line. Such gradient-sharpening is absent at the back side
of the peaks, where all k values are low. Such an explanation is
in agreement with the observation that the broadening is greatest for low-molecular-weight standards, while higher-molecularweight standards show less broadening. Contrarily, extra-column
band broadening is expected to be more severe for high-molecularweight standards, as a result of their much smaller diffusion coefficients. However, SEC or hydrodynamic effects could help sharpen
the peaks, as this would allow large molecules that have fallen behind to catch up. For the 40 0 0 A˚ columns a brief assessment of
the influence of flowrate and the range of mobile-phase composition covered by the gradient ( ϕ ) on peak width was performed
across 10 cycles for a narrow and broad PS standard. The results
of these experiments are included in the supplementary material
(Fig. S-2, section S3) and indicated that broad and narrow standards reach nearly equal peak width at high number of cycles for
the same gradient. Gradients spanning smaller ϕ and higher flow
rates generally resulted in broader peaks.
(4)
In which G is a band compression factor, which for very
steep gradients (large b) and an unretained mobile-phase modifier
should reach a (supposedly limiting) value of about 0.58 [36,37].
Because in our case large b values can likely be reached and the
resulting ke values are small (and likely similar) for all analytes,
the peak width after a given number of cycles should depend primarily on N and V0 . When such conditions are reached σV is expected to increase with the square root of the number of cycles.
Given the small ke values, extra-column band broadening is also a
point of concern.
In this work the peak broadening seemed to manifest itself
primarily in the form of peak tailing, rather than as an increase
in overall peak width. This effect was largest for PS1. To investigate this effect, an LC LC analysis of PS1 on the non-porous
column was ended after the 10th cycle. Fractions of the effluent
were collected and subsequently measured with SEC. The results
3.2. LC LC for the analysis of chemical-composition distributions
3.2.1. Separations of S/MMA copolymers
Because LC LC could successfully suppress the influence of the
molecular weight in case of PS, it was deemed to be a good tech7
L.E. Niezen, B.B.P. Staal, C. Lang et al.
Journal of Chromatography A 1679 (2022) 463386
Fig. 5. A) Fractionation of PS1 after analysis by LC LC (10 cycles) using non-porous C18 particles with a 3-min 20-80% THF gradient in ACN at a flowrate of 0.4 mL.min–1 ;
fraction numbers are indicated. B) SEC chromatograms of the fractions indicated in A, measured using Acquity APC XT columns, with unstabilized THF at a flowrate of 0.5
mL·min–1 and a column oven temperature of 60ºC.
Fig. 6. LC LC of S/MMA copolymers SM1-2 (A) and SM1-5 (B) performed on two 40 0 0 A˚ C18 columns using a flow rate of 1 mL.min–1 . Gradient, A) 30-50% THF in ACN
in 2.5 min, B) 0-60% THF in ACN in 2.5 min. Average S/MMA compositions: SM1, 84/16; SM2, 71/29; SM3, 57/43; SM4, 42/58; SM5, 25/75. Experiments were performed on
System B.
nique for determining chemical-composition distributions (CCD),
without a confounding effect of molecular weight. Experiments
were performed on five statistical copolymers consisting of S/MMA
(SM1-5), as well as on seven MMA/BMA copolymers (MB1-7), to
assess whether the approach could be applied to achieve higher
resolution between samples differing only slightly in composition. For SM1-2 a gradient spanning a narrow range in composition (small ϕ ) was used. This caused a pronounced influence
of the underlying broad MWD (Mw = 54 kDa (PDI = 2.3) and
64 kDa (PDI = 2.1) for copolymer SM1 and SM2, respectively) of
these samples on the elution profile obtained with conventional
gradient-elution LC, as is clear from the first-cycle trace in Fig. 6-A
where distinctly fronting peaks are obtained.
The underlying MWD jeopardizes the determination of the CCD
when a shallow gradient is used. In subsequent cycles the effective gradient slope (b) gradually increases causing the profile to
reflect the CCD, with little or no influence of the broad MWD.
Much sharper peaks were obtained after ten cycles, as a result of
the narrow CCD of both copolymers. The signal-to-noise ratio improved by more than a factor of three for both distributions and
the their resolution improved from 0.66 to 1.5 (determined after
deconvoluting the two distributions). If a broader range of polymer
compositions (broad CCD) is considered (SM1-5), a gradient with a
larger ϕ is required (Fig. 6-B). This increases the value of b and
reduces the influence of the MWD for all copolymers, even in the
first cycle. Because the difference in the critical compositions of
SM1 and SM2 ( ϕcrit = ϕcrit,SM2 − ϕcrit,SM1 ) is about 4.8%, and is
independent of the slope of the gradient, a higher resolution in
terms of chemical composition is obtained when the gradient covers a smaller range of eluent compositions, within the same time
frame. This confirms that the retention of these copolymers follows the same basic rules as the PS homopolymers, with a strong
correlation between the molecular-weight dependent slope (S) and
intercept (ln k0 ) of Eq. (1). Peaks are seen to remain broader in
time units at smaller ϕ even after recycling of the gradient. In
terms of volume-fraction units (at the elution composition) peaks
are narrower for narrow range gradients. This may be the best reflection of the actual CCD, because the chemical-composition selectivity of the separation is maximized and overshadows the contribution of the chromatographic dispersion.
3.2.2. Separations of MMA/BMA copolymers
To further illustrate the effect of gradient recycling the method
was also applied to a separation of MMA/BMA copolymers (MB18
L.E. Niezen, B.B.P. Staal, C. Lang et al.
Journal of Chromatography A 1679 (2022) 463386
Fig. 7. LC LC of MMA/BMA copolymers MB1-7 performed on A) non-porous C18 particles using a gradient of 0-60% THF in ACN in 3 min at a flowrate of 0.4 mL.min–1 , and
B) 40 0 0-A˚ C18 particles using a gradient of 0-60% THF in ACN in 2.5 min at a flowrate of 1 mL.min–1 . Average MMA/BMA compositions (as determined by 1 H-NMR) and
Mw : MB1, 50/50 (4.2 kDa); MB2, 76/24 (80 kDa); MB3, 58/42 (20 kDa); MB4, 32/68 (15 kDa); MB5, 30/70 (50 kDa); MB6, 85/15 (100 kDa); MB7, 0/100 (160 kDa).
7), using both the columns containing non-porous and 40 0 0 A˚ C18
particles (Fig. 7).
In this case a broader range of composition ( ϕ ) was used.
Again we observed that the separation with respect to polymer
composition, once obtained, can be maintained in subsequent cycles. Unlike the above example of the S/MMA copolymers, most
peaks show the characteristic fronting due to the confounding
MWD in the first cycle (upper panels in Fig. 7). The fronting is reduced or disappears for many peaks with an increasing number of
cycles, as the effect of the MWD is increasingly suppressed. An additional method to illustrate the effect of the recycling is to predict
the approximate critical compositions of the copolymers and comparing these with the obtained elution compositions before and after a recycling of the gradient. Previous work has shown that the
approximate critical composition of a statistical copolymer can be
calculated using data obtained for the corresponding homopolymers [16], by using Eq. 5
ϕcrit,AB =
pA (1 − XB ) + pB XB
qA pA (1 − XB ) + qB pB XB
proximate critical composition. Therefore, it is expected that the
difference between the measured elution composition (ϕe ) and the
predicted critical composition (ϕcrit,AB ) is minimized with an increase in the number of cycles (or gradient steepness), especially
for the lowest-molecular-weight analytes (MB1 and MB4). The approximate critical compositions were calculated in this way using ϕcrit,PMMA = 0.09, ϕcrit,PBMA = 0.47, and ϕcrit,MB5 = 0.34 (with
XBMA = 0.70, as determined from 1 H-NMR). The differences between the measured elution compositions and the elution compositions predicted in this way (calculated as: |ϕe − ϕcrit,AB | ∗ 100)
for MB1 and MB4 decreased from 7.9% and 2.0% in the first cycle,
to 1.4% and 0.092% after the final cycle, respectively. Assuming instead that ϕcrit,AB varied linearly with XBMA between ϕcrit,PMMA and
ϕcrit,PBMA led to an overestimation in all cases. A full overview is
given in the supplementary information (Fig. S-3, section S4). The
largest shift in elution composition after recycling of the gradient
occurred for copolymer MB1. This is not surprising, since this is
a low-molecular-weight copolymer (Mw = 4.2 kDa). Additionally,
because it is a block copolymer, the peak remains broad even after recycling. Block copolymers tend to have a much broader CCD
than statistical copolymers, due to the block-length distributions
of the two blocks. The peak of copolymer MB4 showed significant
fronting, even after 10 cycles. To evaluate whether this fronting occurred due to the remaining influence of the MWD or was the result of the underlying CCD, peak fractions were taken after 1 and
20 cycles. The MWD of each fraction was subsequently determined
using SEC and also the change in peak asymmetry during the recycling experiment was evaluated (Fig. 8).
As seen in Fig. 8-A, the peak fronting decreases during the cycles, until it seems to converge after 20 cycles, indicating that the
confounding effect of the underlying MWD has been diminished.
However, significant fronting remains, even after 20 cycles (Fig. 8C), the underlying gradient is indicated in the FIG. to better highlight the remaining extent of peak fronting. An analysis of the fractions taken from the 20th cycle (Fig. 8-D) shows that the underlying MWD within all fractions after the first two is the same, indicating that even for a relatively low molecular weight polymer
(Mp = 15 kDa) a good reflection of the true CCD of the polymer
can be obtained. This case underlines the value of LC LC. Without
recycling there is a strong confounding effect of the MWD and the
CCD, which prevents correct interpretation of the results.
(5)
in which the subscripts A and B indicate monomer A and B, respectively, X is the mass fraction of the respective monomer in
the copolymer AB, q is the slope obtained by assuming a linear
correlation between S and ln k0 , and corresponds to the approximate critical composition as ϕcrit = 1q , p is the slope obtained by
assuming a linear correlation between ln k0 and molecular weight,
and ϕcrit,AB is the approximate critical composition of copolymer
AB with mass fraction XB . Determining pA and pB individually for
both homopolymers may require multiple experiments and can be
p
tedious. However, since ϕcrit,AB can be shown to depend on pA by
B
dividing Eq. 5 by pB it can be easier to rewrite Eq. 5 to:
pA
=
pB
ϕ
,AB
XB 1 − ϕcrit
crit,B
(1 − XB )
(6)
ϕcrit,AB
ϕcrit,A − 1
p
This equation allows one to determine pA provided that the
B
approximate critical conditions are determined for two highmolecular-weight homopolymers A and B, and one high-molecularweight copolymer AB of known average composition, given by XB .
In our case recycling of the gradient promotes elution at the ap-
9
L.E. Niezen, B.B.P. Staal, C. Lang et al.
Journal of Chromatography A 1679 (2022) 463386
Fig. 8. LC LC of copolymer MB4 using non-porous C18 particles with a 3-min 0-60% THF gradient in ACN at a flowrate of 0.4 mL.min–1 . A) Front (blue) and tail (red) peak
widths (in mL) as function of cycle number (calculation, see Fig. 4). B and C) Peak profiles after 1st and 20th cycle, respectively, with fractions taken indicated; dashed line
under the peak indicates the background signal of the gradient. D and E) SEC chromatograms of the fractions indicated in B and C, respectively, measured using Acquity APC
XT columns at a flowrate of 0.5 mL.min–1 and a column oven temperature of 60 ºC.
4. Conclusion
CRediT authorship contribution statement
In this work the use of LC LC for the analysis of the CCD of
copolymers is introduced and demonstrated. The entirety of the
gradient is continuously recycled to achieve extremely steep gradients, so as to minimize the effect of the MWD on the elution
profile. Conventionally, very fast gradients require short durations,
in combination with long columns and low flow rates, resulting
in decreased peak capacities, long analysis times, and an increased
risk of system-induced gradient deformation. Such issues can be
avoided with LC LC. It is demonstrated that a set of polystyrene
standards of greatly different molecular weights can be made to
(nearly) completely co-elute. LC LC was used to determine the
CCD of two sets of copolymers (S/MMA and MMA/BMA), with
the confounding effect of the MWD being successfully suppressed.
Based on the results presented, LC LC appears suitable for the accurate determination of the CCD of a wide range of copolymers
with narrow or broad CCDs and MWDs. No prior information on
the critical conditions is required, greatly reducing the effort required and eliminating the need for (narrow) standards.
Chromatographic dispersion remains, but gradient conditions
and column dimensions may be chosen such that the chemicalcomposition selectivity is dominant. Columns packed with largepore particles or non-porous particles can be used for LC LC, but
small-pore particles give rise to column-induced gradient deformation. This was ascribed to adsorption of mobile-phase components
on packings with large surface areas.
An LC LC experiment may be ended after any number of cycles and combined with any detector suitable for gradient LC. Also,
LC LC may be coupled on-line with other methods, such as sizeexclusion chromatography, to better highlight potential differences
between samples. A comprehensive coupling of LC LC and SEC
may provide clearly interpretable results, and the orthogonality between RPLC or NPLC and SEC will be increased. Even without addition of another method LC LC was shown to be capable of a more
direct determination of the CCD.
Leon E. Niezen: Conceptualization, Methodology, Formal
analysis, Investigation, Writing – original draft, Visualization.
Bastiaan B.P. Staal: Conceptualization, Methodology, Writing
– review & editing, Resources, Supervision. Christiane Lang:
Resources, Writing – review & editing. Harry J.A. Philipsen:
Resources, Project administration, Writing – review & editing.
Bob W.J. Pirok: Resources, Supervision, Funding acquisition,
Project administration, Writing – review & editing. Govert W.
Somsen: Funding acquisition, Project administration, Writing –
review & editing. Peter J. Schoenmakers: Resources, Supervision,
Funding acquisition, Project administration, Writing – review &
editing.
Acknowledgements
LN acknowledges the UNMATCHED project, which is supported
by BASF, DSM and Nouryon and receives funding from the Dutch
Research Council (NWO) in the framework of the Innovation Fund
for Chemistry (CHIPP Project 731.017.303) and from the Ministry of
Economic Affairs in the framework of the “TKI-toeslagregeling”. BP
acknowledges the Agilent UR grant #4354.
This work was performed in the context of the Chemometrics
and Advanced Separations Team (CAST) within the Centre for Analytical Sciences Amsterdam (CASA). The valuable contributions of
the CAST members are gratefully acknowledged.
Supplementary materials
Supplementary material associated with this article can be
found, in the online version, at doi:10.1016/j.chroma.2022.463386.
References
[1] A.M. Striegel, Method development in interaction polymer chromatography,
TrAC - Trends in Analytical Chemistry 130 (2020), doi:10.1016/j.trac.2020.
115990.
[2] A.M. Striegel, W.W. Yau, J.J. Kirkland, D.D. Bly, Modern Size-Exclusion Liquid
Chromatography: Practice of Gel Permeation and Gel Filtration Chromatography: Second Edition, 2009. 10.1002/9780470442876.
Declaration of Competing Interest
All authors declare no conflict of interest.
10
L.E. Niezen, B.B.P. Staal, C. Lang et al.
Journal of Chromatography A 1679 (2022) 463386
[3] W. Radke, Polymer separations by liquid interaction chromatography: Principles - prospects - limitations, J. Chromatogr. A 1335 (2014) 62–79, doi:10.1016/
j.chroma.2013.12.010.
[4] B. Trathnigg, Determination of MWD and chemical composition of polymers
by chromatographic techniques, Prog. Polym. Sci. 20 (1995) 615–650, doi:10.
1016/0 079-670 0(95)0 0 0 05-Z.
[5] A. Baumgaertel, E. Altuntas¸ , U.S. Schubert, Recent developments in the detailed
characterization of polymers by multidimensional chromatography, J. Chromatogr. A 1240 (2012) 1–20, doi:10.1016/j.chroma.2012.03.038.
[6] I.A. Haidar Ahmad, A.M. Striegel, Determining the absolute, chemicalheterogeneity-corrected molar mass averages, distribution, and solution conformation of random copolymers, Anal. Bioanal.Chem. 396 (2010) 1589–1598,
doi:10.10 07/s0 0216-0 09-3320-9.
[7] W.C. Knol, B.W.J. Pirok, R.A.H. Peters, Detection challenges in quantitative polymer analysis by liquid chromatography, J. Sep. Sci. 44 (2021) 63–87, doi:10.
10 02/jssc.2020 0 0768.
[8] P. Castignolles, R. Graf, M. Parkinson, M. Wilhelm, M. Gaborieau, Detection and
quantification of branching in polyacrylates by size-exclusion chromatography
(SEC) and melt-state 13C NMR spectroscopy, Polymer 50 (2009) 2373–2383,
doi:10.1016/j.polymer.2009.03.021.
[9] T. Chang, H.C. Lee, W. Lee, S. Park, C. Ko, Polymer characterization by
temperature gradient interaction chromatography, Macromol. Chem. Phys.
200 (1999) 2188–2204, doi:10.1002/(sici)1521-3935(19991001)200:10 2188::
aid- macp2188 3.3.co;2- 6.
[10] W. Lee, D. Cho, B.O. Chun, T. Chang, M. Ree, Characterization of polystyrene
and polyisoprene by normal-phase temperature gradient interaction chromatography, J. Chromatogr. A 910 (2001) 51–60, doi:10.1016/S0 021-9673(0 0)
01163-8.
[11] W. Radke, S. Lee, T. Chang, Temperature gradient interaction chromatography
of polymers: a molecular statistical model, J. Sep. Sci. 33 (2010) 3578–3583,
doi:10.1002/jssc.201000462.
[12] M. Schollenberger, W. Radke, SEC-Gradients, an alternative approach to polymer gradient chromatography: 1. Proof of the concept, Polymer 52 (2011)
3259–3262, doi:10.1016/j.polymer.2011.05.047.
[13] M. Schollenberger, W. Radke, Size exclusion chromatography-gradients, an
alternative approach to polymer gradient chromatography: 2. Separation
of poly(meth)acrylates using a size exclusion chromatography-solvent/nonsolvent gradient, J. Chromatogr. A 1218 (2011) 7827–7831, doi:10.1016/j.
chroma.2011.08.090.
[14] F.A. Messaud, R.D. Sanderson, J.R. Runyon, T. Otte, H. Pasch, S.K.R. Williams,
An overview on field-flow fractionation techniques and their applications in
the separation and characterization of polymers, Progress in Polymer Sci. 34
(2009) 351–368, doi:10.1016/j.progpolymsci.2008.11.001.
[15] P. Jandera, M. Holcˇ apek, L. Koláˇrová, Retention mechanism, isocratic and
gradient-elution separation and characterization of (co)polymers in normalphase and reversed-phase high-performance liquid chromatography, J. Chromatogr. A (20 0 0) 65–84, doi:10.1016/S0021-9673(99)01216-9.
[16] F. Fitzpatrick, R. Edam, P. Schoenmakers, Application of the reversed-phase liquid chromatographic model to describe the retention behaviour of polydisperse macromolecules in gradient and isocratic liquid chromatography, J. Chromatogr. A 988 (2003) 53–67, doi:10.1016/S0021- 9673(02)02050- 2.
[17] P. Schoenmakers, F. Fitzpatrick, R. Grothey, Predicting the behaviour of polydisperse polymers in liquid chromatography under isocratic and gradient
conditions, J. Chromatogr. A 965 (2002) 93–107, doi:10.1016/S0021-9673(01)
01322-X.
[18] T. Brooijmans, P. Breuer, A. Schreuders, M. van Tilburg, P.J. Schoenmakers,
R.A.H. Peters, Charge-based separation of acid-functional polymers by nonaqueous capillary electrophoresis employing deprotonation and heteroconjugation approaches, Anal. Chem. 93 (2021) 5924–5930, doi:10.1021/acs.analchem.
1c00311.
[19] S. Abrar, B. Trathnigg, Analysis of polyethyleneoxide macromonomers by liquid chromatography along the critical adsorption line, Anal. Bioanal.Chem. 400
(2011) 2577–2586, doi:10.10 07/s0 0216- 010- 4554- 2.
[20] M. Mlynek, W. Radke, Critical chromatography in ternary solvents, J. Chromatogr. A 1284 (2013) 112–117, doi:10.1016/J.CHROMA.2013.02.005.
[21] K.J.
Bombaugh,
R.F.
Levangie,
High
resolution
gel
permeation
chromatography-using recycle, Separation Sci. 5 (1970) 751–763,
doi:10.1080/0 03723670 08055537.
[22] J. Porath, P. Flodin, Gel filtration: a method for desalting and group separation,
Nature 183 (1959) 1657–1659, doi:10.1038/1831657a0.
[23] F. Gritti, S. Besner, S. Cormier, M. Gilar, Applications of high-resolution recycling liquid chromatography: from small to large molecules, J. Chromatogr. A
1524 (2017) 108–120, doi:10.1016/j.chroma.2017.09.054.
[24] F. Gritti, Rebirth of recycling liquid chromatography with modern chromatographic columns: extension to gradient elution, J. Chromatogr. A 1653 (2021),
doi:10.1016/j.chroma.2021.462424.
[25] F. Gritti, S. Cormier, Performance optimization of ultra high-resolution recycling liquid chromatography, J. Chromatogr. A 1532 (2018) 74–88, doi:10.1016/
j.chroma.2017.11.047.
[26] L.W. Lim, H. Uzu, T. Takeuchi, Separation of benzene and deuterated benzenes
by reversed-phase and recycle liquid chromatography using monolithic capillary columns, J. Sep. Sci. 27 (2004) 1339–1344, doi:10.1002/jssc.200401882.
[27] A.M. Skvortsov, A.A. Gorbunov, D. Berek, B. Trathnigg, Liquid chromatography
of macromolecules at the critical adsorption point: Behaviour of a polymer
chain inside pores, Polymer 39 (1998) 423–429, doi:10.1016/S0032-3861(97)
00279-6.
[28] Y. Brun, P. Alden, Gradient separation of polymers at critical point of adsorption, J. Chromatogr. A 966 (2002) 25–40, doi:10.1016/S0021- 9673(02)00705- 7.
[29] A.M. Skvortsov, A.A. Gorbunov, Achievements and uses of critical conditions in
the chromatography of polymers, J. Chromatogr. A 507 (1990) 487–496, doi:10.
1016/S0021-9673(01)84228-X.
[30] L.R. Snyder, M.A. Stadalius, M.A. Quarry, L.R. Snyder, Gradient elution in
reversed-phase HPLC separation of macromolecules, Anal. Chem. 55 (1983)
1412A–1430A, doi:10.1021/ac0 0264a0 01.
[31] L.R. Snyder, Linear elution adsorption chromatography. VII. gradient elution theory, J. Chromatogr. A 13 (1964) 415–434, doi:10.1016/s0021-9673(01)
95138-6.
[32] L.M. Blumberg, Theory of gradient elution liquid chromatography with linear
solvent strength: Part 1. migration and elution parameters of a solute band,
Chromatographia 77 (2014) 179–188, doi:10.1007/s10337- 013- 2555- y.
[33] P. Jandera, J. Churáˇcek, Gradient elution in liquid chromatography. II. Retention characteristics (retention volume, band width, resolution, plate number)
in solvent-programmed chromatography - theoretical considerations, J. Chromatogr. A 91 (1974) 223–235, doi:10.1016/S0021-9673(01)97902-6.
[34] X. Jiang, A. van der Horst, P.J. Schoenmakers, Breakthrough of polymers in interactive liquid chromatography, J. Chromatogr. A 982 (2002) 55–68, doi:10.
1016/S0021-9673(02)01483-8.
[35] H. Poppe, J. Paanakker, M. Bronckhorst, Peak width in solvent-programmed
chromatography. I. General description of peak broadening in solventprogrammed elution, J. Chromatogr. A 204 (1981) 77–84, doi:10.1016/
S0 021-9673(0 0)81641-6.
[36] U.D. Neue, D.H. Marchand, L.R. Snyder, Peak compression in reversed-phase
gradient elution, J. Chromatogr. A 1111 (2006) 32–39, doi:10.1016/j.chroma.
2006.01.104.
[37] F. Gritti, General theory of peak compression in liquid chromatography, J. Chromatogr. A 1433 (2016) 114–122, doi:10.1016/j.chroma.2016.01.032.
[38] P. Nikitas, A. Pappa-Louisi, Expressions of the fundamental equation of gradient elution and a numerical solution of these equations under any gradient
profile, Anal. Chem. 77 (2005) 5670–5677, doi:10.1021/ac0506783.
[39] M.A. Bashir, W. Radke, Comparison of retention models for polymers. 1.
Poly(ethylene glycol)s, J. Chromatogr. A 1131 (2006) 130–141, doi:10.1016/j.
chroma.2006.07.089.
[40] P.J. Schoenmakers, H.A.H. Billiet, R. Tussen, L. de Galan, Gradient selection in
reversed-phase liquid chromatography, J. Chromatogr. A 149 (1978) 519–537,
doi:10.1016/S0 021-9673(0 0)810 08-0.
[41] E.C. Freiling, Ion exchange as a separations method. IX. gradient elution theory,
J. Am. Chem. Soc. 77 (1955) 2067–2071, doi:10.1021/ja01613a010.
[42] L.M. Blumberg, Migration and elution equations in gradient liquid chromatography, J. Chromatogr. A 1599 (2019) 35–45, doi:10.1016/j.chroma.2019.03.057.
[43] M.J. den Uijl, P.J. Schoenmakers, B.W.J. Pirok, M.R. van Bommel, Recent applications of retention modelling in liquid chromatography, J. Sep. Sci. 44 (2021)
88–114, doi:10.10 02/jssc.2020 0 0905.
[44] L.R. Snyder, J.W. Dolan, High-Performance Gradient Elution: The Practical Application of the Linear-Solvent-Strength Model, 2006. 10.1002/0470055529.
[45] U.D. Neue, H.J. Kuss, Improved reversed-phase gradient retention modeling, J.
Chromatogr. A 1217 (2010) 3794–3803, doi:10.1016/j.chroma.2010.04.023.
[46] L.R. Snyder, J.J. Kirkland, J.W. Dolan, Introduction to Modern Liquid Chromatography, 2010. 10.1002/9780470508183.
[47] T.S. Bos, L.E. Niezen, M.J. den Uijl, S.R.A. Molenaar, S. Lege, P.J. Schoenmakers,
G.W. Somsen, B.W.J. Pirok, Reducing the influence of geometry-induced gradient deformation in liquid chromatographic retention modelling, J. Chromatogr.
A 1635 (2021), doi:10.1016/j.chroma.2020.461714.
[48] M.A. Quarry, R.L. Grob, L.R. Snyder, Measurement and use of retention data
from high-performance gradient elution. Correction for “non-ideal” processes
originating within the column, J. Chromatogr. A 285 (1984) 19–51, doi:10.1016/
S0021-9673(01)87733-5.
[49] F. Gritti, G. Guiochon, The distortion of gradient profiles in reversed-phase liquid chromatography, J. Chromatogr. A 1340 (2014) 50–58, doi:10.1016/j.chroma.
2014.03.004.
[50] A.P. Schellinger, D.R. Stoll, P.W. Carr, High speed gradient elution reversedphase liquid chromatography, J. Chromatogr. A 1064 (2005) 143–156, doi:10.
1016/j.chroma.2004.12.017.
[51] M. Martin, G. Guiochon, Effects of high pressure in liquid chromatography, J.
Chromatogr. A 1090 (2005) 16–38, doi:10.1016/j.chroma.20 05.06.0 05.
[52] X. Liu, D. Zhou, P. Szabelski, G. Guiochon, Influence of pressure on the retention and separation of insulin variants under linear conditions, Anal. Chem. 75
(20 03) 3999–40 09, doi:10.1021/ac0205964.
[53] G. Guiochon, M.J. Sepaniak, Influence of pressure on solute retention in
liquid chromatography, J. Chromatogr. A 606 (1992) 248–250, doi:10.1016/
0021- 9673(92)87031- 3.
11