Determination of human insulin and its six therapeutic analogues by capillary electrophoresis – mass spectrometry
Bạn đang xem bản rút gọn của tài liệu. Xem và tải ngay bản đầy đủ của tài liệu tại đây (2.13 MB, 9 trang )
Journal of Chromatography A 1678 (2022) 463351
Contents lists available at ScienceDirect
Journal of Chromatography A
journal homepage: www.elsevier.com/locate/chroma
Determination of human insulin and its six therapeutic analogues by
capillary electrophoresis – mass spectrometry
Narmin Hamidli, Blerta Pajaziti, Melinda Andrási, Cynthia Nagy, Attila Gáspár∗
Department of Inorganic and Analytical Chemistry, University of Debrecen, Egyetem tér 1, Debrecen H-4032, Hungary
a r t i c l e
i n f o
Article history:
Received 10 May 2022
Revised 12 July 2022
Accepted 17 July 2022
Available online 18 July 2022
Keywords:
Insulin
Insulin analogues
Therapeutics
Capillary electrophoresis
Mass spectrometry
a b s t r a c t
In this work, human insulin and its 6 analogues were separated and determined using CZE-MS. Three
different capillaries (bare fused silica, successive multiple ionic-polymer layer (SMIL) and static linear
polyacrylamide (LPA) coated) were compared based on their separation performances in their optimal
operating conditions. Coated capillaries demonstrated slightly better separation of the components, although some components showed wide, distorted peaks. The highest plate number could be obtained in
the SMIL capillary (192 0 0 0/m). For UV and ESI-MS detection relatively similar LOD values were obtained
(0.3–1.2 mg/L and 1.0–3.4 mg/L, respectively). The application of MS detection provided useful structural
information and unambiguous identification for insulins having similar or the same molecular mass. This
work is considered to be important not only for the investigation of insulins but also for its potential
contribution to the top-down analysis of proteins using CE-MS.
© 2022 The Authors. Published by Elsevier B.V.
This is an open access article under the CC BY license ( />
1. Introduction
Human insulin plays a major role in the body by regulating
blood glucose homeostasis [1]. The disruption of insulin metabolic
activities due to decreased amounts of insulin, autoimmune responses or insulin resistance leads to diabetes mellitus [2]. Nowadays this illness is treated by administering insulin in the form of
injection. Recombinant DNA technology enables the synthesis and
development of human insulin analogues with different effects but
they can also be a frequent target for adulteration [3,4]. For pharmaceutical, clinical or forensic applications, robust and straightforward analytical and quality control techniques are needed.
A variety of methods for the separation and detection of recombinant insulin formulations [1,3-5] and their degradation products [6–8], quantitation [2], impurity examinations [9,10] were
described in the literature. These methods can be classified as
immunochemical and instrumental analytical methods [3]. Since
immunoassays like ELISA [11] or radioimmunoassays lack the selective identification of different insulin analogues [12], instrumental techniques such as HPLC [2,8-10,13] with UV or MS detectors
gained popularity in this area. The current European Pharmacopoeia method [14] for the analysis of individual insulins is also
based on HPLC-UV approach.
∗
Corresponding author.
E-mail address: (A. Gáspár).
Several capillary electrophoresis (CE) methods, predominantly
capillary zone electrophoresis (CZE), micellar electrokinetic chromatography (MEKC) and capillary gel electrophoresis (CGE) have
also been reported for the determination of insulins. Lamalle et al.
[4] and Haunschmidt et al. [15] utilized MEKC for the analysis of
human insulin and 5 of its analogues. However, since MEKC separations necessitate the use of micelle forming detergents (e.g.,
sodium dodecyl sulfate) in the background electrolyte (BGE) [16],
its coupling with MS detection is problematic. Ortner et al. [3] successfully separated an insulin mixture with MEKC coupled to MS
by using a volatile detergent (perfluorooctanoic acid) in the buffer
solution, however, the suppression of the MS signal could not be
completely avoided. Similarly, CGE analysis [7] uses a polymer sieving matrix, which facilitates the separation of components by their
size. The use of such a matrix in the BGE hinders the chance
for hyphenation with MS and can lead to peak overlapping of insulin analogues having the same (e.g., human insulin and insulin
lispro) or very similar molecular mass. Therefore, CGE and MEKC
frequently employ UV detection, however, that does not allow the
clear identification (eg.: molecular mass, sequence, structure) of
proteins [5]. Although CZE is suitable for coupling with MS, only
a relatively few works utilize CZE for the separation of insulins.
Early studies demonstrated the separation of human insulin and
human growth hormone [8] as well as the quantification of human
insulin [17]. Later, separation performance of CZE for 6 insulin formulations was compared to MEKC where the apparent advantages
of MEKC on selectivity and resolution over CZE were presented
/>0021-9673/© 2022 The Authors. Published by Elsevier B.V. This is an open access article under the CC BY license ( />
N. Hamidli, B. Pajaziti, M. Andrási et al.
Journal of Chromatography A 1678 (2022) 463351
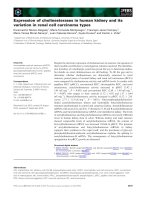
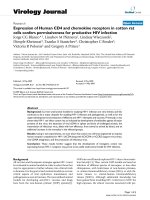
Fig. 1. The structure of human insulin and its analogues.
[3,15]. CZE was applied for analyzing the fragments of human insulin [18] and for determining the binding constants of human insulin hexamer complexes with different components [19]. A successful application of CZE was implemented by Yeh et al. [1] where
authors achieved the baseline separation of human insulin and two
analogues in a single run. Including the earlier mentioned studies
with CZE, the majority of separations employ BGE solutions with
pH values higher than the isoelectric points (pI) of the components
(pH 6.5–9.2) to minimize the protein-capillary surface interactions.
The application of BGEs having low pH values or the modification of the capillary surface with dynamic or static coatings for the
separation of insulin mixtures are also considered as good alternatives but tend to be overlooked in the literature. Recently, we have
demonstrated that the adsorption of proteins (of varying sizes, including insulin) can be efficiently suppressed during CZE even in
bare fused silica (BFS) capillaries if very low pH BGEs (pH=1.8) are
used [20].
In this work, we studied the separation of human insulin and
its 6 analogues using semipermanent physically (electrostatically)
coated (successive multiple ionic-polymer layer (SMIL) [21]) and
static coated (linear polyacrylamide, LPA) capillaries in acidic pH
ranges and compared their performance with that of BFS capillaries. Although the main goal of this work was to determine insulin
and its analogues, in a broader sense, the separation of seven very
similar proteins (Fig. 1) is considered as an analytical challenge.
There are several reasons why such an analysis of insulin analogues is valuable: (1) recently, top-down proteomics is a hot research field demanding new experiences about the CZE separation
of intact proteins mixtures and their MS studies, (2) since these 7
analogues are small proteins with very little differences, it is important to consider, whether the CZE-MS method is useful in differentiating and quantifying such components, (3) the developed
analytical method, which was proved to be suitable for the qualitative and quantitative analysis of 7 insulin analogues, is obviously
suitable for the determination of each analogue in pharmaceutical
formulations, (4) the method is likely applicable for the analysis of
counterfeit insulin mixtures, where only minimal differences compared to the 7 studied analogues can be expected [5] and (5) surprisingly, an evaluative comparison of the detection sensitivities of
proteins obtained with CZE-MS and CZE-UV is missing in the literature. The identification of the separated components by MS detection was also studied.
2. Material and methods
2.1. Reagents, samples
All chemicals were of analytical grade. Acetic acid (AA), formic
acid (FA), ammonium hydroxide, ammonium acetate (NH4 Ac), acetonitrile, isopropyl alcohol (IPA), hydrochloric acid, sodium hydroxide, methanol, 3-(trimethoxysilyl)propyl methacrylate were obtained from Sigma Aldrich (St. Louis, MO, USA). SMIL coating
agents hexadimethrine bromide (polybrene, PB) and dextran sulfate (DS) were purchased from Sigma Aldrich and Merck Millipore
(Darmstadt, Germany), respectively. Tris–HCl, N,N,N’,N’-tetramethyl
ethylenediamine (TEMED), ammonium persulfate and acrylamide
used for the LPA coating generation were purchased from Sigma
Aldrich. Polymerization solution used for LPA capillary coating procedure contained 1 mL degassed 4% m/m acrylamide dissolved in
Tris–HCl (pH=7.0), 1 μL TEMED and 10 μL 10% m/v APS solution
(dissolved water).
Solutions of human insulin (Humulin R) and lispro (Humalog) by Lilly (France); glargine (Lantus) and glulisine (Apidra) by
Sanofi (France) and aspart (Novorapid), degludec (Tresiba), and detemir (Levemir) by Novo Nordisk (Denmark) with 100 units/mL
(3.47 mg/mL) concentration each were used for the analysis. The
pH of the solutions, the isoelectric points and other characteristics of the studied insulins can be found in the Table 1. All sample
solutions were diluted in deionized water (Millipore Synergy UV)
to obtain the final concentration of 0.76 mg/mL. Sample, BGE and
SMIL coating solutions were filtered by using a membrane filter of
2
N. Hamidli, B. Pajaziti, M. Andrási et al.
Table 1
The main characteristics and analytical performance data of human insulin and its analogues obtained in SMIL capillary.
a
3
pH of formulation
pI
Average mass value (Da)
Monoisotopic mass value (Da)
Equation for
calibration graphsb
x-interceptb
R2
Linear range (mg/L)b
LOD (mg/L)b
LOD (MS) (mg/L)
RSD% (min)
RSD% (area)d
Resolutionb
Number of theoretical
plates/m (SMIL)
Number of theoretical
plates/m (BFS)
Number of theoretical
plates/m (LPA)
a
b
c
Detemir
Aspart
Humulin
Lispro
Glulisin
Glargine
7.6
5.5
6102.3
6099.8
y = 19.766x 0.0859
−0.00435
0.9988
4–500
1.2
3.4
0.21
7.5
26.1c
62,115
7.4
5.5
5916.7
5912.7
y = 89.764x 0.2457
−0.00274
0.9901
1–300
0.3
1.4
0.5
7.3
2.07
17,218
7.2–7.6
5.1
5825.6
5821.6
y = 45.381x 0.016
−0.00035
0.9984
2–500
0.6
1.1
0.08
8.5
2.32
161,018
7.0–7.8
5.4
5807.6
5803.6
7.0–7.8
5.6
5807.6
5803.6
7.3
5.5
5821.2
5818.6
y = 73.111x + 0.0117
−0.00016
0.9998
2–500
0.5
1.1
0.1
5.8
0.51
139,076
y = 14.667x + 1.9733
−0.13454
0.9908
3–500
0.9
1.9
0.2
7.7
0.43
89,815
y = 19.533x + 0.3645
0.01866
0.9917
3–500
1.1
2.9
0.33
8.8
0.48
62,783
4
6.7
6063.8
6058.8
y = 58.496x 0.1546
−0.00264
0.9997
2–500
0.5
1.0
0.37
7.9
15.3
192,216
11,158
8051
54,464
56,464
76,162
23,237
142,912
938
3635
40,598
50,762
23,814
4465
42,600
Provided by the producers.
Obtained with UV detection.
Calculated between m-cresol and degludec peaks.
m-cresol is used as internal standard.
Journal of Chromatography A 1678 (2022) 463351
d
Degludec
N. Hamidli, B. Pajaziti, M. Andrási et al.
Journal of Chromatography A 1678 (2022) 463351
0.45 μm pore size before analysis. The stock solutions were stored
at +4 °C.
BGEs applied for the analyses in uncoated (BFS) capillaries were
1 M FA (pH=1.8) and 50 mM NH4 Ac (pH= 7.0 and pH= 10.0); for
SMIL and LPA coated capillary measurements 0.3 M FA (pH=2.3)
and 50 mM FA (pH=2.6) solutions were employed, respectively.
The current values never happened to exceed 30 μA (25, 29 and
10 μA for BFS, SMIL and LPA coated capillaries, respectively).
ments were controlled by otofControl software version 4.1 (build:
3.5, Bruker) and the data was handled by Compass DataAnalysis
version 4.4 (build: 200.55.2969).
3. Results and discussion
3.1. CZE separation of insulin and its analogues
To obtain the selective separation of the 7 insulins in a BFS capillary, the analysis of the insulin mixture was performed in both
high (pH=10.0) and quite low (pH=1.8) pH separation media. In
the case of high pH BGEs, both the proteins and the capillary surface possess a large net negative charge, by which – theoretically
- the adsorption challenge can be overcome. (In spite of the large
net negative charge of the components, the counter directed EOF
drives them toward the cathode.) Similarly, low pH values ensure
a protonated capillary surface (minimal or zero EOF) and thus proteins having a large net positive charge can readily migrate to the
detector without being exposed to adsorption. The analysis of the
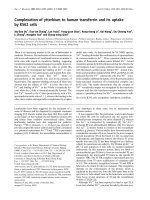
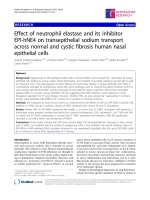
insulin mixture in high pH BGE indicated an incomplete separation
profile (Fig. 2c), where some components displayed narrow and
decent peak shapes, while others could not be resolved. It should
be noted that m-cresol (common additive in insulin pharmaceuticals) possesses negative charge at pH=10, thus its peak appears
close to the insulin analogue migrating first. However, the BGE
solution with very low pH value offered better selectivity, since
strong acidic medium could seemingly separate more insulins in
a BFS capillary (Fig. 2a). On the contrary, upon the use of neutral
pH (pH=7.0), poor resolution was acquired due to the co-migration
of insulins (Fig. 2b), which is the consequence of the very similar charge-to-size ratios (the pH of BGE is close to the pI values
of proteins) and the strong adsorption of insulins onto the capillary surface. (At pH=7 all insulin analogues have small net negative charge, but those also include some positively charged functional groups which can interact with the negatively charged capillary surface.)
Although the use of strongly acidic pH (pH=1.8) seems promising, poor separation efficiency can be reported (theoretical plate
numbers are given it Table 1) due to wide insulin peaks (especially
for degludec and detemir). The triangular shape of the peaks reminds us of electrodispersion, which normally occurs when there
is a considerable difference between the mobilities of the analyte
and co-ion of the background electrolyte. Distorted (slightly rightangled triangle) peak shape for insulin was found in the literature,
as well [5]. By decreasing the analyte concentrations, the resolution could be increased but the distorted character of these peaks
remained.
The separation of the insulin mixture was also studied in neutral LPA and positively charged SMIL capillaries. LPA is a covalent
coating ensuring the neutral surface of the capillary wall and the
suppression of electroosmotic flow (EOF). Thereby the charged proteins are expected to be separated without interacting with the
capillary surface. Although LPA coating is predominantly applied
for the analysis of large proteins, its use for small peptides has also
been documented in the literature [25,26], which makes it a proper
choice for the separation of insulin analogues, as well. The main
limitations of LPA coated capillaries are the operating pH range
and incompatibility with organic solvents. The performance of LPA
is efficient from slightly higher acidic pH values (above pH=2.3
[27]) up to pH 8. By using BGEs of moderate pH, the detection
of proteins with pI values in a neutral range (e.g., insulins, especially glargine pI∼6.7), would not be attainable owing to their minimal mobility and the lack of EOF. The separation of the 7 components could be achieved at pH=2.7 (50 mM FA) (Fig. ESM-1).
However, similar to the performance of BFS, wide and triangular
peak shapes were observable with the LPA coated capillary, as well.
2.2. CE capillaries
BFS capillaries of 65 cm x 50 μm I.D. and 370 μm O.D. (Polymicro, Phoenix, AZ, USA) were used without coating and with SMIL
or LPA coatings. Prior to first use, the BFS capillary was rinsed with
1 M NaOH for 20 min, water for 5 min and with the BGE of choice
for 20 min.
SMIL preparation was carried out based on the procedure rendered by Haselberg et al. [22]. As coating solutions, 10% (m/v) PB
and 3% (m/v) DS (prepared with deionized water) were used after being filtered. Prior to the coating procedure, the capillary was
rinsed with 1 M NaOH for 30 min and water for 15 min. This was
followed by 20 min PB, 10 min water, 20 min DS, 10 min water,
20 min PB and 10 min water rinsing at 1 bar to generate the 3
ionic layers of the coating. The capillary was then directly used in a
CZE analysis. Between runs a 3 min-long BGE preconditioning was
applied. To activate the coating after overnight disuse, 5 min water
and 5 min BGE rinse was performed, followed by the application
of +10 kV for 10 min. Capillary was stored in water following a
10 min-long water rinse [23].
The preparation of LPA was the same as in our earlier work
[20], which was based on the technique suggested by Hjerten
[24].
2.3. Instrumentation
CE separations were carried out using CE 7100 System (Agilent, Waldbronn, Germany) coupled to UV and high resolution MS
detectors. For UV on-capillary (Leff = 57 cm) detection, 200 nm
detection wavelength was chosen. Hydrodynamic sample injection
(50 mbar, 2 s) was carried out at the anodic end of the BFS and
LPA coated capillaries and at the cathodic end of SMIL coated capillaries. For the electrophoretic separation +25 kV for BFS, +30 kV
for LPA capillaries and −30 kV for SMIL capillary were used. CE
instrument was operated and results were processed by OpenLAB
CDS Chemstation version B.04.02 software (Agilent).
Mass detection was performed by MaXis II UHR ESI-QTOF MS
(Bruker, Karlsruhe, Germany) MS instrument. CE-ESI sprayer interface (G1607B, Agilent) allowed the hyphenation of CE with MS.
1260 Infinity II isocratic pump (Agilent) was utilized for the transfer (4 μL/min) of the sheath liquid, which contained isopropyl
alcohol:water (1:1) with 0.1% v/v FA. The following parameters
were employed for the electrospray ion source (positive ionization mode): capillary voltage: 3.5 kV; end plate offset: 500 V;
nebulizer pressure: 0.3 bar (during and 500 s after the injection
it was switched off); dry gas temperature: 200 °C and dry gas
flow rate: 4.0 L/min. The MS method was tuned according to the
60 0–250 0 m/z mass range and 3 Hz spectra rate was applied. For
the seven insulin species mass resolutions were in the range of
65,0 0 0–94,0 0 0 (FWHM). For MS/MS analyses the spectra rate was
changed to 1 Hz and 20–1800 m/z mass range was used. The most
abundant ions (5+ charged state) were selected as precursor ions
and the collision energy was set to 45 eV. External mass calibration was ensured by ESI-MS Tuning mix calibrant solution (part
No: G2431A, Agilent) for MS and by Na-formate for MS/MS analyses. Electropherograms were background corrected. The measure4
N. Hamidli, B. Pajaziti, M. Andrási et al.
Journal of Chromatography A 1678 (2022) 463351
Fig. 2. The analysis of the 7 insulin mixture in BFS capillary using acidic, neutral and basic BGE: (a) 1 M FA (pH=1.8), (b) 50 mM NH4 HAc (pH=7.0), (c) 50 mM NH4 HAc
(pH=10.0).
Conditions: separation voltage: +25 kV, injection: 50 mbar x 2 s, preconditioning: 3-step washing (18 min 1 M NaOH, 6 min acetone and 24 min BGE), UV detection at
200 nm. ∗ m-cresol Sample: hum=human insulin; lis=lispro; gla=glargine; glu=glulisine; asp=aspart; deg=degludec; det=detemir.
To improve peak tailing, the effect of sample dilution was studied
in the LPA coated capillary (Fig. ESM-2). Unfortunately, peak narrowing upon sample dilution was not considerable (e.g., the wide
peaks of degludec and detemir (N = 938 and N = 3635, respectively) could not be narrowed) (Fig. ESM-2b). The wide peaks lead
not only to overlapping but also to poor detection sensitivity. The
general belief is that large proteins have a larger tendency to adsorb onto capillary walls. However, when human serum albumin
(HSA) - a larger protein of ∼66 kDa molecular mass and pI = 4.7
- was analyzed using the same LPA capillary, there was no sign of
excessive peak broadening. In fact, most insulins (glulisine, lispro,
degludec and detemir) showed wider peaks than HSA (the size of
which is more than ten times larger) (Fig. ESM-3). This suggests
that wall adsorption is influenced not by the size but rather by the
pI of the component and the charge of the capillary wall. The slow
migration of the components (smaller charge-to-size ratio) obviously contributes to zone broadening, but other effects (e.g., interactions or pH differences between insulin solutions and the electrolyte ions [28]) are also important. The aforementioned results
on wider and narrower insulin peaks were reproducible for different LPA capillaries and for varying lengths (Fig. ESM-4). Although
the longer (100 cm) LPA capillary was expected to give a better
separation of insulins, the increased analysis time did not lead to
enhanced resolution. Therefore, a capillary length of 65 cm (shortest length possible in the case of our CE-MS system) was applied
in our studies.
Compared to LPA coated capillaries, the coating preparation and
capillary conditioning procedures for SMIL capillaries are considerably simpler. The semipermanent physically adsorbed coating generated by the 3-step successive rinse with polycationic PB, polyanionic DS and PB, provides a stable, positively charged capillary surface [21]. The cationic surface provokes an anode-directed, strong
EOF. As SMIL operates mainly in acidic medium, EOF opposes the
electrophoretic mobilities of counter (cathode) directed proteins.
Even a slight alteration in pH caused a considerable change in the
separation of the 7 insulins using the SMIL capillary (Fig. ESM5). The best resolution between human insulin and aspart was
achieved using pH 2.3, while at pH 2.1 their co-migration is apparent.
The preparation time of the capillary can be reduced by using a
single layer PB coating, the performance of which does not lag far
behind that of the multilayer coated capillary (Fig. ESM-6). However, single layer PB capillary demonstrated lower precision data
in migration times and peak areas due to the incomplete and thin
(∼1 nm) coverage of the fused silica surface [29], which necessitates the regenaration of the coating prior to each run (this is
time-consuming between runs and troublesome in the case of MS
detection). Nevertheless, by having a thicker polymer layer (5 nm
in the case of three-layer SMIL [29]) on the BFS wall, these difficulties can be eliminated. The electropherograms obtained with
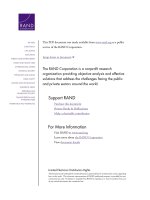
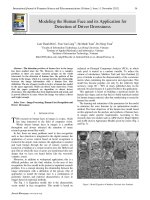
the optimal separation performances in the three different capillaries are compared in Fig. 3. The best resolutions for the 7 insulins
were achieved in the SMIL capillary.
Considering the studies by Katayama [21] and Haselberg [22] as
well as our own experience, SMIL coating presents good stability
up to 40 runs without regeneration and can be used up to a month
when appropriate storage and reactivating conditions are applied.
In addition, SMIL coating demonstrates high capillary-to-capillary
reproducibility with 0.63% RSD in acidic media. In optimized conditions, LPA coating proved its stability over 100 runs. High precision values of ∼0.5% and ∼4.9% were observed for migration time
and peak area, respectively (n = 25).
3.2. Mass spectrometric detection of insulin and its analogues
Although MS detection for large proteins is often less sensitive
than simple UV spectrophotometry (due to the wide charge distributions and different adducts of proteins), in the case of small
5
N. Hamidli, B. Pajaziti, M. Andrási et al.
Journal of Chromatography A 1678 (2022) 463351
Fig. 3. The CZE electrophorerograms obtained for insulins in three different capillaries using optimized conditions. (a) BFS capillary, BGE: 1 M HCOOH (pH 1.8), the other
parameters are the same as stated at Fig. 2. (b) SMIL coated capillary, BGE: 0.3 M FA (pH 2.3), separation voltage: −30 kV, injection: 50 mbar x 2 s, preconditioning: 3 min
BGE washing. (c) LPA coated capillary, BGE: 50 mM FA (pH 2.6), separation voltage: +30 kV, injection: 50 mbar x 2 s, preconditioning: 5 min BGE washing. UV detection
was performed at 200 nm. ∗ m-cresol.
proteins such as insulins, MS offers similar sensitivity in addition to the extensive qualitative information. Insulin, being a small
protein, possesses a mass spectrum with relatively simple isotopic distribution and only a few charged forms. In acidic medium
(pH=2.1) glargine is present up to the [M + 8H]8+ charged form,
whereas the highest charged form for other insulins is limited to
[M + 6H]6+ (Fig. ESM-7), unlike the basic medium (pH 9.0), where
the highest changed form is [M + 5H]5+ (Fig. ESM-8).
The electropherogram obtained for the mixture of the 7 insulins
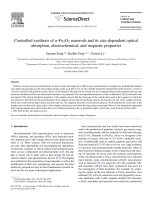
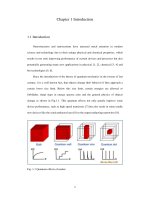
with MS detection is shown in Fig. 4. The experimental mass values of the separated insulin analogues agreed within 1 ppm accuracy with the theoretical masses (Fig. ESM-9). A better resolution
of insulin peaks could be acquired by disabling the ESI nebulization pressure for the first 500 s of the electrophoretic run, which
hindered the siphoning effect (little vacuum at the outlet end of
the CE capillary).
Besides the separation, information about the structure would
also be necessary when analyzing insulin mixtures. Structural information can be acquired from the dissociation of molecular ions.
Several fragmentation techniques exist, the most important ones
being the collision induced dissociation (CID), electron transfer dissociation (ETD), electron capture dissociation (ECD) and UV photodissociation (UVPD) – each yielding well-defined, characteristic
ion series. Utilizing a combination of these strategies can provide
complementary data sets, which facilitates structural elucidation.
The top-down investigation of intact proteins is quite a challenging task, especially in cases where several disulfide bridges are
present in the molecule. Certain fragmentation techniques (e.g.,
ECD) allow the rupture of the S-S bond [30], however, CID is
generally not amenable for such purposes. Under CID conditions,
the preferential cleavage sites are at the peptide backbone outside the disulfide loop, potentially leaving a considerable part of
the molecule intact and inaccessible. However, there are works describing the rupture of disulfide bridges using positive CID conditions [31,32]. The preliminary reduction of proteins (e.g., with
tris(2-carboxyethyl)phosphine-HCl [33,34]) alleviates the difficulties associated with poor fragmentation coverage at the cost of increased analysis time.
Regardless of the three disulfide bonds present in insulins, the
MS/MS analysis of the intact molecule with ESI-CID can, in fact, be
useful for differentiating insulins having very similar (or the same)
masses and structures. This is because the alterations in amino
acid residues are located outside the disulfide loop. The utility of
MS/MS is demonstrated by its ability to discern insulin analogues
differing only in the sequential order of 2 amino acids. The appearance of diagnostic fragments enabled the unambiguous differentiation of these analogues (human insulin and lispro) [33,34].
Apart from these diagnostic ions, there was a scarcity in product
ion peaks when samples were not reduced prior to analysis.
The restricted fragmentation behavior of insulin due to the
presence of disulfide bonds is demonstrated in our experiments, as
well (Fig. 5). Aspart and human insulin were chosen for the comparative MS/MS analysis, which differ only in the amino acid at
the B28 position (Asp → Pro). The Asp→Pro-change causes a mass
6
N. Hamidli, B. Pajaziti, M. Andrási et al.
Journal of Chromatography A 1678 (2022) 463351
Fig. 4. The CZE–MS separation of the insulin mixture in SMIL capillary: Base peak electropherogram (a) and mass spectra of separated insulins (b). ∗ Switching on the ESI
nebulization pressure. Conditions: 65 cm SMIL coated capillary, BGE: 0.3 M FA (pH 2.3), separation voltage: −30 kV, injection: 50 mbar x 2 s, preconditioning: 3 min BGE
washing, nebulization ESI pressure: 0.3 bar, sheath liquid flow rate: 0.4 mL/min, dry gas temp.: 200 °C, spectra rate: 3 Hz, m/z range: 60 0–250 0.
Fig. 5. The spectra of aspart (a) and human insulin (b) from MS/MS analysis. The legends for the annotated peaks contain the chain (in blue) and the fragment type.
Structure of the analogues are indicated, highlighting the difference in amino acid sequences in red as well as identified fragment types.
7
N. Hamidli, B. Pajaziti, M. Andrási et al.
Journal of Chromatography A 1678 (2022) 463351
Table 2
List of peaks assigned on the MS/MS spectrum of aspart.
Experimental m/z
Theoretical m/z
Fragment type
Chain
345.1765
363.1875
399.2235
446.2245
464.2348
567.7822
632.3036
660.8143
739.3890
774.3673
851.0464
893.7325
934.9183
944.4275
954.0928
978.4569
1016.4501
1137.9930
1155.0043
345.1769
363.1874
399.2238
446.2245
464.2351
567.7826
632.3039
660.8146
739.3886
774.3668
851.0471
893.7333
934.9183
944.4306
954.0940
978.4567
1016.4506
1137.9934
1155.0037
y3 -H2 O
y3
b4
y4 – H2 O
y4
y 9 2+
y10 2+
y11 2+
b6
y6
[A(16–21) B(16–30) ]y3+
[A(15–21) B(16–30) ]y3+
[A(20–21) B(17–30) ]y2+
[A(1–14) B(1–12) ]b3+
[A(1–15) B(1–11) ]b3+
y8
[A(20–21) B(16–30) ]y2+
[A(17–21) B(17–30) ]y2+
[A(18–21) B(16–30) ]y2+
B
B
A
B
B
B
B
B
B
B
A-B
A-B
A-B
A-B
A-B
B
A-B
A-B
A-B
rated. Therefore, the plate number and the resolution data show
large variance (Table 1). The highest plate numbers could be obtained in the SMIL capillary. While peak broadening caused decreased plate numbers for several insulins, the baseline separated
and narrower glargine peak shows the highest plate numbers with
192 0 0 0/m.
4. Conclusions
In the present work, we studied the relevance and analytical
performance of BFS, static LPA and semipermanent coated SMIL
capillaries in the analysis of human insulin and its 6 analogues.
These studies are considered to be important not only for the investigated insulins but also for their potential contribution to the
top-down analysis of proteins using CE-MS. When compared, the
coated capillaries showed a better separation of insulin peaks than
the BFS capillary, however, BFS utilizing very low pH (pH=1.8)
BGEs can also be a simple, proper alternative for the determination of a single insulin in real samples. The separation of several
insulins in a single sample would facilitate the analytical and quality control of insulin formulations, particularly the mixed insulin
solutions [36]. This is necessary especially for the analysis of counterfeit insulin mixtures [4].
MS can provide useful structural information and unambiguous
identification, however, the application of MS detection after CZE
separation requires the careful selection of BGE parameters. As a
general belief, the sensitivity of CE-MS is typically at least one order of magnitude lower compared to CE-UV. However, this statement is valid only for small molecules. Upon surveying the literature relating to intact protein analysis (Table ESM-1, including
[37–39]) we found no report demonstrating that CE-MS yields better LOD values than CE-UV. It is also obvious that the larger the
protein the higher the superiority of the CE-UV over the CE-MS
in terms of detection sensitivity. Since insulin is a small protein
with a mass spectrum showing relatively simple isotopic distribution and only a few charged forms, similar detection sensitivity
can be obtained with UV and MS detection. Although the ESI-CID
analysis of proteins in positive ionization mode typically generate
fragmentation patterns bearing limited information, in our case it
enabled the identification of the commercial insulins studied without the incorporation of additional sample preteatment steps, since
the variations in amino acid sequences reside outside the disulfide
bonded region.
shift of −17.9742 Da. The mass shifts observable in the product ion
spectra indicated the presence of fragments that contain the B28
residue. As can be seen in Fig. 5, a fairly large number of such ions
occur in the spectra and there is a clear abundance of fragments
that contain smaller peptides excluded from the disulfide-bonded
region. Cleavage took place typically at the amide bond, leading to
b- and y-type ions (where ”b” and ”y” denote ions extending from
the N- and C-terminus, respectively and subscripts express the
amino acid position at which fragmentation occurred (Fig. ESM-10)
[35]. Upon a closer inspection of the MS/MS spectra, larger peptides spanning the A-B chains also appear. These peptides show
the traditional b or y-type fragmentation [35], only they are held
together by inter-/intrachain disulfide linkages. MS/MS fragments
assigned for Aspart are listed in Table 2.
3.3. Analytical performance
The CZE-MS method developed for human insulin and its 6 analogues was evaluated for its analytical performance on the separation and detection. The main parameters for method validation are
provided in Table 1. The linear ranges of the calibration diagrams
based on the CZE-UV measurements conducted with the SMIL
capillary covered the concentration range between 1 - 500 mg/L.
These calibration graphs gave satisfactory linearity values, with R2
being the lowest for detemir (0.9901) and the highest for glargine
(0.9997). The LOD values ranged between 0.3–1.2 mg/L. In the case
of MS detection, the LOD values based on base peak electropherograms (BPE) ranged between 1.0–3.4 mg/L. The LOD data obtained
with MS would likely be decreased by using high sensitivity mass
spectrometers. The surprisingly good sensitivity of UV compared to
MS detection can be attributed to the wide charge distributions of
the proteins, which lead to a lower detection signal intensity of a
given charged form. Detection sensitivities were further weakened
by peak broadening.
The precision values were studied based on 10 successive measurements on the SMIL coated capillary (Fig. ESM-11), showing
good repeatability in time with a maximum of 0.5 RSD% value for
detemir (m-cresol was used as a time reference marker). The RSD%
of peak areas were poorer (5–9 RSD%) even when internal standard
(m-cresol) correction was applied. The larger RSD% values were
mainly caused by the slight fluctuation in adsorbed proteins and
hence larger integration errors due to the tailed and overlapped
peaks.
Due to the very similar charge/size ratios of the investigated insulins and peak tailing effects, not all peaks were baseline sepa-
Declaration of Competing Interest
The authors declare that they have no known competing financial interests or personal relationships that could have appeared to
influence the work reported in this paper.
CRediT authorship contribution statement
Narmin Hamidli: Data curation, Investigation, Writing – original draft. Blerta Pajaziti: Conceptualization, Investigation, Data curation. Melinda Andrási: Data curation, Investigation, Methodology. Cynthia Nagy: Investigation, Data curation, Writing – original
draft. Attila Gáspár: Conceptualization, Methodology, Supervision,
Writing – original draft.
Acknowledgments
The authors acknowledge the financial support provided to this
project by the National Research, Development and Innovation Office, Hungary (K127931), Stipendium Hungaricum (#242771) and
8
N. Hamidli, B. Pajaziti, M. Andrási et al.
Journal of Chromatography A 1678 (2022) 463351
the New National Excellence Program of the Ministry for Innovation and Technology (ÚNKP-21–3-II). BP is grateful for the Central European Exchange Program for University Studies (CEEPUS)
for her fellowship (CIII-RO-0010).
[19] V. Solinova, L. Zakova, J. Jiracek, V. Kasicka, Pressure assisted partial filling
affinity capillary electrophoresis employed for determination of binding constants of human insulin hexamer complexes with serotonin, dopamine, arginine, and phenol, Anal. Chim. Acta 1052 (2019) 170–178, doi:10.1016/j.aca.2018.
11.026.
[20] N. Hamidli, M. Andrasi, C. Nagy, A. Gaspar, Analysis of intact proteins with capillary zone electrophoresis coupled to mass spectromery using uncoated and
coated capillaries, J. Chromatogr. A 1654 (2021) 462448, doi:10.1016/j.chroma.
2021.462448.
[21] H. Katayama, Y. Ishihama, N. Asakawa, Stable cationic capillary coating with
successive multiple ionic polymer layers for capillary electrophoresis, Anal.
Chem. 70 (1998) 5272–5277, doi:10.1021/ac980522l.
[22] R. Haselberg, G.J. de Jong, G.W. Somsen, Capillary electrophoresis of intact basic proteins using noncovalently triple-layer coated capillaries, J. Sep. Sci. 32
(2009) 2408–2415, doi:10.10 02/jssc.20 090 0164.
[23] R. Nehme, C. Perrin, H. Cottet, M.D. Blanchin, H. Fabre, Influence of polyelectrolyte coating conditions on capillary coating stability and separation
efficiency in capillary electrophoresis, Electrophoresis 29 (2008) 3013–3023,
doi:10.10 02/elps.20 070 0886.
[24] S. Hjerten, High-performance electrophoresis—elimination of electroendosmosis and solute adsorption, J. Chromatogr. A 347 (1985) 191–198, doi:10.1016/
s0021- 9673(01)95485- 8.
[25] X.J. Yan, L.L. Sun, G.J. Zhu, O.F. Cox, N.J. Dovichi, Over 4100 protein identifications from a Xenopus laevis fertilized egg digest using reversed-phase
chromatographic prefractionation followed by capillary zone electrophoresiselectrospray ionization-tandem mass spectrometry analysis, proteom.. 16
(2016) 2945–2952. 10.10 02/pmic.20160 0262.
[26] O.O. Dada, Y.M. Zhao, N. Jaya, O. Salas-Solano, High-Resolution capillary
zone electrophoresis with mass spectrometry peptide mapping of therapeutic proteins: improved separation with mixed aqueous-aprotic dipolar solvents
(N,N-Dimethylacetamide and N,N-Dimethylformamide) as the background
electrolyte, Anal. Chem. 89 (2017) 11227–11235, doi:10.1021/acs.analchem.
7b03405.
[27] M. Beneito-Cambra, P. Anres, J. Vial, P. Gareil, N. Delaunay, Stability and effectiveness of linear polyacrylamide capillary coating to suppress EOF in acidic
media in the presence of surfactants, ionic liquids and organic modifiers, Talanta 150 (2016) 546–552, doi:10.1016/j.talanta.2015.12.070.
[28] S. Hjerten, S. Mohabbati, D. Westerlund, Influence of ignored and well-known
zone distortions on the separation performance of proteins in capillary free
zone electrophoresis with special reference to analysis in polyacrylamidecoated fused silica capillaries in various buffers—I. Theoretical studies, J. Chromatogr. A 1053 (2004) 181–199, doi:10.1016/j.chroma.2004.08.073.
[29] R. Haselberg, F.M. Flesch, A. Boerke, G.W. Somsen, Thickness and morphology
of polyelectrolyte coatings on silica surfaces before and after protein exposure
studied by atomic force microscopy, Anal. Chim. Acta 779 (2013) 90–95, doi:10.
1016/j.aca.2013.03.066.
[30] R.A. Zubarev, N.A. Kruger, E.K. Fridriksson, M.A. Lewis, D.M. Horn, B.K. Carpenter, F.W. McLafferty, Electron capture dissociation of gaseous multiply-charged
proteins is favored at disulfide bonds and other sites of high hydrogen atom
affinity, J. Am. Chem. Soc. 121 (1999) 2857–2862, doi:10.1021/ja981948k.
[31] M. Bhattacharyya, K. Gupta, K.H. Gowd, P. Balaram, Rapid mass spectrometric
determination of disulfide connectivity in peptides and proteins, Mol. BioSyst.
9 (2013) 1340–1350, doi:10.1039/c3mb25534d.
[32] J.M. Wells, J.L. Stephenson Jr., S.A. McLuckey, Charge dependence of protonated
insulin decompositions, Int. J. Mass Spectrom. 203 (20 0 0) A1–A9, doi:10.1016/
S1387-3806(0 0)0 0389-4.
[33] M. Thevis, A. Thomas, P. Delahaut, A. Bosseloir, W. Schanzer, Doping control analysis of intact rapid-acting insulin analogues in human urine by liquid chromatography-tandem mass spectrometry, Anal. Chem. 78 (2006) 1897–
1903, doi:10.1021/ac052095z.
[34] A. Thomas, W. Schanzer, P. Delahaut, M. Thevis, Sensitive and fast identification of urinary human, synthetic and animal insulin by means of nanoUPLC coupled with high-resolution/high-accuracy mass spectrometry, Drug
Test. Anal. 1 (5) (2009) 219–227, doi:10.1002/dta.35.
[35] R.S. Johnson, S.A. Martin, K. Biemann, J.T. Stults, J.T. Watson, Novel fragmentation process of peptides by collision-induced decomposition in a tandem mass
spectrometer: differentiation of leucine and isoleucine, Anal. Chem. 59 (1987)
2621–2625, doi:10.1021/ac00148a019.
[36] T. Donner, S. Sarkar, Insulin—pharmacology, therapeutic regimens, and principles of intensive insulin therapy, Endotext, South Dartmouth (MA), 20 0 0.
[37] A. Taichrib, M. Pioch, C. Neusuess, Toward a screening method for the analysis
of small intact proteins by CE-ESI-TOF MS, Electrophoresis 33 (2012) 1356–
1366, doi:10.1002/elps.201100620.
[38] W.Wang B.Liu, T. Gao, L. Huang, H. Fan, Chen H, Separation, identification and
quantification of associated impurities in cobratide using sheathless CE-MS
and CE-UV, Anal. Methods 13 (2021) 3845–3851, doi:10.1039/D1AY00717C.
[39] L.S. Hernandez, C. Montealegre, S. Kiessig, B. Moritz, C. Neusuess, In-capillary
approach to eliminate SDS interferences in antibody analysis by capillary electrophoresis coupled to mass spectrometry, Electrophoresis 37 (2017) 1044–
1052 10.10 02/elps.20160 0464.
Supplementary materials
Supplementary material associated with this article can be
found, in the online version, at doi:10.1016/j.chroma.2022.463351.
References
[1] H.H. Yeh, H.L. Wu, C.Y. Lu, S.H. Chen, Simultaneous determination of regular
insulin and insulin aspart by capillary zone electrophoresis and application in
drug formulations, J. Pharm. Biomed. Anal. 53 (2010) 145–150, doi:10.1016/j.
jpba.2010.02.012.
[2] A. Kristl, A. Podgornik, M. Pompe, Simultaneous separation of insulin and six
therapeutic analogues on a mixed mode column: HPLC-UV method development and application, J. Chromatogr. B 1171 (2021) 122557, doi:10.1016/j.
jchromb.2021.122557.
[3] K. Ortner, W. Buchberger, M. Himmelsbach, Capillary electrokinetic chromatography of insulin and related synthetic analogues, J. Chromatogr. A 1216 (2009)
2953–2957, doi:10.1016/j.chroma.20 08.11.0 08.
[4] C. Lamalle, A.C. Servais, R.P. Radermecker, J. Crommen, M. Fillet, Simultaneous determination of insulin and its analogues in pharmaceutical formulations
by micellar electrokinetic chromatography, J. Pharm. Biomed. Anal. 111 (2015)
344–350, doi:10.1016/j.jpba.2014.12.038.
[5] C. Vanhee, S. Janvier, G. Moens, E. Deconinck, P. Courselle, A simple dilute and
shoot methodology for the identification and quantification of illegal insulin, J.
Pharm. Anal. 6 (2016) 326–334, doi:10.1016/j.jpha.2016.04.006.
[6] M. Andrasi, B. Pajaziti, B. Sipos, C. Nagy, N. Hamidli, A. Gaspar, Determination of deamidated isoforms of human insulin using capillary electrophoresis,
J. Chromatogr. A 1626 (2020) 461344, doi:10.1016/j.chroma.2020.461344.
[7] B. Pajaziti, R. Petkovska, M. Andrasi, D. Nebija, Application of the capillary zone
electrophoresis (CZE) and capillary gel electrophoresis (CGE) for the separation
of human insulin, insulin lispro and their degradation products, pharm.. 75
(2020) 167–171. 10.1691/ph.2020.9188.
[8] R.G. Nielsen, G.S. Sittampalam, E.C. Rickard, Capillary zone electrophoresis of
insulin and growth hormone, Anal. Biochem. 177 (1989) 20–26, doi:10.1016/
0 0 03-2697(89)90 0 06-7.
[9] A. Thomas, W. Schanzer, M. Thevis, Determination of human insulin and its
analogues in human blood using liquid chromatography coupled to ion mobility mass spectrometry (LC-IM-MS), Drug Test. Anal. 6 (2014) 1125–1132,
doi:10.1002/dta.1710.
[10] J. Zielinska, J. Stadnik, A. Bierczynska-Krzysik, D. Stadnik, Identification of NTerminally truncated derivatives of insulin analogs formed in pharmaceutical
formulations, Pharm. Res. 35 (2018) 143, doi:10.1007/s11095- 018- 2426- 1.
[11] L. Andersen, P.N. Jorgensen, L.B. Jensen, D. Walsh, A new insulin immunoassay
specific for the rapid-acting insulin analog, insulin aspart, suitable for bioavailability, bioequivalence, and pharmacokinetic studies, Clin. Biochem. 33 (20 0 0)
627–633, doi:10.1016/s0 0 09-9120(0 0)0 0183-1.
[12] A. Thomas, M. Thevis, Recent advances in the determination of insulins from
biological fluids, Adv. Clin. Chem. 93 (2019) 115–167, doi:10.1016/bs.acc.2019.
07.003.
[13] A. Thomas, M. Thevis, Analysis of insulin and insulin analogs from dried blood
spots by means of liquid chromatography-high resolution mass spectrometry,
Drug Test. Anal. 10 (2018) 1761–1768, doi:10.1002/dta.2518.
[14] Monographs for Insulin Aspart (2084), Insulin Glargine (2571), Insulin Lispro
(2085), Human Insulin (0838), Bovine Insulin (1637), Porcine Insulin (1638),
in: Eur. Pharmacopoeia, 9th ed., Council of Europe: European Directorate for
the Quality of Medicines and Healthcare, Strasbourg, France, 2018.
[15] M. Haunschmidt, K. Ortner, K. Hainz, E. Bradt, L. Sternbauer, W. Buchberger,
C.W. Klampfl, Investigations on the migration behavior of insulin and related
synthetic analogues in CZE, MEKC and MEEKC employing different surfactants,
Electrophoresis 31 (2010) 1560–1564, doi:10.10 02/elps.20 090 0547.
[16] H.J.C. Eriksson, Analytical Techniques and Formulation Strategies for the Therapeutic Protein Alkaline Phosphatase, University of Groningen, Groningen, 2004
PhD thesis.
[17] M. Lookabaugh, M. Biswas, I.S. Krull, Quantitation of insulin injection by
high-performance liquid-chromatography and high-performance capillary electrophoresis, J. Chromatogr. 549 (1991) 357–366, doi:10.1016/s0 021-9673(0 0)
91446-8.
[18] V. Kasicka, Z. Prusik, P. Sazelova, J. Jiracek, T. Barth, Theory of the correlation
between capillary and free-flow zone electrophoresis and its use for the conversion of analytical capillary separations to continuous free-flow preparative
processes—application to analysis and preparation of fragments of insulin, J.
Chromatogr. A. 796 (1998) 211–220 10.1016/s0021-9673(97)01114-x.
9