High-performance thin-layer chromatography – antibacterial assay first reveals bioactive clerodane diterpenes in giant goldenrod (Solidago gigantea Ait.)
Bạn đang xem bản rút gọn của tài liệu. Xem và tải ngay bản đầy đủ của tài liệu tại đây (1.78 MB, 9 trang )
Journal of Chromatography A 1677 (2022) 463308
Contents lists available at ScienceDirect
Journal of Chromatography A
journal homepage: www.elsevier.com/locate/chroma
High-performance thin-layer chromatography – antibacterial assay
first reveals bioactive clerodane diterpenes in giant goldenrod
(Solidago gigantea Ait.)
Márton Baglyas a, Péter G. Ott a, Zsófia Garádi b, Vesna Glavnik c, Szabolcs Béni b,
Irena Vovk c, Ágnes M. Móricz a,∗
a
Centre for Agricultural Research, ELKH, Plant Protection Institute, Herman O. Str. 15, Budapest 1022, Hungary
˝ Str. 26, Budapest 1085, Hungary
Department of Pharmacognosy, Faculty of Pharmaceutical Sciences, Semmelweis University, Ülloi
c
Laboratory for Food Chemistry, National Institute of Chemistry, Hajdrihova 19, Ljubljana SI-1000, Slovenia
b
a r t i c l e
i n f o
Article history:
Received 15 May 2022
Revised 4 July 2022
Accepted 5 July 2022
Available online 9 July 2022
Keywords:
High-performance thin-layer
chromatography – effect-directed analysis
High-performance thin-layer
chromatography – MSn
HPTLC – Rhodococcus fascians
Giant goldenrod (Solidago gigantea Ait.)
Antibacterial clerodane diterpenes
a b s t r a c t
The present work introduces a high-performance thin-layer chromatography (HPTLC)–direct bioautography method using the Gram-positive plant pathogenic bacterium, Rhodococcus fascians. The screening
and isolation procedure comprised of a non-targeted high-performance thin-layer chromatography-effectdirected analysis (HPTLC–EDA) against Bacillus subtilis, B. subtilis subsp. spizizenii, R. fascians, and Aliivibrio fischeri, a targeted HPTLC–mass spectrometry (MS), and bioassay-guided column chromatographic
(preparative flash and semi-preparative HPLC) fractionation and purification. The developed new separation methods enabled the discovery of four bioactive cis-clerodane diterpenes, solidagoic acid H (1), solidagoic acid E (2), solidagoic acid I (3), and solidagoic acid F (4), in the n-hexane extract of giant goldenrod (Solidago gigantea Ait.) leaf for the first time. These compounds were identified by 1D and 2D nuclear
magnetic resonance (NMR) spectroscopy. The initially used HPTLC method (chloroform – ethyl acetate –
methanol 15:3:2, V/V/V) was changed (to n-hexane – isopropyl acetate – methanol – acetic acid 29:20:1:1,
V/V/V/V) to achieve the separation of the closely related isomer pairs (1–2 and 3–4). Compounds 1 and
3 exhibited moderate antibacterial activity against the Gram-positive B. subtilis subsp. spizizenii and R.
fascians bacterial strains in microdilution assays with half-maximal inhibitory concentration (IC50 ) values
in the range of 32.3–64.4 μg/mL. The mass spectrometric fragmentation of the isolated compounds was
interpreted and their previously published NMR assignments lacking certain resonances were completed.
© 2022 The Author(s). Published by Elsevier B.V.
This is an open access article under the CC BY license ( />
1. Introduction
Traditional healthcare recognized the therapeutical importance
of plant-derived drugs since ancient times, and among others
plant extracts, decoctions, and essential oils are applied for the
treatment of various diseases. However, in modern medicine the
elimination of the interfering molecules and the use of one- or
two-compound based medicines are preferred. Thus, there is an
increasingly growing demand for the isolation and determination
of effective compounds with inexhaustible structural and functional diversity from bioactive natural sources [1,2].
Solidago gigantea Ait. (giant goldenrod) originated from North
America and is considered as a quite successful, threatening, highly
invasive weed species in most of Europe [3]. Because of its bene∗
ficial pharmacological effects (diuretic, antiphlogistic, antioxidant,
antispasmodic) [4], it is also recognized as a medicinal plant. The
dried giant goldenrod’s leafy, and/or flowering aerial parts are used
in phytotherapy (Solidaginis herba) [5]. Giant goldenrod contains
a wide variety of secondary metabolites, e.g. flavonoids [6], phenolic acids [7], and monoterpenoids [8], sesquiterpenoids [9], diterpenoids [10,11] as well as triterpenoids [12]. The antibacterial
activity of roots and aboveground parts of various goldenrods
has been demonstrated several times [13–15]. Acetylenes (matricaria and dehydromatricaria esters) [16], clerodane diterpenes
(e.g. kingidiol and solidagoic acid A) [10], labdane diterpenes (solidagenone and presolidagenones) [17], benzyl benzoate derivative
[16], and essential oil terpenes [18] have been established as antibacterial components of goldenrod roots, while the pharmacolog-
Corresponding author.
E-mail address: (Á.M. Móricz).
/>0021-9673/© 2022 The Author(s). Published by Elsevier B.V. This is an open access article under the CC BY license ( />
M. Baglyas, P.G. Ott, Z. Garádi et al.
Journal of Chromatography A 1677 (2022) 463308
ical effect of the aboveground parts has been attributed to phenolic
acids and flavonoids [13,19], essential oil components [20,21], and
clerodane-type diterpene solidagoic acids [22].
High-performance thin-layer chromatography coupled with
effect-directed analysis (HPTLC–EDA) is an efficient, rapid, and convenient tool for non-targeted screening of herb extracts for bioactive compounds without a time-consuming and costly isolation
process [23,24]. The antibacterial profile of a sample can be determined by an HPTLC–direct bioautography (DB) method and the
highly targeted characterization of compounds in the inhibition
zones can be performed in situ on the adsorbent layer by various hyphenated techniques, such as mass spectrometry (HPTLC–
MS). Thus, HPTLC hyphenations can promote the detection, separation, purification, isolation, and identification of antibacterial constituents of complex matrices [23,25]. The spectrum of microorganisms (or enzymes) is apt to be extended to exploit further the
potential and the efficiency of the HPTLC–EDA in screening for
promising chemicals suitable for treating different human, animal,
and plant diseases. Rhodococcus fascians is a Gram-positive, aerobic phytopathogenic bacterium with a wide range of host plants,
including strawberry, red beet, and tobacco [26]. This species is responsible for the leafy gall syndrome, an infectious plant disease
that affects the plant appearance, triggering severe malformations
in the inflorescence and the leaves because of the caused tissue hyperplasia [27]. Consequently, the development and the application
of HPTLC–R. fascians assay is desirable.
The aim of this study was (1) the introduction of HPTLC–R.
fascians bioassay, (2) the development of a HPTLC method that
was required for non-targeted, effect-directed screening for antibacterial compounds present in the leaf extract of S. gigantea,
(3) the characterization of the HPTLC zones of inhibition against
Gram-positive (Bacillus subtilis, B. subtilis subsp. spizizenii, R. fascians) and Gram-negative (Aliivibrio fischeri) bacteria by HPTLC–
MS, (4) the development of preparative flash chromatography, and
semi-preparative HPLC methods for the bioassay-guided, semipreparative fractionation and isolation of the active compounds, (5)
the unambiguous structure elucidation of the isolated compounds
by NMR measurements, and (6) the verification of the antibacterial
activity of the isolates by both HPTLC–DB and in vitro microplate
experiments.
extract was from Scharlau or Microtrade (Budapest, Hungary), and
sea salt mixture from Instant Ocean (Gambetta, France). 3-(4,5Dimethylthiazol-2-yl)-2,5-diphenyltetrazolium bromide (MTT) was
acquired from Carl Roth (Karlsruhe, Germany), concentrated sulfuric acid (96%) from Carlo Erba (Milan, Italy), and acetic acid
from Lach-Ner (Neratovice, Czech Republic). Gram-positive, nonpathogenic Bacillus subtilis soil bacterium (strain F1276) was received by József Farkas, Central Food Research Institute, Budapest,
Hungary, and B. subtilis subsp. spizizenii (DSM 618) was acquired
from Merck. Gram-positive, plant pathogenic Rhodococcus fascians
bacterium (strain NCAIM B.01608) was from the National Collection of Agricultural and Industrial Microorganisms, Budapest,
Hungary. Gram-negative, naturally luminescent marine bacterium
Aliivibrio fischeri (DSM 7151) was from Leibniz Institute, DSMZ,
German Collection of Microorganisms and Cell Cultures, Berlin,
Germany.
2.2. Sample origin and preparation
Leaves of Solidago gigantea Ait. were collected in July 2020 near
Harta, in the Great Plain, Hungary (46° 41 51.5" N 19° 02 52.4" E,
altitude: 90 m a. s. l.). A voucher herbarium specimen (accession
number: HNHM-TRA 0 0 027284) has been deposited in Hungarian
Natural History Museum, Budapest, Hungary (Fig. S1). Leaf samples
were dried at room temperature, protected from direct sunlight
ˇ cany,
and finely milled by a coffee grinder (Sencor SCG 2050RD, Ríˇ
Czech Republic). The dried, ground samples (100 g) were consecutively macerated at room temperature with n-hexane (150 mg/mL,
3 × 72 h). The combined and filtered (Reanal filter paper, pore
size: 7–10 μm) crude extract was concentrated under reduced
pressure with a rotary evaporator (Rotavapor R-134, Büchi, Flawil,
Switzerland) at 40 °C. This concentrated crude extract was employed for HPTLC analyses and isolation. Isolated compounds (1–4)
were dissolved in chloroform or DMSO (2 mg/mL). Each sample
was stored at +4 °C in the dark until analysis.
2.3. HPTLC–UV/FLD
Each sample was manually applied using a 10 μL microsyringe
(Hamilton Company, Reno, NV, USA) as a 5 mm band with 10–
20 mm track distance onto the HPTLC layer. The distance from
the lower plate edge was 8 and 15 mm from the left side. After drying, HPTLC separation was performed in a pre-saturated
(for 10 min) developing chamber (twin trough chamber, CAMAG,
Muttenz, Switzerland) with chloroform – ethyl acetate – methanol
15:3:2, V/V/V (MP1) or n-hexane – isopropyl acetate – methanol –
acetic acid 29:20:1:1, V/V/V/V (MP2) mobile phase up to a migration distance of 80 mm, which took approximately 20 min. The
HPTLC chromatograms were dried in a cold stream of air using
a hairdryer for 5 min and documented under a UV lamp (CAMAG) at 254 nm (UV) and 366 nm (FLD) using a digital camera (Cybershot DSC-HX60, Sony, Neu-Isenberg, Germany). HPTLC
chromatograms developed with acidic MP2 and intended for antibacterial assays were neutralized by pneumatic spraying (airbrush, Revell, Bünde, Germany) with a phosphate buffer solution
(0.1 M, pH 7.5) [28]. Plates were cut (with a blade or smartCUT
Plate Cutter, CAMAG) into smaller, identical pieces for various antibacterial assays or chemical derivatization. For the derivatization
with p-anisaldehyde sulfuric acid reagent (anisaldehyde reagent)
the layers were dipped into the mixture of 500 μL p-anisaldehyde,
10 mL acetic acid, 100 mL methanol, and 5 mL concentrated sulfuric acid (96%), heated at 110 C for 5 min (Advanced Hot Plate,
VWR, Debrecen, Hungary), and documented at white light illumination in transmittance (Vis; 96891 Salobrena 2 LED lamp, Eglo
Lux, Dunakeszi, Hungary) or reflectance mode. For the detection of
acidic compounds, the layers were dipped into bromocresol green
2. Materials and methods
2.1. Materials
Glass- and aluminum-backed HPTLC and TLC silica gel 60 F254
layers (all 20 × 10 cm), methanol (LC-MS grade) and chloroformd [99.8 atom% D, containing 0.03% (V/V) tetramethylsilane (TMS)]
for NMR measurements were purchased from Merck (Darmstadt,
Germany). Xprep preparative silica gel (pore size: 6.65 nm, particle size: 230–400 mesh) was supplied by LAB-EX (Budapest, Hungary). Solvents of analytical grade (acetone, chloroform (stabilized
with amylene), ethyl acetate, methanol, dimethyl sulfoxide (DMSO),
and n-hexane) and gradient grade acetonitrile were obtained from
Reanal (Budapest, Hungary) or Molar Chemicals (Halásztelek, Hungary). Isopropyl acetate, gentamicin, and p-anisaldehyde were from
Sigma-Aldrich (Budapest, Hungary). Bidistilled water by a Vitrotech
VDB-3A apparatus (Vitro-Tech-Lab Ltd., Gyál, Hungary), while ultrapure water by a Millipore Direct-Q 3 UV Water Purification System (Merck) was prepared. Bromocresol green, glycerol, D-glucose,
meat extract, potassium carbonate, potassium dihydrogen phosphate, disodium hydrogen phosphate, sodium chloride, and sodium
hydroxide were bought from Reanal. Tryptone (from casein, pancreatic digest) was obtained from Reanal or Serva (Heidelberg,
Germany), and agar was from Merck. Peptone (from meat, pancreatic digest) was supplied by Scharlau (Barcelona, Spain), yeast
2
M. Baglyas, P.G. Ott, Z. Garádi et al.
Journal of Chromatography A 1677 (2022) 463308
reagent (10 mg bromocresol green, 25 mL ethanol, 0.1 M aqueous
sodium hydroxide solution added until a dark blue color appeared),
and after drying documented at white light illumination (Vis) in
reflectance mode.
heat block temperature 400 °C, desolvation line temperature
250 °C, detector voltage 1.1 kV in negative, 0.95 kV in positive
ionization mode. The working parameters of ESI-LIT-MSn were as
follows: heat temperature 350 °C, capillary temperature 300 °C,
sheath gas 30 a.u. (arbitrary units), auxiliary gas 10 a.u., spray voltage 3.00 kV [31], and S-lens RF level 69.0. A plate background (at
the same hRF ) mass spectrum was subtracted from each analyte
mass spectrum. Instrument operation and control, as well as data
acquisition, processing, and evaluation, were carried out with LabSolutions 5.42v software (Shimadzu) for HPTLC–QMS and Xcalibur
software (version 2.1.0; Thermo Fisher Scientific) for HPTLC–LITMSn and FIA–LIT-MSn .
2.4. HPTLC-EDA
The preparation of A. fischeri [29] and B. subtilis (F1276)
[30] bacterial suspensions, and the workflow of detecting an antibacterial effect were previously reported in detail. The procedure,
developed for B. subtilis (F1276) was adapted to B. subtilis subsp.
spizizenii. Briefly, the developed, neutralized and dried HPTLC chromatograms were manually dipped into the cell suspensions for 8 s.
In cases of non-luminescent bacteria, this step was followed by a
2 h incubation at 37 °C (100% humidity, horizontal position in a
polypropylene box lined with a wetted paper towel). The bioautograms were visualized with a vital dye staining using an aqueous
MTT solution (1 mg/mL) and a further 0.5 h incubation at 37 °C
(100% humidity). Bright zones against purplish background (caused
by viable cells) indicated the presence of antibacterial compounds.
In contrast, during the A. fischeri assays the reduced bioluminescence (the inhibitory effect) was immediately captured by a cooled
CCD camera (iBright FL1500 Imaging System, Thermo Fisher Scientific, Budapest, Hungary) as dark spots on the bright background
(grayscale image).
For the novel HPTLC–R. fascians antibacterial assay, culture suspension was prepared by growing the cells in Waksman’s broth
(5 g/L peptone, 5 g/L meat extract, 5 g/L sodium chloride, 10 g/L
glucose, pH adjusted to 7.2 with a 40% aqueous sodium hydroxide
solution) at 30 °C on an orbital shaker with a rotational speed of
130 rpm to reach the late log growth phase (OD600 , optical density
at a wavelength of 600 nm = 1.4). The further procedure was identical to the general method described above for non-luminescent
bacteria (optimal incubation temperature: 30 °C).
2.6. Preparative fractionation and purification
The concentrated n-hexane leaf extract was first fractionated by
preparative solid-phase extraction. The extract was dried onto the
surface of the preparative silica gel (3 × 10 g) that was loaded
above a manually packed silica gel stationary phase (80 × 25 mm).
Fractionation was achieved by collecting eluates of about 10 mL
with a stepwise gradient (acetone – chloroform 1:19, V/V, 80 mL;
acetone – n-hexane 1:1, V/V, 90 mL; acetone, 80 mL). The solvent flow was accelerated by applying external pressure with an
air compressor (HYD-24F, Hyundai, Seoul, South Korea). Fractions
were investigated by HPTLC assays. Those with similar fingerprints
and bioactivity were combined and dried under reduced pressure
with a rotary evaporator at 40 °C.
The solid residue was suspended in n-hexane and submitted
to an additional fractionation step. Normal-phase flash column
chromatography separation was accomplished with a CombiFlash
NextGen 300 (Teledyne Isco, Lincoln, NE, USA) chromatograph, utilizing a RediSep Rf Gold silica gel column (20–40 μm, 40 g, Teledyne Isco) as a stationary phase, and a flow rate of 30 mL/min
with a gradient of n-hexane (A) and acetone (B): 0% B (0–0.5 min);
0–30% B (0.5–20.5 min); 30–50% B (20.5–25.5 min); 50–100% B
(25.5–27.5 min). The chromatogram was recorded by continuous
absorbance measurement at 205 and 215 nm.
Isolation of the selected compounds from the flash fractions
was performed using an LCMS-2020 system (Shimadzu), including
a binary gradient solvent pump (LC-20AB), a vacuum degasser, a
thermostated autosampler, a column oven, a diode-array detector,
and an electrospray ionization (ESI)-MS system, all controlled with
LabSolutions 5.42v software (Shimadzu). An analytical RP-HPLC–
DAD–ESI-MS method was developed and scaled up to a semipreparative column. The analytical HPLC separation was achieved
on a Luna pentafluorophenyl (PFP) column (250 × 4.6 mm i.d.,
5 μm particle size, Phenomenex, Torrance, CA, USA) at 35 C at a
flow rate of 0.7 mL/min with a gradient of 5% aqueous acetonitrile (A) and acetonitrile (B): 40–80% B (0–15 min); 80–95% B (15–
25 min); 95–100% B (25–28 min); 100% B (28–35 min); 100–40% B
(35–40 min). The injection volume was 3 μL. Chromatograms were
monitored at 210 and 240 nm and TIC chromatograms were detected by MS with the following working parameters: nebulizer
gas (N2 ) flow rate 1.5 L/min, drying gas (N2 ) flow rate 15 L/min,
interface temperature 350 °C, heat block temperature 400 °C, desolvation line temperature 250 °C, detector voltage 4.5 kV. Full scan
ESI-MS spectra (scan range: m/z 30 0–950, scan speed: 50 0 0 amu/s)
were recorded both in negative and positive ionization mode. Isolation was performed on a semi-preparative Luna PFP column
(250 × 10 mm i.d., 5 μm particle size, Phenomenex) under the
same conditions, but at a flow rate of 3.5 mL/min. The injection
volume was 35 μL, and appropriate peaks were collected based on
the chromatogram at 210 nm. The fractionation/purification protocol was repeated 70 times. The purity and bioactivity of combined
fractions were surveyed by HPTLC assays. Bioactive eluates were
2.5. HPTLC-MS and FIA-MS
HPTLC–MS analyses were performed using a TLC–MS Interface 2
(with 4 × 2 mm oval elution head, CAMAG), and either (1) – a single quadrupole mass spectrometer (QMS; LCMS-2020, Shimadzu,
Kyoto, Japan) with a binary solvent pump (LC-20AB, Shimadzu), or
(2) – a dual-pressure linear ion trap mass spectrometer (LIT–MSn ;
LTQ Velos mass, Thermo Fisher Scientific, Waltham, MA, USA) with
a quaternary pump (Accela 1250 pump a part of the UHPLC system, Thermo Fisher Scientific). For flow injection analysis (FIA)–
LIT-MSn , samples were dissolved in acetonitrile and injected into
MS with a constant flow rate of 25 μL/min (1, 3), 10 μL/min (2),
and 30 μL/min (4). LIT-MSn was used for obtaining fragmentation
patterns of desired compounds. Both MSs worked in electrospray
ionization (ESI) mode. Prior to HPTLC–MS analyses, HPTLC plates
were predeveloped with methanol – bidistilled water (4:1, V/V) up
to a migration distance of 95 mm (twin trough chamber), followed
by drying at 100 °C for 20 min (Advanced Hot Plate, VWR). Sample application and chromatographic development were performed
as described in Section 2.3. Based on bioautograms the zones of
interest were marked in parallel chromatograms with a soft pencil and eluted with methanol for approximately 45 s (HPTLC–ESIQMS) or 60 s (HPTLC–ESI-LIT-MSn ) at a flow rate of 0.2 mL/min.
Full scan ESI–MS spectra (scan range: m/z 200–950, scan speed:
790 amu/s) were recorded both in the negative and positive ionization mode for HPTLC–ESI-QMS and HPTLC–ESI-LIT-MSn , and
in the negative ionization mode for FIA–ESI-LIT-MSn . The fragmentation pattern of the compounds was obtained at 45% collision energy and isolation width of m/z 1.0. The working parameters of
ESI-QMS were as follows: nebulizer gas (N2 ) flow rate 1.5 L/min,
drying gas (N2 ) flow rate 10 L/min, interface temperature 350 °C,
3
M. Baglyas, P.G. Ott, Z. Garádi et al.
Journal of Chromatography A 1677 (2022) 463308
dried under reduced pressure with a rotary evaporator at 40 °C
and transferred to NMR spectroscopy.
2.7. MIC and IC50 determination
Minimal inhibitory concentration (MIC) and half-maximal inhibitory concentration (IC50 ) values of the isolated compounds (1–
4) against Gram-positive B. subtilis subsp. spizizenii and R. fascians
bacterial growth were determined by an in vitro broth microdilution method in 96-well non-treated flat-bottom microplate (VWR,
catalog number: 734-2781) assays. Each sample (1–4) was dissolved in DMSO (2 mg/mL) and from an aliquot of 5 μL a twofold dilution series (made in duplicate) was prepared in DMSO in
a sterile box. Then 150 μL of bacterial suspension (105 CFU/mL)
was added to each well and incubated by shaking at 900 rpm with
a PHMP Twin Microplate Shaker-Incubator Thermoshaker (Grant
Inc., Beaver Falls, PA, USA). The incubation temperature and time
for B. subtilis subsp. spizizenii bacteria were 37 °C and 24 h, and
for R. fascians bacterium 30 °C and 48 h, respectively. Gentamicin
(0.1 mg/mL) was employed as a positive control, while DMSO was
used as a negative control. OD600 values, indicating cell multiplication, were recorded by a Labsystems Multiscan MS 4.0 microplate
reader spectrophotometer (Thermo Scientific, Waltham, MA, USA)
immediately and after the incubation period (background was subtracted). Two parallel results were averaged and reported herein.
Measured data were analyzed by GraphPad Prism 9 (version 9.2.0)
software.
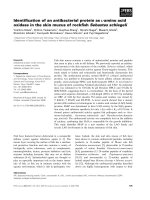
Fig. 1. HPTLC chromatograms (a–c) and bioautograms (d,e) of the S. gigantea
ethanol (I) and n-hexane (II) leaf extract developed with chloroform – ethyl acetate – methanol 15:3:2 (V/V/V, MP1) and detected at 254 nm (a), 366 nm (b),
after derivatization with anisaldehyde reagent at white light illumination (c), and
after applying B. subtilis (d) and A. fischeri (e, grayscale image of the bioluminescence) antibacterial assays.
constituent were studied to reach a satisfactory separation of the
zones of interest that were detectable at white light illumination after derivatization with the universal anisaldehyde reagent.
Among the explored mobile phases, chloroform – ethyl acetate –
methanol 15:3:2, V/V/V (MP1) led to an appropriate separation of
the extracted compounds, hence it was used for further HPTLC
analyses.
2.8. NMR spectroscopy
All NMR measurements were carried out on a Bruker Avance
III HD 60 0 (60 0/151 MHz, 14.1 T) spectrometer equipped with
a cryogenically cooled Prodigy BBO probe head at 295 K. Each
isolated compound (1–4) was dissolved in 600 μL of deuterated
chloroform [chloroform-d, 99.8 atom% D, containing 0.03% (V/V)
tetramethylsilane (TMS)] and transferred to a standard 5 mm
NMR tube for analysis. Instrument operation and control as well
as data acquisition were accomplished with the Bruker TopSpin
3.5 software using standard pulse sequences available in their
software library (Table S2–S5). Spectral data were processed and
analyzed by MestReNova software (Mestrelab Research, Santiago
de Compostela, Spain). 1 H and 13 C chemical shifts (δ ) are reported in ppm, both referenced to the internal standard (TMS,
δ H = δ C = 0.00 ppm), whereas spin-spin coupling constants (J)
are provided in Hz. Structure elucidation and (complete) 1 H and
13 C resonance assignments were deduced from direct 1 H–13 C, longrange 1 H–13 C, 1 H–1 H scalar spin-spin connectivities, and 1 H–1 H
dipolar couplings using conventional 1D (1 H, 13 C{1 H}) as well
as homo- and heteronuclear 2D [1 H–1 H COSY, 1 H–13 C edHSQC
(1 JC–H = 145 Hz), 1 H–13 C HMBC (n JC–H = 8 Hz), 1 H–1 H TOCSY (mixing time: 80 ms) and 1 H–1 H NOESY (mixing time: 300 ms)] experiments.
3.2. Sample pre-treatment monitored by HPTLC–EDA and HPTLC–MS
Due to the sample complexity, a two-step pre-cleaning
method including a preparative solid-phase extraction (SPE) was
followed by a normal-phase (NP) flash chromatography fractionation, which was applied before the large-scale isolation
procedure.
The n-hexane extract of 100 g of dried leaves was purified by
preparative SPE on a silica gel column in three parts yielding 21
(SPE1), 25 (SPE2), and 24 (SPE3) fractions, which were then investigated by HPTLC–Vis after derivatization with the anisaldehyde
reagent (Fig. S2). Fractions 11 and 12 of each extraction (SPE1,
SPE2, and SPE3) were combined and their bioactivity against
B. subtilis was monitored by HPTLC–EDA. Based on the HPTLC–
B. subtilis bioautogram, the targeted compounds responsible for
the inhibition zones were present in the combined SPE fractions
(Figs. 2 and S3). After purification, the active zone was observed
as a distinct pinkish-purplish spot on the HPTLC–anisaldehyde
chromatogram, which was characterized by HPTLC–ESI-QMS and
HPTLC–ESI-LIT-MSn . As for the HPTLC–ESI-QMS study (Fig. S3),
mass signals were obtained in both ionization modes at m/z 347
[M–H]– and m/z 445 [M–H]– as well as at m/z 371 [M+Na]+ and
469 [M+Na]+ , respectively, indicating the coelution of at least two
compounds. HPTLC–ESI-LIT-MSn measurements revealed the following MS fragmentation for the deprotonated molecule ([M–H]– )
at m/z 347 and at m/z 445, respectively: m/z 329, 303, 285, 267,
259, 257 (Fig. 2c) as well as m/z 345, 301, 283, 273, 257 (Fig. 2d,e).
The fractionation of the combined SPE fractions was carried out
by NP flash chromatography providing 67 fractions (Fig. S4) that
were examined by HPTLC–Vis after derivatization with anisaldehyde reagent (Fig. S5). Fractions having similar HPTLC fingerprints
were combined and tested by HPTLC–antibacterial assays (Fig. 3)
and HPTLC–MS (Fig. S6). HPTLC–MS studies revealed the presence
of antibacterial compounds with identical mass signals as previously presented, in flash fractions 43–45 (denoted as A) and 46–
3. Results and discussion
3.1. Optimizing the extraction solvent and the HPTLC mobile phase
For the intended antibacterial profiling of giant goldenrod leaf,
two different extraction solvents, ethanol, and n-hexane were
tested, and the results were compared. The composition of the
ethanol extract was more diverse. However, n-hexane was selected
for the extraction, because it provided less matrix among the
more polar compounds and interestingly could extract the nonpolar and semi-polar bioactive compounds with higher efficiency
than ethanol as evident in the A. fischeri and B. subtilis bioautograms (Fig. 1). Several HPTLC mobile phases without an acidic
4
M. Baglyas, P.G. Ott, Z. Garádi et al.
Journal of Chromatography A 1677 (2022) 463308
Fig. 2. HPTLC-B. subtilis bioautogram (a) of the combined SPE2 fractions 11–12 developed with chloroform – ethyl acetate – methanol 15:3:2 (V/V/V, MP1) and HPTLC–ESI– LIT-MSn spectra recorded from the zone of interest: full MS spectrum (b), MS/MS spectrum with the parent ion of m/z 347 [M–H]– (c), MS/MS spectrum with the parent ion
of m/z 445 [M–H]– (d), MS3 spectrum of the m/z 445 [M–H]– ion with the parent ion of m/z 345 [M–H–Ang]– (e), all of them labeled with the tentative assignment of the
deprotonated molecules and the fragment ions. „Ang” abbreviation stands for angelic acid (C5 H8 O2 ).
Fig. 3. HPTLC chromatograms and bioautograms of the flash fractions A and B as well as of the four isolated compounds (1–4) developed with chloroform – ethyl acetate –
methanol 15:3:2 (V/V/V, MP1) (a–g), or n-hexane – isopropyl acetate – methanol – acetic acid 29:20:1:1 (V/V/V/V, MP2) (h–k). Detection was performed at 254 nm before
derivatization (a and e) or at white light illumination after derivatization with anisaldehyde reagent (b and f) or bromocresol green staining (g) or after antibacterial assays
with B. subtilis (c, i), B. subtilis subsp. spizizenii (h), R. fascians (d and j) and A. fischeri (k, grayscale image of the bioluminescence). Neutralization was used after development
with acidic mobile phase (h–k).
3.3. RP-HPLC isolation of the antibacterial compounds
48 (denoted as B), respectively (Fig. S6). Both fractions showed
inhibition against B. subtilis and also in the novel HPTLC–R. fascians antibacterial assay and the acquired bright inhibition zones
against the purple background at the same hRF proved the antibacterial feature of the compounds with different molecular mass
(Fig. 3a–d).
The two combined flash chromatographic fractions A and B
were subjected to RP-HPLC–DAD–ESI-MS analysis on a PFP column
with an acetonitrile-water binary gradient system to separate the
target compounds. During the HPLC method development, it was
5
M. Baglyas, P.G. Ott, Z. Garádi et al.
Journal of Chromatography A 1677 (2022) 463308
Fig. 4. UV (a) and extracted ion (b) chromatograms of the combined flash fraction obtained by analytical HPLC–DAD–ESI-MS analysis and UV chromatogram recorded by
semi-preparative HPLC–DAD during the isolation of the four compounds (1–4) (c) labeling the retention times and the isolated amounts.
evident that both fractions surprisingly contained not only one but
two constituents with the expected mass signals. It was doubtful
whether they were structural isomers, therefore additional studies were required for clarification. Since these four compounds
could be separated sufficiently in a single-run measurement, time
and HPLC solvent could be saved by the use of the combination
of the two fractions for the isolation. Thus, the separation of the
four compounds from each other and also from the contaminants
was achieved within 15 min with retention times of 12.0 min (1),
12.4 min (2), 13.6 min (3), and 14.1 min (4) illustrated on the
chromatogram recorded at 210 nm (Fig. 4a). This is also evident
on the EIC chromatograms (Fig. 4b) displaying the same deprotonated molecules and sodium adducts as previously detected: m/z
347 [M–H]– and m/z 371 [M+Na]+ for 1 and 2, as well as m/z 445
[M–H]– and 469 [M+Na]+ for 3 and 4, respectively.
With the scale-up of this analytical method, the semipreparative purification and the isolation of the compounds 1–4
were performed on a PFP column (250 × 10 mm i.d.) by collecting fractions with the retention times of 11.2 min (1), 11.6 min (2),
12.8 min (3), and 13.3 min (4) (Fig. 4c). The quantity of the isolated
compounds was sufficient to transfer them to NMR spectroscopy:
1.8 mg (1), 9.0 mg (2), 3.5 mg (3), and 5.1 mg (4).
6
M. Baglyas, P.G. Ott, Z. Garádi et al.
Journal of Chromatography A 1677 (2022) 463308
Fig. 5. Chemical structures and atom numbering (blue) of the four isolated clerodane diterpenoids.
3.4. The comprehensive characterization of isolated compounds
chemical shifts for C-19 of solidagoic acid H, for C-16 of solidagoic
acid E, for C-5 and C-19 of solidagoic acid I as well as for C-4, C-13,
C-16, and C-1’–C-5’ of solidagoic acid F could be determined, thus
a complete 1 H and 13 C NMR resonance assignment was given for
solidagoic acid E and F.
Clerodane diterpenes belong to the class of naturally occurring secondary metabolites possessing diverse biological and pharmacological activities (antibacterial, antifungal, antitumor, insect
antifeedant, anti-inflammatory, antiulcer, antiplasmodial, and cytotoxic effect) [33]. In our recent study, eight antimicrobial clerodane diterpenes were isolated and characterized from the root
of S. gigantea [10]. Two clerodane diterpenoids, 16α -hydroxycleroda-3,13(14)-Z-diene-15,16-olide and 16-oxo-cleroda-3,13(14)-Ediene-15-oic acid, isolated from the seeds of Polyalthia longifolia
(Annonaceae), displayed a powerful antibacterial activity particularly against Gram-negative bacteria, including Escherichia coli,
Pseudomonas aeruginosa, and Salmonella typhimurium with MIC
values in the range of 0.78–1.56 μg/mL, so being a stronger antibiotic than gentamicin. They also efficiently inhibited the growth
of Gram-positive bacteria, such as B. subtilis and Clostridium sporogenes with MIC values between 1.56 and 6.25 μg/mL, a comparable potency to that of gentamicin [34]. Two other clerodane
diterpenes, 2-α -hydroxy-cis-cleroda-3,13(Z),8(17)-trien-15-oic acid
and 2-α -acetoxy-cis-cleroda-3,13(Z),8(17)-trien-15-oic acid, isolated
from the leaves and twigs of Haplopappus foliosus (Asteraceae),
were highly active against five investigated Gram-positive bacteria (Bacillus cereus, Bacillus coagulans, B. subtilis, Micrococcus luteus, and Staphylococcus aureus) with MIC values in the range of
0.625–2.5 μg, slightly more potent than tetracycline, but they were
inactive against five studied Gram-negative bacteria [35].
The four isolated compounds were also subjected to FIA–LITMSn analysis to discover their mass spectrometric fragmentation
pattern. A similar set of major fragment ions was produced from
1–2 and 3–4 upon collision-induced dissociation (CID) differing
mainly in their abundance (Figs. S80–S83) and supporting the
structural isomerism. MSn spectra revealed the loss of small neutral fragments [44 Da (CO2 ), 18 Da (H2 O), 28 Da (CO) for 1–4
and 100 Da (C5 H8 O2 , angelic acid) for only 3–4] and appropriate combinations of these being formed via sequential losses
proved by MS3 and MS4 spectra, which are in agreement with
the structures proposed based on NMR experiments containing
γ -hydroxybutenolide and carboxylic acid moiety. A distinct, significant peak at m/z 267 was observed in the MS/MS spectrum
of 1 (Fig. S80b), being absent from that of 2 (Fig. S81), implying a unique double water loss took place. This propensity was
confirmed by MS4 analysis via the CID breakdown of the pre-
Isolates were analyzed by HPTLC–anisaldehyde and HPTLC–EDA
using MP1 and an acidic mobile phase, n-hexane – isopropyl acetate – methanol – acetic acid 29:20:1:1, V/V/V/V (MP2) to assess
their purity and antibacterial activity (Fig. 3). In both flash fractions A and B, pinkish zones appeared at the same hRF justifying
that no undesired chemical transformations occurred. In addition,
all isolates showed inhibition against the tested bacterial cells, also
in the new HPTLC-R. fascians assay, at the identical hRF reinforcing that the compounds visible after derivatization are responsible
for the prominent antibacterial effect. Based on the chromatogram
and the bioautogram, the purity of the samples seemed adequate.
Considering the tailing peak and zone shape of the compounds
1–4 during the HPLC and HPTLC experiments, an acidic character was anticipated. Complementary HPTLC studies using acid-free
MP1 were carried out with bromocresol green stain providing a
selective visualization of acids such as carboxylic acids. The appearance of bright yellow spots against a blue background at the
hRF of the isolated compounds supported the prediction (Fig. 3g).
HPTLC–UV/FLD analyses unveiled weak absorbance at 254 nm and
fluorescence at 366 nm of compounds 1–4, explaining the necessity for derivatization. HPTLC–ESI-QMS (Fig. S7) and HPLC–DAD–
ESI-QMS (Fig. S8) analyses of the isolated compounds confirmed
that their purity (85–92%, calculated from HPLC–UV at 220 nm)
was appropriate and they were not artifacts of the isolation procedure. However, the sodium and solvent adducts of the molecules
and the dimers were observed with a higher signal intensity in the
mass spectra compared to the former results.
The results of NMR measurements (Figs. S9–S79 and Table 1)
enabled the unambiguous structure elucidation of the four isolated
compounds identified as diterpenoids bearing cis-clerodane skeleton: solidagoic acid H (1), solidagoic acid E (2), solidagoic acid I
(3), and solidagoic acid F (4) (Fig. 5). Each isolated compound contained a carboxyl group at C-19 that is considered as an atypical structural motif among the clerodanes [22]. The NMR resonance assignment was confirmed by comparing the reported spectral data [22]. The trans relative configuration between the methyl
groups at C-17 and C-20 was also validated by their 13 C chemical
shift difference ( δ C-20–C-17 ) exceeding 10.0 ppm [32]. Solidagoic
acid H, E, I, and F were isolated by Starks et al. [22] from the
aerial parts of S. virgaurea (European goldenrod). However, to the
best of our knowledge, the four cis-clerodane diterpenoids mentioned above have not yet been isolated from S. gigantea. Comparing Starks and colleagues’ publication, a more complete NMR
resonance assignment could be provided (Table 1). The missing
7
M. Baglyas, P.G. Ott, Z. Garádi et al.
Journal of Chromatography A 1677 (2022) 463308
Table 1
1
H and 13 C NMR (CDCl3 , 600/151 MHz) resonance assignment of solidagoic acid H (1), E (2), I (3), and F (4).
Solidagoic acid H (1)
H δ (ppm)
#
1
1a
1b
2ab
3
4
5
6a
1.54
1.74
2.10
5.52
6b
7a
7b
8
9
10
11a
11b
12a
12b
13
14
15
16
17
18a
(ov., 1H)
(m, 1H)
(m, 2H)
(br s, 1H)
1.45 (td,
J = 13.5, 4.7 Hz,
1H)
2.33 (m, 1H)
1.38 (m, 1H)
1.68 (ov., 1H)
1.68 (ov., 1H)
2.30 (m, 1H)
1.53 (ov., 1H)
1.63 (ov., 1H)
2.19 (br s, 1H)
2.62 (br t,
J = 13.9 Hz, 1H)
5.88 (s, 1H)
5.96 (br s, 1H)
0.86 (d,
J = 6.3 Hz, 3H)
1.55 (s, 3H)
Solidagoic acid E (2)
13
C δ (ppm)
19.3
26.2
123.7
135.6
51.1
29.0
27.8
36.7
38.5
42.4
28.7
22.2
n. d.
116.9
172.6
100.1
15.6
1
H δ (ppm)
1.53
1.73
2.09
5.51
(m, 1H)
(m, 1H)
(ov., 2H)
(br s, 1H)
1.42 (ov., 1H)
2.32
1.35
1.63
1.66
(ov., 1H)
(m, 1H)
(ov., 1H)
(ov., 1H)
2.30 (ov., 1H)
1.38 (ov., 1H)
1.61 (ov., 1H)
2.09 (ov., 1H)
2.45 (br t,
J = 14.1 Hz, 1H)
6.88 (br s, 1H)
6.07 (s, 1H)
18.9
0.82 (d,
J = 6.5 Hz, 3H)
1.55 (s, 3H)
181.9
26.3
0.96 (s, 3H)
Solidagoic acid I (3)
13
C δ (ppm)
19.4
1
H δ (ppm)
1.58
1.78
2.20
5.92
26.3
123.6
135.7
51.0
29.1
(ov., 1H)
(m, 1H)
(m, 2H)
(ov., 1H)
1.54 (ov., 1H)
27.8
36.8
38.5
42.3
28.8
19.4
138.9
143.6
97.6
173.0
15.7
2.42
1.40
1.67
1.68
(m, 1H)
(m, 1H)
(ov., 1H)
(ov., 1H)
2.35
1.55
1.66
2.14
2.61
(m, 1H)
(ov., 1H)
(ov., 1H)
(ov., 1H)
(br s, 1H)
5.89 (s, 1H)
18.9
5.92 (ov., 1H)
0.84 (d,
J = 5.6 Hz, 3H)
4.50 (s, 2H)
181.1
26.5
0.96 (s, 3H)
Solidagoic acid F (4)
13
C δ (ppm)
19.2
26.3
128.4
135.4
50.0
29.8
27.8
36.5
38.5
42.3
28.2 (br)
22.1
n. d.
116.5
173.0
100.6
15.6
64.3
18b
19
20
1’
2’
3’
0.96 (s, 3H)
6.05 (br q,
J = 7.2 Hz, 1H)
1.97 (dq, J = 7.2,
1.6 Hz, 3H)
1.87 (br s, 3H)
4’
5’
180.0
26.4
167.7
127.6
138.5
15.8
20.6
1
H δ (ppm)
1.58
1.78
2.19
5.92
(ov., 1H)
(m, 1H)
(m, 2H)
(br s, 1H)
1.53 (ov., 1H)
2.39
1.36
1.66
1.66
(ov.,
(ov.,
(ov.,
(ov.,
1H)
1H)
1H)
1H)
2.37 (ov., 1H)
1.38 (ov., 1H)
1.65 (ov., 1H)
2.12 (m, 1H)
2.45 (br t,
J = 14.3 Hz, 1H)
6.88 (br s, 1H)
6.07 (ov., 1H)
0.82 (d,
J = 5.8 Hz, 3H)
4.47 (d,
J = 13.5 Hz, 1H)
4.50 (d,
J = 13.5 Hz, 1H)
0.97 (s, 3H)
6.07 (ov., 1H)
1.97 (dq, J = 7.3,
1.7 Hz, 3H)
1.89 (br s, 3H)
13
C δ (ppm)
19.3
26.3
127.9
135.3
49.9
29.8
27.8
36.6
38.6
42.2
28.7 (br)
19.6
138.9
143.5
97.5
172.9
15.6
64.4
179.6
26.5
167.8
127.6
138.7
15.8
20.6
(ov.: overlapping peaks, n. d.: could not be determined)
cursor ion at m/z 285 [M–CO2 –H2 O] to yield a mass signal at
m/z 267 [M–CO2 –2H2 O] (Fig. S80d), indicating the second water
loss.
As all solidagoic acids exhibited a pronounced inhibition in
HPTLC–B. subtilis subsp. spizizenii and HPTLC–R. fascians assays
(Fig. 3) at the appropriate hRF , confirming their antibacterial feature, their MIC and IC50 were investigated by microdilution assays
against both strains (Table S1). Solidagoic acid I (3) displayed moderate antibacterial activity against B. subtilis subsp. spizizenii with a
MIC of 64.5 μg/mL (IC50 was between 32.3 and 64.5 μg/mL). Similarly, solidagoic acid H (1) and I (3) exhibited a slight antibacterial effect against R. fascians with an IC50 of 43.5 μg/mL and
64.4 μg/mL, respectively. The MIC of solidagoic acid H was also
determined as 64.5 μg/mL. Note that solidagoic acid E, F, and H
(1, 2, and 4) against B. subtilis subsp. spizizenii as well as solidagoic acid E and F (2 and 4) did not reach the IC50 at the maximum concentration utilized. The antibacterial activity of these four
compounds was investigated by Starks et al. [22] against S. aureus
(strain 25923), IC50 values obtained by microdilution method were
established as >64 μg/mL (1), >64 μg/mL (2), 37 μg/mL (3), not
determined (4). Hence, solidagoic acid I (3) proved to be the most
active compound out of the four isolates. The moderate antibacterial activity shown by these four cis-clerodane diterpenoids suggests that they can serve as a starting point for the synthesis of
more potent compounds.
4. Conclusions
New analytical normal-phase HPTLC and preparative reversedphase column chromatography methods were developed for the
separation, effect-directed detection and isolation of closely related
bioactive diterpene isomers. The combination of these methods enabled the discovery of antibacterial solidagoic acid E, F, H, and
I, new in S. gigantea, which were identified by NMR. Complete
1 H and 13 C NMR resonance assignments of solidagoic acid E and
F were given for the first time. Introducinga Gram-positive plant
pathogenic bacterium into direct bioautography, a novel HPTLC–R.
fascians bioassay was developed, in which the isolated solidagoic
acids exhibited inhibition. Solidagoic acid H and I showed a moderate antibacterial effect against the Gram-positive Bacillus subtilis
subsp. spizizenii and R. fascians also in microdilution assays, thus
they can act as lead compounds in drug discovery. The orthogonal separations allowed by the consecutive use of normal- and
reversed-phase stationary phases as well as complementary methods based on planar and column chromatography developed in this
study can be used for the fishing of potential drug or pesticide candidates from complex matrices in general.
CRediT authorship contribution statement
Márton Baglyas: Methodology, Investigation, Formal analysis,
8
M. Baglyas, P.G. Ott, Z. Garádi et al.
Journal of Chromatography A 1677 (2022) 463308
Writing original draft. Péter G. Ott: Bacteriological work, Writing review & editing. Zsófia Garádi: NMR investigation. Vesna
Glavnik: Methodology, Investigation, Writing review & editing. Szabolcs Béni: NMR investigation. Irena Vovk: Methodology, Writing review & editing, Resources, Funding acquisition. Ágnes M.
Móricz: Conceptualization, Supervision, Methodology, Resources,
Writing review & editing, Funding acquisition.
[14] S. Anžlovar, J.D. Koce, Antibacterial and antifungal activity of aqueous and
organic extracts from indigenous and invasive species of goldenrod (Solidago spp.) grown in Slovenia, Phyton 54 (2014) 135–147, doi:10.12905/0380.
phython54(1)2014-0135.
[15] A. Toiu, L. Vlase, D.C. Vodnar, A.-M. Gheldiu, I. Oniga, Solidago graminifolia L.
Salisb. (Asteraceae) as a valuable source of bioactive polyphenols: HPLC profile,
in vitro antioxidant and antimicrobial potential, Molecules 24 (2019) 2666–
2680, doi:10.3390/molecules24142666.
[16] D. Krüzselyi, J. Bakonyi, P.G. Ott, A. Darcsi, P. Csontos, G.E. Morlock, Á.M. Móricz, Goldenrod root compounds active against crop
pathogenic fungi, J. Agric. Food Chem. 69 (2021) 12686–12694, doi:
10.1021/acs.jafc.1c03676.
[17] Á.M. Móricz, M. Jamshidi-Aidji, D. Krüzselyi, A. Darcsi, A. Böszörményi, P. Csontos, S. Béni, P.G. Ott, G.E. Morlock, Distinction and valorization of 30 root
extracts of five goldenrod (Solidago) species, J. Chromatogr. A 1611 (2020)
460602, doi:10.1016/j.chroma.2019.460602.
[18] D. Mishra, S. Joshi, G. Bisht, S. Pilkhwal, Chemical composition and antimicrobial activity of Solidago canadensis Linn. root essential oil, J. Basic Clin. Pharm.
1 (2010) 187–190.
[19] C. Ferrante, A. Chiavaroli, P. Angelini, R. Venanzoni, G.A. Flores, L. Brunetti,
M. Petrucci, M. Politi, L. Menghini, S. Leone, L. Recinella, G. Zengin, G. Ak,
M.D. Mascio, F. Bacchin, G. Orlando, Phenolic content and antimicrobial and
anti-inflammatory effects of Solidago virga-aurea, Phyllanthus niruri, Epilobium
angustifolium, Peumus boldus, and Ononis spinosa extracts, Antibiotics 9 (2020)
783–803, doi:10.3390/antibiotics9110783.
[20] A.V. Tkachev, E.A. Korolyuk, W. Letchamo, Volatile oil-bearing flora of Siberia
VIII: essential oil composition and antimicrobial activity of wild Solidago virgaurea L. from the Russian Altai, J. Essent. Oil Res. 18 (2006) 46–50, doi:10.
1080/10412905.2006.9699382.
[21] H.S. Elshafie, D. Grul’ová, B. Baranová, L. Caputo, L.D. Martino, V. Sedlák,
I. Camele, V.D. Feo, Antimicrobial activity and chemical composition of essential oil extracted from Solidago canadensis L. growing wild in Slovakia,
Molecules 24 (2019) 1206–1217, doi:10.3390/molecules24071206.
[22] C.M. Starks, R.B. Williams, M.G. Goering, M. O’Neil-Johnson, V.L. Norman, J.F. Hu, E. Garo, G.W. Hough, S.M. Rice, G.R. Eldridge, Antibacterial clerodane
diterpenes from goldenrod (Solidago virgaurea), Phytochemistry 71 (2010) 104–
109, doi:10.1016/j.phytochem.2009.09.032.
[23] Á.M. Móricz, P.G. Ott, T.T. Häbe, A. Darcsi, A. Böszörményi, Á. Alberti,
D. Krüzselyi, P. Csontos, S. Béni, G.E. Morlock, Effect-directed discovery of
bioactive compounds followed by highly targeted characterization, isolation
and identification, exemplarily shown for Solidago virgaurea, Anal. Chem. 88
(2016) 8202–8209, doi:10.1021/acs.analchem.6b02007.
[24] G. Corni, V. Brighenti, F. Pellati, G.E. Morlock, Effect-directed analysis of bioactive compounds in Cannabis sativa L. by high-performance thin-layer chromatography, J. Chromatogr. A 1629 (2020) 461511, doi:10.1016/j.chroma.2020.
461511.
[25] U. Jug, I. Vovk, V. Glavnik, D. Makuc, K. Naumoska, Off-line multidimensional
high performance thin-layer chromatography for fractionation of Japanese
knotweed rhizome bark extract and isolation of flavan-3-ols, proanthocyanidins and anthraquinones, J. Chromatogr. A 1637 (2021) 461802, doi:10.1016/j.
chroma.2020.461802.
[26] M.L. Putnam, M.L. Miller, Rhodococcus fascians in herbaceous perennials, Plant
Dis. 91 (2007) 1064–1076, doi:10.1094/PDIS- 91- 9- 1064.
[27] E. Stes, I. Francis, I. Pertry, A. Dolzblasz, S. Depuydt, D. Vereecke, The leafy gall
syndrome induced by Rhodococcus fascians, FEMS Microbiol. Lett. 342 (2013)
187–195, doi:10.1111/1574-6968.12119.
[28] Á.M. Móricz, D. Krüzselyi, V. Lapat, P.G. Ott, Acetylcholinesterase inhibitors in
the giant goldenrod root, J. Chromatogr. B 1185 (2021) 123004, doi:10.1016/j.
jchromb.2021.123004.
[29] Á.M. Móricz, T.T. Häbe, P.G. Ott, G.E. Morlock, Comparison of highperformance thin-layer with overpressured layer chromatography combined
with direct bioautography and direct analysis in real time mass spectrometry for tansy root, J. Chromatogr. A 1603 (2019) 355–360, doi:
10.1016/j.chroma.2019.03.068.
[30] Á.M. Móricz, T.T. Häbe, A. Bưszưrményi, P.G. Ott, G.E. Morlock, Tracking and
identification of antibacterial components in the essential oil of Tanacetum
vulgare L. by the combination of high-performance thin-layer chromatography with direct bioautography and mass spectrometry, J. Chromatogr. A 1422
(2015) 310–317, doi:10.1016/j.chroma.2015.10.010.
[31] L.-L. Xu, F.-X. Guo, S.-S. Chi, Z.-J. Wang, Y.-Y. Jiang, B. Liu, J.-Y. Zhang,
Rapid screening and identification of diterpenoids in Tinospora sinensis based
on high-performance liquid chromatography coupled with linear ion traporbitrap mass spectrometry, Molecules 22 (2017) 912–928, doi:10.3390/
molecules22060912.
[32] Y. Nishidono, K. Tanaka, New clerodane diterpenoids from Solidago altissima
and stereochemical elucidation via 13 C NMR chemical shift analysis, Tetrahedron 110 (2022) 132691, doi:10.1016/j.tet.2022.132691.
[33] R. Li, S.L. Morris-Natschke, K.-H. Lee, Clerodane diterpenes: sources, structures,
and biological activities, Nat. Prod. Rep. 33 (2016) 1166–1226, doi:10.1039/
C5NP00137D.
[34] M. Marthanda Murthy, M. Subramanyam, M. Hima Bindu, J. Annapurna, Antimicrobial activity of clerodane diterpenoids from Polyalthia longifolia seeds,
Fitoterapia 76 (2005) 336–339, doi:10.1016/j.fitote.20 05.02.0 05.
[35] A. Urzúa, R. Torres, L. Mendoza, F.D. Monache, Antibacterial new clerodane
diterpenes from the surface of Haplopappus foliosus, Planta Med. 69 (2003)
675–677, doi:10.1055/s- 2003- 41118.
Declaration of Competing Interest
The authors declare no competing financial interests.
Acknowledgments
This work was supported by the National Research, Development and Innovation Office of Hungary (NKFIH K128921), the
Hungarian-Slovenian TÉT Grant (2019-2.1.11-TÉT-2020-00115) and
the Slovenian Research Agency (ARRS; research core funding No.
P1-0 0 05 and the bilateral project BI-HU/21-22-007). Z. Garádi
worked with the professional support of the Doctoral Student
Scholarship Program of the Co-operative Doctoral Program of the
Ministry of Innovation and Technology, financed by the National
Research, Development and Innovation Fund (KDP-1007075).
Supplementary materials
Supplementary material associated with this article can be
found, in the online version, at doi:10.1016/j.chroma.2022.463308.
References
[1] U. Maitra, C. Stephen, L.M. Ciesla, Drug discovery from natural products – Old
problems and novel solutions for the treatment of neurodegenerative diseases,
J. Pharm. Biomed. Anal. 210 (2022) 114553, doi:10.1016/j.jpba.2021.114553.
[2] N.E. Thomford, D.A. Senthebane, A. Rowe, D. Munro, P. Seele, A. Maroyi,
K. Dzobo, Natural products for drug discovery in the 21st century: innovations
for novel drug discovery, Int. J. Mol. Sci. 19 (2018) 1578–1606, doi:10.3390/
ijms19061578.
[3] D.R. Schlaepfer, P.J. Edwards, R. Billeter, Why only tetraploid Solidago gigantea
(Asteraceae) became invasive: a common garden comparison of ploidy levels,
Oecologia 163 (2010) 661–673, doi:10.10 07/s0 0442- 010- 1595- 3.
[4] J. Leuschner, Anti-inflammatory, spasmolytic and diuretic effects of a commercially available Solidago gigantea Herb. extract, Arzneim. Forsch. 45 (1995)
165–168.
´
´
[5] D. Wozniak,
S. Slusarczyk,
K. Domaradzki, A. Drys´ , A. Matkowski, Comparison of polyphenol profile and antimutagenic and antioxidant activities in two
species used as source of Solidaginis herba – goldenrod, Chem. Biodivers. 15
(2018) e180 0 023, doi:10.10 02/cbdv.20180 0 023.
[6] J. Zekicˇ , I. Vovk, V. Glavnik, Extraction and analyses of flavonoids and phenolic acids from Canadian goldenrod and giant goldenrod, Forests 12 (2020) 40,
doi:10.3390/f12010040.
˙ A. Pukalskas, L. Raudone,
[7] M. Marksa, K. Zymone, L. Ivanauskas, J. Radušiene,
Antioxidant profiles of leaves and inflorescences of native, invasive and hybrid Solidago species, Ind. Crop. Prod. 145 (2020) 112123, doi:10.1016/j.indcrop.
2020.112123.
[8] D. Kalemba, H. Marschall, P. Bradesi, Constituents of the essential oil
of Solidago gigantea Ait, Flavour Fragr. J. 16 (2001) 19–26, doi:10.1002/
1099-1026(200101/02)16:1 19::AID- FFJ940 3.0.CO;2- U.
[9] G. Benelli, R. Pavela, K. Cianfaglione, D.U. Nagy, A. Canale, F. Maggi, Evaluation
of two invasive plant invaders in Europe (Solidago canadensis and Solidago gigantea) as possible sources of botanical insecticides, J. Pest Sci. 92 (2019) 805–
821, doi:10.1007/s10340- 018- 1034- 5.
[10] Á.M. Móricz, D. Krüzselyi, P.G. Ott, Z. Garádi, S. Béni, G.E. Morlock, J. Bakonyi,
Bioactive clerodane diterpenes of giant goldenrod (Solidago gigantea Ait.)
root extract, J. Chromatogr. A 1635 (2021) 461727, doi:10.1016/j.chroma.2020.
461727.
[11] S.-H. Lee, H.-W. Oh, Y. Fang, S.-B. An, D.-S. Park, H.-H. Song, S.-R. Oh, S.-Y. Kim,
S. Kim, N. Kim, A.S. Raikhel, Y.H. Je, S.W. Shin, Identification of plant compounds that disrupt the insect juvenile hormone receptor complex, Proc. Natl.
Acad. Sci. U.S.A. 112 (2015) 1733–1738, doi:10.1073/pnas.1424386112.
[12] G. Reznicek, J. Jurenitsch, G. Michl, E. Haslinger, The first structurally confirmed
saponin from Solidago gigantea: structure elucidation by modern NMR techniques, Tetrahedron Lett. 30 (1989) 4097–4100, doi:10.1016/S0040-4039(00)
99331-6.
[13] B. Kołodziej, R. Kowalski, B. Kedzia,
˛
Antibacterial and antimutagenic activity of
extracts aboveground parts of three Solidago species: Solidago virgaurea L., Solidago canadensis L. and Solidago gigantea Ait, J. Med. Plant Res. 5 (2011) 6770–
6779, doi:10.5897/JMPR11.1098.
9