Can analyte protectants compensate wastewater matrix induced enhancement effects in gas chromatography – mass spectrometry analysis?
Bạn đang xem bản rút gọn của tài liệu. Xem và tải ngay bản đầy đủ của tài liệu tại đây (1001.79 KB, 7 trang )
Journal of Chromatography A 1676 (2022) 463280
Contents lists available at ScienceDirect
Journal of Chromatography A
journal homepage: www.elsevier.com/locate/chroma
Can analyte protectants compensate wastewater matrix induced
enhancement effects in gas chromatography – mass spectrometry
analysis?
Mathias B. Jørgensen a,b, Jan H. Christensen b,∗
a
BIOFOS A/S, Refshalevej 250, København 1432, Denmark
Analytical Chemistry Group, Department of Plant and Environmental Sciences, University of Copenhagen, Thorvaldsensvej 40, Frederiksberg C, 1871,
Denmark
b
a r t i c l e
i n f o
Article history:
Received 21 March 2022
Revised 20 June 2022
Accepted 24 June 2022
Available online 25 June 2022
Keywords:
Analyte protectants
Wastewater
Matrix enhancement effects
GC-MS
Micropollutants
a b s t r a c t
This study aimed to investigate the ability of analyte protectants to enhance GC-MS signals and compensate matrix effects for a range of micropollutants in pure standard, effluent, and influent wastewater
samples during analysis and detection. Wastewater samples were prepared for analysis using multilayer
solid phase extraction for the purpose of extracting sample components with a broad range of physicalchemical properties. The sample extracts were either spiked or not spiked with target compounds and
four analyte protectants: 3-ethoxy-1,2-propanediol, D-sorbitol, gluconolactone, and shikimic acid. In this
way, it was possible to evaluate the matrix effects of wastewater samples and compare the use of analyte
protectants with the conventional correction method of allocating a best matching internal standard to
each target compound. A relation was observed between level of wastewater treatment and matrix effects, with the largest effects observed for influent samples and the smallest effects for effluent samples.
Compensation of matrix effects with analyte protectants gave comparable results with the conventional
correction method of allocating a best matching internal standard to each of the 13 investigated micropollutants. The best overall compensation was observed using analyte protectants and the internal standard
correction method in combination.
© 2022 The Author(s). Published by Elsevier B.V.
This is an open access article under the CC BY license ( />
1. Introduction
In the European Union up to 70,0 0 0 chemicals are in use every
day, including “down the drain” products such as pharmaceuticals,
personal care products, biocides, and flame retardants. They are
all micropollutants detected in wastewater at trace concentrations.
Wastewater result from uses of freshwater in households, industry, hospitals, agriculture, and from rainwater ending up in drains.
Wastewater is treated at wastewater treatment plants (WWTPs) in
industrialized countries to remove organic content, nitrogen, and
phosphorus, and treated effluents enters the aquatic environment.
Conventional WWTPs are not designed to remove micropollutants
from wastewater, and potential toxicological effects on aquatic life
and human health from discharges of persistent micropollutants
are manifold [1–3].
Evaluation of exposure is usually based on a target list of micropollutants that are known to be hazardous and persistent in the
∗
Corresponding author.
E-mail address: (J.H. Christensen).
aquatic environment [4]. In target analysis, properties of these micropollutants are used to optimize sample preparation and correct
for instrument drift and matrix effects (MEs) [5]. A matrix refers to
all compounds in the sample different from the target compounds
of interest. In gas chromatography – mass spectrometry analysis
(GC-MS) of volatile and semi volatile micropollutants, MEs emerge
most often as response enhancement effects: The presence of matrix components allows for a larger number of susceptible target
molecules to reach the detector. The matrix protects thermally labile targets at high temperatures from degradation and compete
for active sites in the GC-MS system. Active sites arise as exposed
silanol groups and metal ions in the liner and capillary column,
and from activities of metal ions in the MS. Condensation of nonvolatile material from injection of multiple sample matrixes and
use of harsh temperature programs during analysis can activate
surfaces in the liner and column even further. The instrument condition can therefore change over time while it is in use [6]. Compounds prone to matrix response enhancement effects include polar acids or bases containing oxygen, nitrogen, phosphorus, or sulfur in their molecular structure. The polar groups interact with ac-
/>0021-9673/© 2022 The Author(s). Published by Elsevier B.V. This is an open access article under the CC BY license ( />
M.B. Jørgensen and J.H. Christensen
Journal of Chromatography A 1676 (2022) 463280
tive sites via Van der Waals forces, hydrogen bonding, ionic bonding, and even covalent bonding, and molecules can degrade during
interaction. MEs will therefore depend on; physical-chemical properties of each target compound, type, amount, and number of sample injections, and the condition of the GC-MS instrument in use
[6–8].
To limit or even avoid quantification biases when comparing
samples with different matrix composition such as influent and
effluent wastewater, it is important to be able to correct MEs as
part of the analytical setup. Several methods to correct or reduce
MEs in target analysis exists such as dilution or extensive sample
preparation to remove matrix components [9], the use of isotopically labeled standards (ISTD) or matrix-matched calibration to correct for MEs [10], standard addition experiments [11], and derivatization to decrease polarity and thereby the reactivity of the target compounds [12]. However, these methods have all drawbacks
such as losses during sample cleanup or derivatization, high costs
and labor-intensive, difficulty in finding a blank sample matrix, and
inconsistent and insufficient reactivity of derivatization agents [9–
13]. Target analysis of a restricted number of compounds also lead
to another type of bias as hazardous and persistent micropollutants
may be overlooked if they are not among the selected targets [5].
An alternative strategy to target screening is non-target screening
(NTS) analysis. The strategy allows for identification of potentially
thousands of compounds in a sample. Correction in NTS can involve the strategy of allocating a best matching ISTD to each detected unknown peak [14].
As an alternative, the use of analyte protectants (APs) is a simple, practical, and cheap way to correct for MEs. The basic idea
of APs is to add a high concentration of one or a few specific
compounds to all samples, calibration samples, and quality control samples before analysis. The APs mimics a matrix and protects
the micropollutants of interest during analysis. Matrix effect differences and quantification biases between different types of samples is thereby reduced [6,15]. Additionally, the matrix enhancement effect results in peaks with less tailing and lower detection
limits for labile and reactive micropollutants. Via implementation
of APs, it is therefore possible to take advantage from the benefits
of MEs. Sugar derivates containing multiple hydroxy groups was
found to be some of the most promising compounds to mimic and
compensate the matrix effect for the purpose of optimizing analysis of pesticides present in food samples [15]. Comparable recoveries were observed for matrix matched calibration and implementation of APs with the use of the three APs 3-ethoxy-1,2-propanediol,
D-sorbitol, and L-gulonic acid γ -lactone [16]. Improved ruggedness was also observed in a long-term stability test during another
study using the same APs [17]. Shikimic acid was found to protect
base labile compounds and has been implemented together with
the other three mentioned APs [18]. All abovementioned studies
deal with analyses of pesticides in food. Only two studies have
prior investigated the use of APs in relation to analyses of water
[6]. Barrek et al. tested and implemented isopropanol as AP for the
target analysis of 36 priority substances in surface water. The study
found isopropanol to be an efficient analyte protectant for these
target compounds [19]. Purdesova et al. tested the use of the APs
3-ethoxy-1,2-propanediol, D-sorbitol, and L-gulonic acid γ -lactone
for the quantification of pesticides in surface waters and found that
the three APs could not eliminate MEs for the target pesticides and
matrix investigated [20].
In a pilot study, we have observed prominent MEs for micropollutants with a range of different physical-chemical properties in solid phase extraction (SPE) extracts of influent, mechanical treated, and effluent wastewater with an enrichment factor of
50. The main aim of this paper was to investigate in a systematic
way the ability of APs to enhance GC-MS signals and compensate
ME differences for a range of micropollutants in pure standard, ef-
fluent, and influent wastewater samples during analysis and detection. Additionally, a comparison of correction strategies is made
with the method of allocating a best matching ISTD to each target
compound. To our knowledge this is the first study of ME correction using APs in the GC-MS analysis of wastewater [6].
2. Methods
2.1. Chemicals and reagents
All liquids were of analytical grade: Acetonitrile (≥ 99.9%,
Honeywell), ethyl acetate (≥ 99.7%, Honeywell), water (Merck),
methanol (≥ 99.9%, Honeywell), 4% ammonia in methanol (TCI
chemicals), and formic acid (≥ 97.5%, Merck). A standard mix of
13 compounds (STD) and a separate internal standard mix of five
deuterated compounds (ISTD) were both prepared in methanol
(Table 1). The concentration was 10 mg L−1 in STD and 20 mg L−1
in ISTD mixture for each compound, respectively. A mixture of APs
was prepared in acetonitrile and water (v:v 6:4) with 200 g L−1
3-ethoxy-1,2-propanediol, 5 g L−1 D-sorbitol, 10 g L−1 gluconolactone, and 5 g L−1 shikimic acid according to the EURL method [21].
All stock solutions were stored at −18 °C.
2.2. Sampling and sample preparation
Grab samples of influent and effluent wastewater was collected
on November 12. 2020 from Avedøre WWTP, Kanalhomen 28, 2650
Hvidovre, Denmark. The two samples were vacuum filtered; first
with a 1.6 μm and then with a 0.7 μm glass microfiber filter, to
remove particles before sample preparation and analysis. The filtered samples were stored at 4 0 C and were extracted by multilayer SPE using an automated SPE-03 system (PromoChrom Technologies Ltd.). The SPE method was developed by Tisler et al.
for the purpose of analyzing micropollutants with a broad range
of physical-chemical properties via NTS. A detailed description of
the method is in the supplementary information (SI) to the paper
[22]. 1 L of sample was first loaded and then eluted with 6 ml
ethyl acetate/methanol/4% ammonia in methanol (v:v:v 46:46:8),
subsequently with 3 ml ethyl acetate/methanol/formic acid (v:v:v
49:49:1.7), and 2 ml methanol. Samples were then evaporated with
nitrogen to a volume of 300 μL (± 50 μL) and reconstituted to a final volume of 2 ml with methanol. The overall enrichment factor
was 500. A part of the extracts were handed over to this project,
and then further diluted (v:v 9:1) with methanol to reach a relative enrichment factor of 50.
Influent and effluent samples were post-spiked after SPE with
ISTD (v:v 1:10). Methanol without SPE enrichment was used as
pure standard solution and was also spiked with ISTD (v:v 1:10).
Each type of sample (influent, effluent, and pure standard) was
then split into two parts. One part was spiked with AP mixture
(v:v 3:110) according to the EURL method on APs, corresponding
to 5.45 μg 3-ethoxy-1,2-propanediol, 0.136 μg D-sorbitol, 0.273 μg
gluconolactone, and 0.136 μg shikimic acid in 1 μL of injected sample with APs [21]. The second part was spiked with same amount
of methanol (v:v 3:110) to reach the same level of dilution for all
samples. Each of the six sample types (influent, effluent, and pure
standard, with and without APs) were split into two parts. One
part was spiked with STD (v:v 1:7.5) and the other part was spiked
with methanol (v:v 1:7.5) to reach the same level of dilution. In
this way, the three sample types (influent, effluent, and pure standard samples) were prepared both with APs and STD, only with
APs, only with STD and with neither of the two, having a total
of six sample types spiked with STD and six sample types spiked
with methanol as a control (Fig. B1). All 12 sample types were prepared in triplicate, ending up with a total of 36 samples prepared
for analysis.
2
M.B. Jørgensen and J.H. Christensen
Journal of Chromatography A 1676 (2022) 463280
Table 1
The 13 STDs and five ISTDs, prepared in two separate solutions, with specified CAS number (CAS No.), type, chemical formula (Formula), molecular
mass∗ (Mmi ), retention time (RT), m/z ion used for quantification (Quant.ion), m/z ion used for qualification (Qual.ion), LogP, and volatility∗ ∗ .
Compound
CAS No.
Type
Formula
Mmi ∗
RT
(min)
Quant.ion
(m/z)
Qual.ion
(m/z)
LogP
Volatility∗∗
DEET
Ibuprofen
Caffeine-d9
Terbutryn
Triclosan
Venlafaxine
Bisphenol A-d16
Amitriptyline-d3
Amitriptyline
Carbamazepine-d8
Carbamazepine
Tebuconazole
Sertraline
Citalopram
Estradiol
Ethinylestradiol
Progesterone-d9
Simvastatin
134-62-3
15687-27-1
72238-85-8
886-50-0
3380-34-5
93413-69-5
96210-87-6
342611-00-1
549-18-8
1538624-35-9
298-46-4
107534-96-3
79617-96-2
59729-33-8
50-28-2
57-63-6
15775-74-3
79902-63-9
Insecticide
Pharmaceutical
NA
Herbicide
Antibiotic
Antidepressant
NA
NA
Antidepressant
NA
Anticonvulsant
Fungicide
Antidepressant
Antidepressant
Hormone
Hormone
NA
Pharmaceutical
C12H17NO
C13H18O2
C8H10N4O2
C10H19N5S
C12H7Cl3O2
C17H27NO2
C15H16O2
C20H24ClN
C20H24ClN
C15H12N2O
C15H12N2O
C16H22ClN3O
C17H17Cl2N
C20H21FN2O
C18H24O2
C20H24O2
C31H30O2
C25H38O5
191.13
206.13
203.08
241.14
287.95
277.20
244.22
280,20
277.18
244.09
236.09
307.15
305.07
324.16
272.18
296.18
314.22
418.27
9.51
9.81
11.40
12.14
13.20
13.23
13.54
13.92
13.99
14.70
14.70
14.86
14.98
15.16
16.27
16.59
17.19
18.01
119.05
161.05
203.15
226.05
290.05
58.15
224.15
61.15
58.05
200.15
193.05
124.95
274.05
58.05
272.15
213.05
129.15
159.15
190.15
163.05
115.15
185.05
288.00
134.05
223.15
62.15
59.00
171.15
192.05
250.05
276.05
238.05
160.05
296.25
323.35
157.05
2.18
3.97
−0.7
3.74
4.76
3.20
3.32
4.92
4.92
2.45
2.45
3.70
5.51
3.76
4.01
3.67
3.87
4.68
2.1E-8
1.5E-7
1.1E-11
1.15E-8
2.1E-8
2.04E-11
4.0E-11
6.85E-8
6.85E-8
1.08E-7
1.08E-7
1.45E-10
6.45E-5
2.69E-11
3.64E-11
7.94E-12
6.49E-8
2.8E-10
∗
∗∗
Monoisotopic mass.
Henrys constant (atm-m3 /mol at 25 °C).
2.3. Instrumentation and analysis
physical-chemical properties in terms of interactions and thermal
stability during the GC-MS analysis. The Euclidean distance (ED)
between each STD and ISTD in the 12-dimensional space was calculated according to Eq. (2), where xpi and xqi are the ME values
of STD compound p and ISTD compound q from ME measurement
number i. The ISTD with shortest ED to a STD was selected as a
best matching ISTD to correct for MEs, as described elsewhere in
literature [10]. No separate training and validation sets were used
to first calculate EDs and then calculate the ME with ISTD correction. Instead, the same set of samples were used for both actions,
potentially leading to overfitting and a bias in the result.
An Agilent 6890 gas chromatograph interfaced to an Agilent
5973 MS was operated in EI mode (70 eV). Helium was used as
carrier gas with a flow rate of 1.1 ml min−1 and with injection
run in splitless mode (50 ml min−1 at 1 min). Injection volume
was 1 μL and injection temperature 280 0 C. Transfer line and ion
source temperatures were 300 0 C and 230 0 C, respectively. Massto-charge ratios (m/z) were measured in selected ion monitoring
(SIM) mode with one quantifier and one qualifier ion for each compound (Table 1). The instrument was equipped with a 30 m 5%
phenyl 95% dimethylpolysiloxane (ZB-5) column with an inner diameter of 0.25 mm and a film thickness of 0.25 μm. The following
temperature program was used: Starting temperature 60 °C held
for 1 min, then ramped at a rate of 15 °C min−1 to 300 °C and
held at 2 min. The total run time was 19 min. The prepared samples were analyzed in a systematic sequence; first four pure standards, then four effluents, and then four influent wastewater samples with and without STDs and APs. The sequence setup was repeated in three identical batches to include the prepared triplicates
(12 × 3 = 36 samples) according to Table C1 of the SI. A methanol
system blank was also analyzed before and after the sequence, and
the average of the two system blanks was subtracted from all samples before further data treatment.
12
ED =
(2)
3. Results and discussion
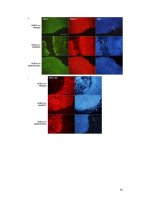
The normalized peak area for each of the five ISTDs as a function of injection order is shown in Fig. 1. Amitriptyline-d3 was
the most stabile ISTD, with relative peak areas between 0.9 and
1.2. This stability is related to steric hindrance of tertiary amine,
the only reactive group present in the molecule. The nitrogen lone
pair in tertiary amine is less available for chemical interaction with
active sites in the GC-MS compared to primary and secondary
groups. Considering the remaining four ISTDs, relative signals along
the sequence obtain values ≥ 1, indicating clear enhancement effects, after injection of wastewater samples and samples with APs:
Caffeine-d9 and progesterone-d9 with relative peak areas up to
3.6 and 3.5, respectively. Bisphenol A-d16 and carbamazepine-d8
with relative peak areas up to 12.4 and 16.8 (Fig. 1). Primary
amine, amide, hydroxyl, imidazole, ketone, and carboxylic acid
were present in the structure of one or several of the investigated
STDs and ISTDs susceptible to enhancement effects. These reactive
groups were also highlighted as susceptible to matrix enhancement effects in prior publications [8,13]. The chemical structure of
all STDs, ISTDs and APs are presented in the SI (Table A1). Chromatograms are also presented in the SI (Figs. D3 and D4).
Repeating patterns along the sequence was observed for the
four susceptible ISTDs (Fig. 1). A positive change in signal was observed every time pure standards and effluents with APs (squares
and triangles in Fig. 1) were analyzed after pure standards and
The ME (%) was calculated as the peak area of a STD compound
in a wastewater sample (S) (influent or effluent, with or without
APs) relative to the pure standard (B) (with or without APs) according to Eq. (1). The peak area of the control (SControl and BControl )
was subtracted from the samples spiked with STD, to correct for
the inherent content of STD compounds in the wastewater and to
subtract any background noise (Eq. (1)).
S − SControl
· 100
B − BControl
2
i=1
2.4. Data treatment
ME (% ) =
xpi − xqi
(1)
Results for each compound can be placed in a 12-dimensional
space, where each dimension is a ME measurement for each of
the 12 samples (effluent, influent, effluent with APs, and influent
with APs, all in triplicate). Compounds close to each other in the
12-dimensional space can be deemed as compounds with similar
3
M.B. Jørgensen and J.H. Christensen
Journal of Chromatography A 1676 (2022) 463280
Fig. 1. Stability plot of the five ISTDs as a function of injection order. Data is presented as peak areas relative to peak area of the first run for pure standard without APs
(circle), pure standard with APs (square), effluent without APs (diamond), effluent with APs (triangle), influent without APs (plus), and influent with APs (cross). See also
Table C1 of the SI for the injection order of the 36 samples.
estradiol (173 ± 32%, p value = 0.03), using a one-way student ttest to calculate the p values. DEET and ethinylestradiol revealed
larger MEs at 229 ± 48% and 165 ± 2.9% in effluent samples
and 394 ± 61% and 267 ± 48% in influent samples, respectively.
Caffeine-d9 was the best matching ISTD to DEET and progesteroned9 the best matching ISTD to ethinylestradiol. Ibuprofen, triclosan,
and simvastatin obtained the largest observed MEs of all STDs and
large ED values to all five ISTDs. It was therefore not possible to
find a good match to any ISTD, and carbamazepine-d8 and bisphenol A-d16, the two most susceptible ISTDs, obtained the lowest
ED values to these three STDs (Tables D1, D2, and D3). Additionally, amitriptyline and carbamazepine obtained the lowest calculated EDs to their respective exact matching ISTD (Tables D1 and
D2).
An increasing trend in MEs were observed with decreasing level
of wastewater treatment (influent > mechanical treated wastewater (mechanical) > effluent > pure standard) (Fig. 2 and Table D6).
This trend was not observed for carbamazepine in effluent compared to the pure standard sample. MEs were calculated according
to slope differences and enhancement effects were observed in influent wastewater for amitriptyline (140%), carbamazepine (126%),
and estradiol (144%). No significant enhancement was observed for
terbutryn (102%) (Fig. D2, Table D6, and Eq. (D1)). Variation in MEs
were observed in the different experiments (Figs. 1 and 2, Table
D3), and potential reasons to ME fluctuations were also highlighted
in literature: A difference in system condition of the GC-MS instruments used in the two studies, and differences in matrix contribution from the different wastewater samples analyzed, were reasonable explanations to observed fluctuations [6].
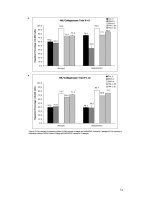
The effect of ME correction on 13 investigated STDs in effluent
and influent wastewater is shown in Fig. 3. An enhancement effect was observed for all 13 STDs in influent compared to effluent
samples, when no ME correction was applied (dark-green boxplots
in Fig. 3). Using the ISTD with closest retention time to each STD,
correction of MEs resulted in underestimation (ME values <100%)
and high variation in both effluent and influent wastewater (RT,
orange boxplots in Fig. 3). Using the best matching ISTD based on
the ED method, an overall improvement was observed with MEs
closer to 100% and decreased variation on ME values for all 13
STDs (ED, blue boxplots in Fig. 3). A good correction was for example observed for carbamazepine in influent samples, with a ME
of 629 ± 52·101 % without ISTD correction and ME of 108 ± 23%
effluents without APs (circles and diamonds in Fig. 1), indicating clear enhancement effects from application of APs to these
samples. An increase in relative peak area was for example observed for progesterone-d9 between 1.38 and 2.36 for pure standards with APs and 0.37–0.75 for effluent samples with APs
along the sequence. Considering caffeine-d9, progesterone-d9, and
carbamazepine-d8, influent samples without APs (plus signs in
Fig. 1) obtained higher signals compared to effluent samples with
APs: An increase in relative peak area for influents without APs
between 0.47 and 0.73 was for example observed for progesteroned9. This trend was not observed for bisphenol A-d16. Additionally,
the signals of pure standards without APs from second and third
batch (circles, injection order number 13, 14, 25, and 26 in Fig. 1)
were enhanced compared to pure standards without APs from the
first batch (injection order number 1 and 2 in Fig. 1), indicating
a memory effect. Yudthavorasit et al. used APs as a primer to optimize GC-MS analysis of pesticides in chili. They injected a vial
with APs in the beginning of a sequence to cover active sites before analysis of actual samples and was able to compensate MEs
and enhance GC-MS signals of the target pesticides [23]. Priming
of the GC-MS, from several injections of wastewater samples and
samples with APs, was one reasonable explanation to the observed
fluctuations in the pure standards without APs from batch one to
batch two and three (Fig. 1). An additional pure standard enhancement was not observed from second to third batch: A counteracting negative drift in detector response or coverage of active sites
to reach a saturation point are possible explanations, and further
investigations are needed to clarify the reasoning. A smaller negative trend for effluents and influents between the three batches,
especially considering bisphenol A-d16, was also observed (Fig. 1).
Negative instrument drifts can result from increasing numbers of
active sites in the liner and column after several injections, and instrument maintenance is a point of consideration, analyzing sample matrixes such as wastewater.
A correlation was observed between MEs and calculated EDs
for the 13 STDs and five ISTDs (Fig. 1, Tables D1, D2, and
D3): Amitriptyline-d3 was the best matching ISTD to the six
most stabile STDs; terbutryn, venlafaxine, tebuconazole, sertraline, citalopram, and estradiol. Significant enhancements were
still observed in effluent samples for estradiol (114 ± 6.2%, p
value = 0.027), and in influent samples for terbutryn (120 ± 1.7%,
p value = 0.001), tebuconazole (138 ± 14%, p value = 0.022), and
4
M.B. Jørgensen and J.H. Christensen
Journal of Chromatography A 1676 (2022) 463280
Fig. 2. Five-point external calibration (1.65, 0.83, 0.41, 0.21, and 0.10 mg L−1 ) in pure standard (blue square), effluent (red circle), mechanical (green diamond), and influent
(yellow triangle) wastewater for three standard compounds: (A) amitriptyline, (B) carbamazepine, and (C) estradiol. Error bars are representing the absolute standard deviation (n = 3). External calibration, calculated MEs for all 13 standards investigated, and method description of prepared calibration curves are presented in the SI (Fig. D2
and Table D6).
with ISTD correction using carbamazepine-d8 as ISTD. Ibuprofen,
triclosan, and simvastatin, the most susceptible STDs obtained high
ME values both with and without ISTD correction. Outliers were
therefore observed for these three compounds (MEs >1.5 times
the interquartile range, marked as black circles in Fig. 3). When
no exact matching ISTD is available, these observations illustrate
the importance of using an ISTD with similar GC-MS properties
in terms of MEs. Application of APs gave similar overall improvements on the ME correction compared to the ED method, though
with slight underestimations (ME<100%) for all STDs in effluent
samples (APs, pink boxplots in Fig. 3). APs were able to shift the
ME closer to 100% for eight STDs in effluent and 12 out of 13
STDs in influent samples compared to samples with no ME correction (Table D3). A lower absolute standard deviation of triplicate
ME measurements was also observed with use of APs for seven
STDs in effluent and 11 out of 13 STDs in influent samples, compared to samples without use of APs (Tables D3, D4, and D5). APs
without ISTD correction was the best overall method to correct
for MEs, with MEs closest to 100%, for two STDs in effluent and
eight out of 13 STDs in influent samples. Considering median, interquartile range, and absolute variation of investigated STDs, ME
measurements were closer to 100% using APs and ISTDs in combination (APs+RT and APs+ED, light green and yellow boxplots in
Fig. 3). Tsuchiyama et al. investigated the use of matrix matching
and APs to correct for MEs of ∼ 300 pesticides in different food
matrixes with and without additional ISTD correction. They also
implemented the ED method to find the best matching ISTD. For
most of the investigated STDs, they also concluded ME compensation as more effective using matrix matching or APs in combination with ISTDs [10,24]. The initial study presented in this paper is
the first to investigate and present promising results on the ability of APs to enhance GC-MS signals and compensate MEs for a
selection of different micropollutants usually found in wastewater
[2,6]. Only 13 STDs and five ISTDs of different type (pharmaceuticals, hormones, plasticizer, and pesticides) and physical-chemical
properties were investigated (Table 1). Like prior investigations on
food matrixes [10,15,24], further investigations are needed to make
any final conclusions whether application of APs is an alternative
to conventional correction methods for the analysis of wastewater
and other environmental samples: A much wider selection of micropollutants and optimal selection of the different APs available is
needed. Variation at instrument level to investigate if instrument
drift is enhanced or limited by APs, by running several reps. of
one sample with and without APs, should be determined. The effect from application of different deactivated liners and columns
are also factors to consider. We are working on several additional
5
M.B. Jørgensen and J.H. Christensen
Journal of Chromatography A 1676 (2022) 463280
Fig. 3. ME (%) of all triplicate measurements of 13 STDs in effluent and influent wastewater; without using any correction strategy (No ME correction, dark green), correction
with closest eluting ISTD (RT, orange), correction with best matching ISTD according to euclidean distance (ED, blue), correction with addition of APs (APs, pink), correction
with addition of APs and correction with closest eluting ISTD (APs + RT, light green), and correction with addition of APs and correction with best matching ISTD according
to euclidean distance (APs + ED, yellow). Outliers (black circles) were defined as > 1.5 times the interquartile range beyond either end of the box. Measurements > 500%
are not presented (see instead Table D4 and Fig. D1).
studies to validate the presented approach on a much wider range
of compounds, different APs, and several environmental matrixes.
Still, the promising initial results presented in this study suggest
analyte protectants as a potential alternative approach to conventional correction methods in target analysis, but maybe also in situations such as nontarget screening, where the high number of potential compounds of interest make conventional correction strategies with ISTDs inappropriate.
CRediT authorship contribution statement
Mathias B. Jørgensen: Investigation, Formal analysis, Writing –
original draft, Writing – review & editing, Visualization, Methodology, Conceptualization. Jan H. Christensen: Project administration, Supervision, Writing – review & editing, Conceptualization,
Methodology.
Acknowledgments
4. Conclusion
This study is a contribution to the VANDALF project under
grant agreement No. 9067-0 0 032B and supported by the Innovation Fund Denmark. We would like to thank MSCi for making laboratory facilities and a GC-MS instrument available for our disposition. Furthermore, we would like to thank the reviewers for valuable suggestions, which improved the manuscript.
The four analyte protectants 3-ethoxy-1,2-propanediol, Dsorbitol, gluconolactone, and shikimic acid were able to enhance
the signals of investigated micropollutants in pure standard and
effluent wastewater samples. Matrix enhancement effects were observed for six micropollutants in effluent and 11 out of 13 investigated micropollutants in influent wastewater. Especially micropollutants containing one or several of the following reactive groups;
hydroxyl, primary amine, amide, ketone, carboxylic acid, and imidazole were recognized as susceptible to enhancement effects in
wastewater samples and in samples with APs. MEs of the micropollutants were increasing with content of matrix components in
the wastewater samples, and the largest MEs were observed for
influent samples. Analyte protectants were able to significantly enhance the signals of pure standard and effluent wastewater samples. This was not the case for influent samples, also indicating a
high matrix contribution from influent wastewater alone. Correction of MEs with APs resulted in comparable overall results with
the method of allocating a best matching ISTD to each target compound. The best overall correction of MEs was observed using APs
and ISTDs in combination.
Supplementary materials
Supplementary material associated with this article can be
found, in the online version, at doi:10.1016/j.chroma.2022.463280.
References
[1] R.P. Schwarzenbach, B.I. Escher, K. Fenner, T.B. Hofstetter, C.A. Johnson, U. Von
Gunten, B. Wehrli, The challenge of micropollutants in aquatic systems, Science
313 (5790) (2006) 1072–1077, doi:10.1126/science.1127291.
[2] J. Margot, L. Rossi, D.A. Barry, C. Holliger, A review of the fate of micropollutants in wastewater treatment plants, Wiley Interdiscip. Rev. Water 2 (5)
(2015) 457–487, doi:10.1002/wat2.1090.
[3] J.Y. Tang, S. McCarty, E. Glenn, P.A. Neale, M.S.J. Warne, B.I. Escher, Mixture
effects of organic micropollutants present in water: towards the development
of effect-based water quality trigger values for baseline toxicity, Water Res. 47
(10) (2013) 3300–3314, doi:10.1016/j.watres.2013.03.011.
[4] The European Union, Directive 2013/39/EU of the European parliament and of
the council – amending directives 20 0 0/60/EC and 20 08/105/EC as regards priority substances in the field of water policy, Off. J. Eur. Union 12 (2013) 1–17
of august 2013.
[5] M. Krauss, H. Singer, J. Hollender, LC–high resolution MS in environmental analysis: from target screening to the identification of unknowns, Anal.
Bioanal. Chem. 397 (3) (2010) 943–951, doi:10.10 07/s0 0216- 010- 3608- 9.
Declaration of Competing Interest
The authors declare that they have no known competing financial interests or personal relationships that could have appeared to
influence the work reported in this paper.
6
M.B. Jørgensen and J.H. Christensen
Journal of Chromatography A 1676 (2022) 463280
ˇ
[16] T. Cajka,
K. Maštovská, S.J. Lehotay, J. Hajšlová, Use of automated direct sample introduction with analyte protectants in the GC-MS analysis of pesticide
residues, J. Sep. Sci. 28 (9–10) (2005) 1048–1060, doi:10.10 02/jssc.20 050 0 050.
[17] K. Maštovská, S.J. Lehotay, M. Anastassiades, Combination of analyte protectants to overcome matrix effects in routine GC analysis of pesticide residues in
food matrixes, Anal. Chem. 77 (24) (2005) 8129–8137, doi:10.1021/ac0515576.
[18] P. Payá, M. Anastassiades, D. Mack, I. Sigalova, B. Tasdelen, J. Oliva, A. Barba,
Analysis of pesticide residues using the quick easy cheap effective rugged
and safe (QuEChERS) pesticide multiresidue method in combination with gas
and liquid chromatography and tandem mass spectrometric detection, Anal.
Bioanal. Chem. 389 (6) (2007) 1697–1714, doi:10.1007/s00216-007- 1610- 7.
[19] S. Barrek, C. Cren-Olivé, L. Wiest, R. Baudot, C. Arnaudguilhem, M.F. GrenierLoustalot, Multi-residue analysis and ultra-trace quantification of 36 priority
substances from the European water framework directive by GC–MS and LCFLD-MS/MS in surface waters, Talanta 79 (3) (2009) 712–722, doi:10.1016/j.
talanta.2009.04.058.
[20] A. Purdešová, S. Hrouzková, M. Andrašˇcíková, Z. Krascsenits, E. Matisová, Evaluation of calibration approaches for quantification of pesticide residues in surface water by SPE with small-size cartridges followed by fast GC-MS, Anal.
Methods 5 (13) (2013) 3403–3409, doi:10.1039/C3AY40412A.
[21] EU Reference Laboratories for Residues of Pesticides – Single Residue Methods (2013). Use of analyte protectants in GC-analysis. A way to improve
peak shape and reduce decomposition of susceptible compounds, 1-5, CVUA
Stuttgart, Schaflandstr. 3/2, 70736 Fellbach, Germany. Retrieved from: https:
//www.eurl- pesticides.eu/library/docs/srm/EURL_Observation- APs.pdf.
[22] S. Tisler, D.I. Pattison, H.J. Christensen, Correction of matrix effects for reliable
non-target screening LC–ESI–MS analysis of wastewater, Anal. Chem. 93 (24)
(2021) 8432–8441, doi:10.1021/acs.analchem.1c00357.
[23] S. Yudthavorasit, W. Meecharoen, N. Leepipatpiboon, New practical approach
for using an analyte protectant for priming in routine gas chromatographic
analysis, Food Control 48 (2015) 25–32, doi:10.1016/j.foodcont.2014.05.005.
[24] T. Tsuchiyama, M. Katsuhara, J. Sugiura, M. Nakajima, A. Yamamoto, Combined use of a modifier gas generator, analyte protectants and multiple internal standards for effective and robust compensation of matrix effects in gas
chromatographic analysis of pesticides, J. Chromatogr. A 1589 (2019) 122–133,
doi:10.1016/j.chroma.2018.12.051.
[6] R. Rodríguez-Ramos, S.J. Lehotay, N. Michlig, B. Socas-Rodríguez,
M.Á. Rodríguez-Delgado, Critical review and re-assessment of analyte
protectants in gas chromatography, J. Chromatogr. A (2020) 461596,
doi:10.1016/j.chroma.2020.461596.
[7] D.R. Erney, A.M. Gillespie, D.M. Gilvydis, Explanation of the matrix-induced
chromatographic response enhancement of organophosphorus pesticides during open tubular column gas chromatography with splitless or hot on-column
injection and flame photometric detection, J. Chromatogr. 638 (1993) 57–63,
doi:10.1016/0 021-9673(93)850 07-T.
[8] M.M. Rahman, A.A. El-Aty, J.H. Shim, Matrix enhancement effect: a blessing or
a curse for gas chromatography?—A review, Anal. Chim. Acta 801 (2013) 14–21,
doi:10.1016/j.aca.2013.09.005.
[9] M. Caban, N. Migowska, P. Stepnowski, M. Kwiatkowski, J. Kumirska, Matrix
effects and recovery calculations in analyses of pharmaceuticals based on the
determination of β -blockers and β -agonists in environmental samples, J. Chromatogr. A 1258 (2012) 117–127, doi:10.1016/j.chroma.2012.08.029.
[10] T. Tsuchiyama, M. Katsuhara, M. Nakajima, Compensation of matrix effects in
gas chromatography–mass spectrometry analysis of pesticides using a combination of matrix matching and multiple isotopically labeled internal standards,
J. Chromatogr. A 1524 (2017) 233–245, doi:10.1016/j.chroma.2017.09.072.
[11] A.G. Frenich, J.L.M. Vidal, J.L.F. Moreno, R. Romero-González, Compensation for
matrix effects in gas chromatography–tandem mass spectrometry using a single point standard addition, J. Chromatogr. A 1216 (23) (2009) 4798–4808,
doi:10.1016/j.chroma.2009.04.018.
[12] K. Fang, X. Pan, B. Huang, J. Liu, Y. Wang, J. Gao, Simultaneous derivatization
of hydroxyl and ketone groups for the analysis of steroid hormones by GC-MS,
Chromatographia 72 (9) (2010) 949–956, doi:10.1365/s10337- 010- 1736- 1.
[13] C.F. Poole, Matrix-induced response enhancement in pesticide residue analysis
by gas chromatography, J. Chromatogr. A 1158 (1–2) (2007) 241–250, doi:10.
1016/j.chroma.2007.01.018.
[14] A.K. Boysen, K.R. Heal, L.T. Carlson, A.E. Ingalls, Best-matched internal standard
normalization in liquid chromatography–mass spectrometry metabolomics applied to environmental samples, Anal. Chem. 90 (2) (2018) 1363–1369, doi:10.
1021/acs.analchem.7b04400.
[15] M. Anastassiades, K. Maštovská, S.J. Lehotay, Evaluation of analyte protectants
to improve gas chromatographic analysis of pesticides, J. Chromatogr. A 1015
(1–2) (2003) 163–184, doi:10.1016/S0021-9673(03)01208-1.
7