A simple method for routine measurement of organosulfur compounds in complex liquid and gaseous matrices
Bạn đang xem bản rút gọn của tài liệu. Xem và tải ngay bản đầy đủ của tài liệu tại đây (1.37 MB, 8 trang )
Journal of Chromatography A 1677 (2022) 463276
Contents lists available at ScienceDirect
Journal of Chromatography A
journal homepage: www.elsevier.com/locate/chroma
A simple method for routine measurement of organosulfur
compounds in complex liquid and gaseous matrices
Margo Elzinga a,b, Julian Zamudio a, Sean van Boven kaarsmaker a, Tonke van de Pol a,
Jan Klok a,b, Annemiek ter Heijne a,∗
a
b
Environmental Technology, Wageningen University, Bornse Weilanden 9, P.O. Box 17, 6700 AA Wageningen, the Netherlands
Paqell B.V, Reactorweg 301, 3542 AD, Utrecht, the Netherlands
a r t i c l e
i n f o
Article history:
Received 7 June 2022
Accepted 22 June 2022
Available online 28 June 2022
Keywords:
Volatile organosulfur compound (VOSC)
Thiol
Disulfide
Flame Photometric Detector (FPD)
Gas chromatography (GC)
Henry coefficient
a b s t r a c t
The measurement of VOSCs in complex matrices is challenging due to their volatile and reactive nature. A straightforward method using headspace chromatography was developed for routine analyses of
organosulfur compounds in a high saline liquid matrix with a pH of 8.4. Direct sample acidification with
a 1M acetate buffer (pH 3.6) showed an increased response for methanethiol, ethanethiol, propanethiol,
dimethyl sulfide, dimethyl disulfide and diethyl disulfide. A good quadratic fit (R2 <0.995) was obtained
for each compound over a calibration range of 5 μM-S until 125 μM-S (μmol sulfur/L). Gas standards
were measured using the same chromatographic conditions over a calibration range of 0.08 μM-S until
1.85 μM-S (R2 <0.999). Gas standards could also be used to calibrate the liquid phase with a response
ratio of 105.2% for ET, 107% for DMS, 105.7% for PT, 108.9% for DMDS and 106% for DEDS. This alternative calibration strategy reduced the preparation time and does not rely on liquid standards, which
were unstable over time. This method was used to determine Henry constants for the organosulfur compounds both in demineralized water and the high saline liquid matrix and to analyze samples from a
bio electrochemical experiment that treated methanethiol. This new method allows for routine analysis
of samples originating from natural gas desulfurization plants and can potentially also be used to analyze
organosulfur compounds in other complex waste streams.
© 2022 The Author(s). Published by Elsevier B.V.
This is an open access article under the CC BY license ( />
1. Introduction
There is a widespread interest for reliable and simple methods to measure volatile organosulfur compounds (VOSCs) in both
gaseous and liquid samples. Low weight organosulfur compounds,
such as methanethiol (MT), ethanethiol (ET), propanethiol (PT) and
hydrogen sulfide (HS), are formed in industrial processes, including wastewater treatment plants [1–3], manure digestion [4], composting plants [5], paper [6,7] and rayon production [6–8] These
organosulfur compounds and hydrogen sulfide are also present
in natural gas and crude oil [9–11]. Furthermore, VOSCs play
an important role in the global sulfur cycle [6,12–14]. Industrial
VOSC emissions are strictly regulated as concentrations as low as
0.14 ppbv can already cause significant olfactory discomfort for
the surrounding population and their potential toxicity at higher
∗
Corresponding author:
E-mail address: (A. ter Heijne).
concentrations [15]. To develop efficient VOSC removal strategies
and to comply with environmental safety regulations, reliable and
simple measurement methods are required. However, accurate and
straightforward measurement of these compounds remains a challenge. These challenges include the highly reactive nature of the
VOSCs, the complex matrixes in which they are present and the
accurate measurements at low concentrations.
The high volatility and reactivity of VOSCs puts a strain on
sampling procedures, sample storage and complicates pretreatment
steps [16]. The matrix in which the VOSCs are measured further complicates the measurement of VOSCs. The measurement of
gaseous matrices is relatively straightforward as long as the samples are kept anaerobic and sorption to the sampling equipment is
avoided. Liquid matrices, however, can also catalyze chemical reactions and may contain particles onto which VOSCs can adsorb [17].
In addition, microorganisms present in liquid samples may convert
VOSCs [18]. One particularly difficult matrix containing VOSCs is
found in the gas and oil industry, where H2 S and VOSCs are ex-
/>0021-9673/© 2022 The Author(s). Published by Elsevier B.V. This is an open access article under the CC BY license ( />
M. Elzinga, J. Zamudio, S. van Boven kaarsmaker et al.
Journal of Chromatography A 1677 (2022) 463276
tracted using caustic or amine solutions [9,19]. These solutions typically have a high pH (10-12) and salinity (>0.5M Na+ ) with a total sulfur content ranging from 0.1 to 4 wt% [20]. High pH values
are known to increase reactivity of VOSCs and salt precipitation
due to the high salinity in liquid samples may shortens the lifetime of analytical equipment. No straightforward method for routine measurement of VOSCs in this complex liquid matrix has been
described so far.
Various techniques, including HPLC [21], spectrophotometry
[22], voltammetry [23], have been developed to measure VOSCs in
different liquid matrices. Unfortunately, these systems are unable
to measure gaseous samples and would require a combination of
methods to analyze both gas and liquid samples. Alternatively, gas
chromatography (GC) can be used to measure VOSCs in both gas
and liquid samples [24,25]. Various detectors can be used to measure sulfur compounds on a gas chromatograph. The Sulfur Chemiluminescence Detector (SCD) and the Flame Photometric Detector
(FPD) are two detectors that have a high selectivity and sensitivity towards sulfur compounds [26,27]. High reproducibility and accuracy for gaseous samples can be obtained with both detectors.
Even though the SCD has a higher sensitivity, FPD is more widely
used due to its lower costs, low maintenance and overall robustness [26].
Another major challenge, in addition to analyze both gas and
liquid samples, is measuring VOSCs at low concentrations which
often requires preconcentration steps. Usually, concentration methods like purge and trap [28,29] or SPME [30–33]are applied to
measure VOSCs at low concentrations. However, these methods obtained results with high standard deviations as the volatile and reactive nature of these compounds becomes an issue during these
pre-treatment steps [16]. Furthermore, preconcentration steps are
time consuming, require expensive equipment and are sensitive to
losses due to dimerization and volatilization [31]. Direct injection
of liquid samples in a GC may avoid the need for tedious preparation procedures and is applied in e.g. the analysis of volatile fatty
acids [34,35]. A disadvantage of direct injection of liquid samples is
that the equipment requires frequent maintenance especially with
high saline matrices. Furthermore, the high salt concentrations increase the risk of VOSCs deposition in the injector as a sodium
salt.
Direct measurement using a static headspace chromatography
forms a potential solution for measuring VOSCs in high saline
liquid matrices. This method requires minimal sample treatment
and small sample volumes and was applied to analyze samples
from a municipal wastewater treatment plants [25]. With this
method a recovery of 83% for methanethiol, 103% for dimethyl
sulfide (DMS) and 102 for to 103% dimethyl disulfide (DMDS) was
achieved in wastewater samples. However, the method included
various pretreatment steps including acidification for sample
storage and neutralization before analysis. Furthermore, the
method was not specialized for highly saline samples with high
pH values, and its applicability for ethanethiol, propanethiol,
diethyl disulfide (DEDS) and hydrogen disulfide, was not
evaluated.
In this work, a fast and straightforward method to measure
VOSCs in the gas and the liquid phase using static headspace
chromatography on a GC-FPD was developed. All samples were
analyzed without preconcentration steps to minimize the risk of
VOSCs losses and conversions during sample preparation. Different
acidification strategies were evaluated to improve the chromatographic response for the liquid samples. The influence of different (bio) gas compositions in gas samples was evaluated. The calibration range, intermediate precision, quantification, and detection
limits were evaluated. Additionally, the method was used to determine Henry coefficients in a high saline liquid matrix and in
demineralized water
2. Material and methods
2.1. Equipment
Gas chromatography was used to analyze gas and liquid samples. The gas chromatograph (Shimadzu Nexis GC-2030, Shimadzu,
Germany) was equipped with a headspace autosampler (Shimadzu
H20 plus, Shimadzu, Germany) increasing injection precision and
minimizing physical presence. The incubation temperature of the
autosampler was set at 60°C with an equilibration time of 7 min.
Additional mechanical shaking was applied for liquid samples during the incubation period. Following the incubation period, nitrogen gas was used to obtain an overpressure in the sample vials
before sample injection (35 kPa for gas samples and 60 kPa for
liquid samples). The split/splitless injector with a 250 μL loop was
operated in spitless mode at 150°C. A total volume of 250 μL was
injected. The sulfur compounds were separated on an intermediate polar capillary column (ZB-624PLUS, 30 m length, 0.530 mm
diameter, 3.0 μm film thickness, Phenomenex, UK) using nitrogen
as a carrier gas with a flow of 2.54 mL/min. The oven temperature
was programmed at 35°C and maintained for 3 min after injection. Thereafter a temperature ramp of 40°C/min until 180°C was
applied. The temperature was maintained at 180°C for 4 min. The
gas chromatograph was equipped with a flame photometric detector (FPD) using an optical sulfur filter (Optical filter ASSY (S)
for FPD-2030 Shimadzu, Germany) and operated at 250°C with a
40 mL/min hydrogen and 60 mL/min air flow. Labsolutions 5.93
(Shimadzu, Germany) was used to operate the system and analyze
the data.
2.2. Gas calibration standards
Amber glass vials (1.5 mL) were filled with liquid organosulfur compounds (purity >99.6%) and were used to prepare mixed
gas standards. The vials were closed with PTFE lined caps (Septa
N11 rubber/PTFE red hardness 45, shore A, MACHEREY-NAGEL, Germany). The equivalent of 1 mmol-S of ET, PT, DMS, DMDS and
DEDS was transferred from the amber glass vials with a glass syringe (Hamilton, USA) to a 2.28 L glass bottle that was closed
with a butyl rubber stopper (Bromobutyl rubber Stopper for GL 45,
DWK Life Sciences GmbH, Germany) to prepare a mixed gas standard. Following preparation, the mixed gas standard was heated
for 30 min at 50°C to fully vaporize the organosulfur compounds
before further gas dilutions were made. To obtain the final working
stock, 5 mL of the mixed gas standard was transferred to a 120 mL
serum flask resulting in a final concentration of 20 μM-S (μmol sulfur/L) for each compound. These working stocks were used for 2
weeks without changes in the gas composition and signal intensity. The calibration curve was obtained by diluting the working
stock into 10 mL vials over a concentration range of 0.08–1.85 μMS for each compound. All standard preparations were performed
in an anaerobic chamber that was continuously flushed with nitrogen gas. Serum flasks and 10 mL vials were closed with 3 mm
PTFE lined butyl rubber crimp seal caps in a 100% nitrogen atmosphere (Septa butyl/PTFE Gray hardness 50, shore A, MACHEREYNAGEL, Germany). H2 S and MT standards were prepared from a
gas standard containing 207 ppmv H2 S and 206 ppmv MT in 100
%N2 (Linde Gas Benelux B.V, The Netherlands)
The accuracy of the calibration is strongly influenced by the
evaporation of the pure compounds used to prepare the mixed
gas standard. Full vaporization of pure compounds was therefore
evaluated by comparing the chromatographic response for mixed
gas standards that were prepared at room temperature and subsequently heated for 30 min at 40, 50 and 60° before working stocks
with a final concentration of 0.223 μM and 0.372 μM were prepared.
2
M. Elzinga, J. Zamudio, S. van Boven kaarsmaker et al.
Journal of Chromatography A 1677 (2022) 463276
Table 1
Evaluated gas compositions for signal quenching
2.3. Liquid headspace calibration standards for liquid samples
Liquid headspace calibration standards were prepared in a similar matrix (high salinity, high pH) that can be found in biodesulfurization plants [20] and contained 4.42 g/L Na2 CO3 , 49 g/L
NaHCO3 , 0.2 g/L MgCl2 x 6 H2 O, 1 g/L KH2 PO4 , 0.01 g/L CaCl2 2
H2 O, 0.6 g/L CH4 N2 O, 1 g/L NaCl, with a final pH of 8.4.
Pure solutions (>99.6%) of ET, DMS, PT, DMDS and DEDS were
used to prepare individual 10 mM stock solutions in methanol. A
MT stock solution (10 mM) was prepared from its sodium salt in
Milli-Q. Mixed working stock solutions were prepared in the high
pH and highly saline matrix from the 10 mM standards obtaining a
concentration of 125 μM-S for each compound. The working stock
was further diluted with same matrix into the 10 mL vials creating
the calibration standards over a range of 5 μM-S until 125 μMS. The volume of the liquid standards in the 10 mL vials was
200 μL.
The influence of different acids on the exclusion of organosulfur
compounds from the liquid phase was evaluated. The acids used to
lower the pH of liquid samples were a glycine buffer (0.2 M glycine
and 0.2 M HCl, pH 3), a HCl solution (0.5 M, pH 0.3) and an acetate buffer (1M, pH 3.6). Working solutions with a concentration
of 50 μM-S following the procedure described in this manuscript
were prepared. The 10 mL vials were filled with 200 μL of working solution and 200 μL of acid. The blank was prepared by adding
200 μL of working solution without VOSCs.
The use of gas standards to calibrate liquid samples was evaluated to shorten and ease the liquid calibration procedure. The
10 mL vials were filled with 200 μL of saline matrix and 200 μL of
acetate buffer. Organosulfur compounds from the mixed gas standard were added with an air-tight syringe (Hamilton, USA). The response was compared with results obtained with liquid standards.
All standard preparations were, like gas standard preparations,
performed in an anaerobic chamber that was continuously flushed
with nitrogen and dilutions were made with gas tight glass syringes. Water, high pH saline matrix and buffer solutions were
sparged with nitrogen for 20 min to ensure anaerobic conditions,
before the addition of organosulfur compounds.
Mixture
N2
CO2
CH4
1
2
3
4
5
6
7
100
25
50
50
90
85
80
0
50
25
50
0
10
10
0
25
25
0
10
5
10
2.5. Method application
2.5.1. Henry coefficient determination
Henry coefficients were defined for MT, ET, PT, DMS, DMDS, and
DEDS. The standard solutions, with a concentration of 3.8 mM-S
for DEDS and 10 mM-S for all other evaluated compounds, were
prepared in demineralized water under anaerobic conditions. The
experiments were performed in 120 mL serum flasks that were
sealed with PTFE lined butyl rubber crimp seal caps. The flasks
were filled with 50 mL saline matrix or demineralized water and
sparged with nitrogen gas for 20 min. The organosulfur compounds
were injected from the standard solution into these vials resulting
in the addition of 100 μmol-S. Flasks were stored at 25°C during
24 h before samples were taken from the gas phase. Henry coefficients were defined in triplicate for each compound in both saline
matrix and demineralized water.
The henry coefficient was calculated by the following equation:
Hc =
cL
=
cg
VL Cin −Vg cg
VL
cg
With Hc (-) as the water-air partitioning coefficient, CL (μM) as the
concentration in the liquid phase, Cg (μM) concentration in the gas
phase, Cin (μM) initial concentration of organosulfur, VL (L) volume
of the liquid phase in the serum flask and Vg (L) volume of the gas
phase in the serum flask.
2.4. Assessment of chromatographic response
2.5.2. Samples of lab scale bioelectrochemical reactor treating MT
The chromatographic method was evaluated by comparing the
results of 6 (MT and H2 S) and 10 (ET, PT, DMS, DMDS and DEDS)
replicates of the calibration curve of gas and liquid standards. The
peak separation was observed to assess the selectivity. The determination coefficient was used to evaluate linearity and the precision was evaluated by comparing the RSD values at the lowest
calibration point. The limit of quantification (LOQ) and limit of detection (LOD) were calculated by using the calibration approach
[36,37].
The chromatographic method was further evaluated by assessing the influence of incubation time and different (bio)gas compositions. The influence of incubation time was evaluated by injecting
the headspace of a 10 μM-S ethanethiol liquid standard (gas standard for liquid calibration procedure) after an incubation time of
5, 7 min and with a gas standard containing 10 μM-S propanethiol
and dimethyl disulfide after an incubation time of 5, 7, 10, 12 and
15 min. Additionally, the influence of (bio)gas composition was
evaluated by preparing working stocks in 120 mL serum flasks
with different gas compositions (Table 1). Working stocks containing ethanethiol, dimethyl sulfide, propanethiol and dimethyl disulfide were diluted into the 10 mL vials to obtain a final concentration of 1 μM-S. The relative response at different conditions was
calculated by dividing the natural logarithm of the response area
(μV·min) by the natural logarithm of the response area obtained
under a 100% nitrogen atmosphere.
The conversion of VOSCs in lab scale bioelectrochemical systems treating methanethiol was analyzed using the developed
method for gas phase measurements and the obtained henry coefficients in the saline matrix. A bioelectrochemical systems was
constructed as described by Elzinga et al., and the biocathode potential was controlled at – 800 mV vs Ag/AgCl [18]. The reactors
were inoculated with biomass obtained from a papermill wastewater treatment plant (Eerbeek, the Netherlands) and at the start of
the experiment 75 μmol MT was added to the reactor. Gas samples
(1 mL) were taken during the first 9 days and analyzed directly.
The Henry coefficients that were defined in this manuscript were
used to estimate the concentration in the liquid phase.
3. Results and discussion
3.1. Method development
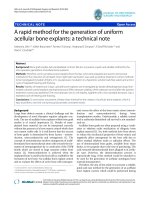
The method parameters were varied to obtain a good chromatographic response. The chromatograms show a good peak separation and resolution (Fig. 1) under the conditions described in the
materials and methods. Each compound has a different response
area, which is typical for FPD systems were the response is influenced by the molecular structure [38,39]. The background noise of
the blank sample was small indicating a high sensitivity for the
3
M. Elzinga, J. Zamudio, S. van Boven kaarsmaker et al.
Journal of Chromatography A 1677 (2022) 463276
Figure 1. Chromatogram showing a good peak separation of H2 S, MT, ET, DMS, PT, DMDS and DEDS in the gas phase (A) and liquid phase (B) at the lowest gas calibration
point.
sulfur compounds typical for FPD detectors [39]. The method had
a high selectivity as no detectible interference was observed in the
blank chromatograms in both gas and liquid phase.
3.1.1. Equilibration time
The influence of the equilibration time in both the gas and
liquid phase was evaluated by analyzing the response area after
different equilibration times. The test showed a similar response
area (SI-1) with RSD values of 0.29 % for ethanethiol in the liquid
phase, and 0.35% for propanethiol and 0.46% for DMDS in the gas
phase. The low variation between the different equilibration times
shows sorption/desorption processes in the glass vials were finalized within 7 min for both propanethiol and DMDS and that a gasliquid equilibrium was obtained for ethanethiol within the same
period. Similar behavior for the other organosulfur compounds was
assumed. Therefore, a equilibration time of 7 min was considered
sufficient to measure all compounds accurately.
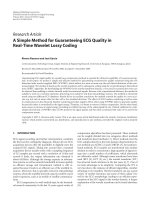
Figure 2. The relative response of propanethiol (PT) and dimethyl disulfide (DMDS)
at different gas compositions compared to the response under a 100% nitrogen atmosphere
tors [38–41]. The (bio)gas composition in industrial processes can
vary substantially at different sites with varying concentrations of
methane and carbon dioxide and may therefore influence the FPD
response. Propanethiol and DMDS were used as model compounds
to represent thiols and disulfides to evaluate the influence signal
quenching (chromatograms can be found in SI-3). The response of
PT and DMDS was close to 100% with increased carbon dioxide or
methane concentrations (Fig. 2). The results show a maximum response variation of 1.1% for propanethiol and 1.6% for DMDS compared to the 100% nitrogen reference. Therefore, the matrix effects
and signal quenching due to the presence of methane and carbon
dioxide were minimal under the evaluated conditions.
Signal quenching in liquid samples due to the coelution of organic solvents e.g. methanol is another known phenomenon that
can be limited by operating the injector in split mode [42]. However, the developed method was specified for a highly saline water
3.1.2. Temperature gas standard preparation
The preparation of the mixed gas standard from pure liquids requires complete vaporization of these compounds towards the gas
phase before further dilutions can be made to obtain the calibration line. Therefore, vaporization of the VOSCs was evaluated after
heating the mixed gas standard to different temperatures. Full vaporization of thiols occurred at room temperature, whereas 30 min
of heating at 50°C was required for the full vaporization of disulfides (SI-2). This temperature was therefore used to prepare standards for further evaluation of the method.
3.1.3. Signal quenching
Signal quenching due to the coelution of hydrocarbon compounds is a well-known problem for flame photometric detec4
M. Elzinga, J. Zamudio, S. van Boven kaarsmaker et al.
Journal of Chromatography A 1677 (2022) 463276
Table 2
Influence of acidification on pH and response area measured at an organosulfur concentration of 0.05 mM-S.
Response Area (μV∗ min)
No buffer
0.2 M Glycine + 0.2 M HCl
0.5 M HCl
1 M Acetic acid
∗
pH
MT
ET
DMS
PT
DMDS
DEDS
8.5
4.7
3.4
6.4
15
30
2.881
140.654
0
24
1.743
107.457
68
79
12.050
657.432
9
22
6.217
179.327
42
0
3.035
535.185
n.d
0
2.855
571.821
n.d = not detected.
solvent. VOSCs are more volatile compared to water and presence
of water vapor was expected to have limited influence on the signal intensity and therefore not further evaluated.
ever, we recommend the use of gas standards for liquid calibration for routine analyses, as it simplifies the calibration procedures
and obtains good results to follow system dynamics and long-term
trends.
3.1.4. Sample acidification and salting out effects
3.2. Method validation
In general, organosulfur compounds oxidize faster at a high
pH values [43] and acidification can be used as a strategy to
minimize the oxidation and maintain sample integrity. Acidification of municipal wastewater samples with HCl in anaerobic vials
was previously shown to suppress oxidation of methanethiol and
samples remained stable for 24 h [29]. Alternative strategies to
avoid oxidation include the addition of Na2 SO3 to a sample vial.
Na2 SO3 consumes the available oxygen and can limit oxidation.
However, when added in excess, sodium sulfate can reduce DMDS
to methanethiol, altering the concentrations of both components
[29]. To maintain sample integrity, acidification was therefore preferred in this study.
The obtained response areas for acidified samples are presented
in Table 2. The largest response area for each VOSCs was found
when an acetate buffer was added to the samples. The response
when HCl was used for acidification was 28 to 200 smaller compared to the acetate buffer and samples acidified with a glycine
and HCl showed almost no response for each of the organosulfur
compounds. Interestingly, the solution with the highest pH after
acidification showed the largest response area. A pH of 6.4 is sufficient to convert over 99% of thiols to their conjugate acid (i.e. pKa
thiols >10 see SI-4), allowing them to transfer to the gas phase.
Therefore, the acid formation did not form the main contribution
for the increased exclusion of VOSCs from the liquid phase and the
higher response areas that were found. This is also confirmed by
the increased exclusion of disulfides which do not dissociate. The
salting out effect on the other hand may have played a dominating role in the increased exclusion. The acetic acid buffer had the
highest salinity and therefore might have the largest salting out
effect. Which would also explain the increased exclusion of DMDS
and DEDS.
3.2.1. Linearity
Calibration lines for H2 S, MT, ET, PT, DMS, DMDS and DEDS for
gas analyses were constructed over a concentration range of 0.074–
1.85 μM. The calibration curves are presented in Fig. 3a and 3b and
the corresponding line equations can be found in Table 3. These
calibration lines had exponential characteristics typical for FPD detectors. A linear relationship with determination coefficients R2 >
0.999 for all compounds was obtained when analyzing the natural
logarithm of the peak area and the natural logarithm of the sulfur
concentration. Preliminary results showed that the concentration
range could be extended to 10 μM without compromising the determination coefficients of the calibration line (results not shown).
The extension of the calibration line was not further evaluated as
gaseous samples can be diluted within the calibration range by adjusting the sample volume added to the 10 mL vials.
The calibration lines for MT, ET, PT, DMS, DMDS and DEDS for
liquid analyses were constructed over a calibration range of 5–
125 μM (Fig. 3c and 3d). Liquid samples with higher concentrations
can be measured by decreasing the sample injection volume and
addition of saline matrix reaching a total volume of 200 μL. The
determination coefficient for liquid standards is slightly lower (R2
> 0.996) than the determination coefficient for the gaseous standards and could be the result of the observed increased reactivity of organosulfur compounds in the liquid phase. Even though
an increased reactivity in liquid standards was observed, the determination coefficients were still good. We observed an increased
reactivity of the VOSCs standards when H2 S was added to the liquid standard (results not shown). When a calibration for H2 S in
the liquid phase is required we recommend constructing separate
calibration curves for H2 S and for VOSCs. For analyses of environmental samples containing both organosulfur compounds and H2 S
in the liquid phase we recommend fast analyses to maintain sample integrity.
3.1.5. Simplification of liquid calibration procedure
Gas working standards were stable for 2 weeks after preparation when stored at 4°C(See SI-5). Liquid working standards, however, did not remain stable and dimerization and oxidation reactions in the liquid resulted in various peaks in the chromatograms
within 2 days after standard preparation (See SI-6). These peaks
were not further identified, and liquid standards could thus only
be used directly after preparation.
Gas standards were more stable compared to liquid standards
and were therefore used to simplify the calibration procedure of
the liquid phase. An average response ratio of 105.2% for ET, 107.0%
for DMS, 105.7% for PT, 108.9% for DMDS and 106.0% for DEDS was
found (SI-7) when the use of gas standards to calibrate the liquid
phase were compared to liquid standards. Therefore, the use of gas
standards for liquid calibration under the applied conditions results in a slight under-estimation of the actual concentration. How-
3.2.2. Reproducibility and detection limits
Multiple gas calibration lines, produced over various days, indicated a high reproducibility with RSD values below 3.5% at the
lowest calibration point (0.074 μM) (Table 3). The liquid phase calibration lines showed lower RSD values ranging from 0.4% to 0.9%
at the lowest calibration point (5μM). The increased reproducibility in liquid samples is likely related to the higher concentration at
which the calibration of the liquid phase started. Cheng et al. measured organosulfur compounds in the liquid phase on a GC-MS and
found RSD values in the same range with values varying between
0 and 8%. However, their method required a 25-min purge and
trap pretreatment procedure [29], whereas the method described
5
M. Elzinga, J. Zamudio, S. van Boven kaarsmaker et al.
Journal of Chromatography A 1677 (2022) 463276
Figure 3. Calibration curve and linearity of tested VOSCs in the gas phase (A and B) and liquid phase (C and D) using gas standards showing good linearity.
Table 3
Overview of gas and liquid calibration parameters.
VOSCS
Calibration Range (μM)
LOQ nM
LOD nM
Slope
Intercept
R2
RSD %∗
0.084-1.68
0.071-1.42
0.074-1.85
0.074-1.85
0.074-1.85
0.074-1.85
0.074-1.85
10.05
16.2
5.76
2.17
4.85
2.83
4.83
4.22
7.07
3.72
1.30
3.09
1.72
2.90
2.114
2.114
2.372
2.089
0.964
1.056
0.951
12.200
12.200
14.838
7.875
0.691
-1.034
-1.128
0.999
0.999
0.999
0.999
0.999
0.999
0.999
1.85
1.35
3.08
1.51
2.48
2.70
3.48
5-125
5-125
5-125
5-125
5-125
5-125
7.22
2.59
2.01
2.63
2.06
14.02
4.43
1.55
1.18
1.57
1.23
7.66
0.646
0.982
1.126
0.882
1.000
0.948
3.451
1.080
-2.521
1.422
-0.053
1.004
0.996
0.998
0.999
0.997
0.999
0.998
0.6
0.4
0.5
0.6
0.5
0.9
Gas
H2S
MT
ET
DMS
PT
DMDS
DEDS
(n=6)
(n=6)
(n=10)
(n=10)
(n=10)
(n=10)
(n=10)
Liquid∗∗
MT
ET
DMS
PT
DMDS
DEDS
∗
∗∗
(n=10)
(n=10)
(n=10)
(n=10)
(n=10)
(n=10)
RSD at for the lowest calibration point; 0.074 μM for gas and 5 μM for liquid standards.
Liquid calibration with gas standards
in this manuscript shows not only a higher reproducibility but is
also based on direct measurement. Direct headspace analyses in
wastewater samples was also performed by Sun et al., and showed
a spiked sample recovery between 83 and 103% for MT, DMS and
DMDS using a GC-SCD [25].
The limit of quantification for gas standards was between
2.17nM and 16.2 nM and for liquid standards between 2.01 and
14.2. Within the gas standards, the quantification limits were
higher for the smaller molecules, i.e. hydrogen disulfide and
methanethiol, whereas the limit of quantification in the liquid
phase was especially high for DEDS. Indicative experiments (results not shown) demonstrated that the limit of quantification
can be further increased by increasing the injection volume to
the column for both gaseous and liquid analyses. The signal to
noise ratio should be studied to further evaluate the limit of quantification when using larger injection volumes. Furthermore, the
use of different split ratios may assist in avoiding loss of efficiency by overloading the column. Another strategy to increase
the limit of quantification for liquid samples is to further explore the influence of acidification and salting out as these resulted in a higher VOSCs concentration in the headspace and an
increased response area on the chromatograms. However, changes
in matrix effect should be considered and further evaluated. Direct liquid injection is not preferred as the expansion volume
of the water and the resulting pressure changes will limit the
methods precision. Furthermore, the deposition of salts reduce
6
M. Elzinga, J. Zamudio, S. van Boven kaarsmaker et al.
Journal of Chromatography A 1677 (2022) 463276
Table 4
Overview of the henry coefficients for the five studied organosulfur compounds:
ethanethiol, propanethiol, dimethyl sulfide, dimethyl disulfide, and diethyl disulfide, in demineralized water and saline matrix and their relative standard deviations.
OSC
MT
ET
PT
DMS
DMDS
DEDS
Demineralized water
Saline matrix
Demineralized water
This study
This study
[30]
11.93 ± 5.0
5.90 ± 3.4
5.03 ± 4.3
13.93 ± 5.2
13.53 ± 1.8
9.67 ± 2.6
7.48
4.69
3.32
9.46
9.31
6.24
±
±
±
±
±
±
1.0
0.4
1.0
2.4
2.7
2.5
9.88
6.88
5.99
13.72
22.22
16.06
[32]
[33]
5.45
15.12
20.58
11.65
11.52
14.38
9.17
the lifetime and efficiency of the column and requires frequent
maintenance.
3.3. Method application
3.3.1. Henry coefficient determination
The Henry coefficient of ET, PT and DMS in demineralized water with our measurement method are similar to the Henry coefficients found in the literature (Table 4). However, the obtained
Henry coefficients for DMDS and DEDS in this work are, in the
same order of magnitude, but lower than previously reported
Henry coefficients for reasons not well understood. Henry coefficients in the saline matrix are lower than coefficients obtained in
demineralized water for each compound. This means that a larger
fraction of the compounds was present in the gas phase. The salting out effect that drives thiols to the gas phase due to the high
salinity and influences the henry coefficient. The effect of increasing ionic strength resulting in lower Henry coefficients was also
observed when comparing Henry coefficients obtained in demineralized water and sea water [44]. Another parameter that can influence the measured Henry coefficient is the acid base dissociation
constant. The pKa of MT, ET and PT at 25°C is 10.33, 10.39, 10.44
respectively (SI-4) [45]. With a pH of 8.4 in the liquid matrix, only
a small fraction <0.99% of the organosulfur is present as its conjugate base. Therefore, the pKa has a limited influence on the Henry
coefficient and was not further considered.
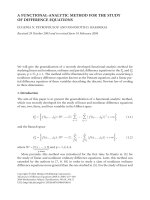
Figure 4. Detected VOSCs in the gas (A) and liquid (B) phase of a bio electrochemical lab reactor treating methanethiol.
4. Conclusion and outlook
A new method using GC-FPD was developed for routine analyses of VOSCs in complex liquid and gaseous samples. We demonstrated that apart from the more commonly measured compounds
H2S, DMS and DMDS also PT, ET and DEDS could be measured
accurately. VOSCs could be measured in a range from 5 μM-S to
125 μM-S for liquid and 0.08–1.85 μM-S for gaseous samples. Gas
standards can be used to calibrate the liquid phase with response
ratios between 105.2 and 108.9 % for the different VOSCs. Samples
with higher concentrations could be easily diluted to fall within
the calibration range. High reproducibility values with a relative
standard deviation below 3.5% were found for both gas and liquid standards. The results show that signal quenching due to coelution with carbon compounds in the gaseous phase was minimal under the tested concentrations. Henry coefficients were defined in both demineralized water and saline matrix and can be
used to obtain a rapid indication of the concentrations in the liquid phase while only analyzing the static gas phase above the liquid. The method is suitable for routine analyses of highly saline
samples with a high pH and can potentially be extended to other
complex matrices.
3.3.2. Samples of lab scale bioelectrochemical reactor treating MT
The results of the lab scale bioelectrochemical system treating
methanethiol are presented in Fig. 4. MT and DMDS were successfully measured with the developed method. No other organosulfur
compounds nor H2 S were observed in the chromatograms (See SI-8
for an example chromatogram). The concentration of methanethiol
decreased from 0.95 μM-S towards zero during the first 3 days of
the experiment, while DMDS increased from 0 to 1.33 μM-S during
the first two days. DMDS can be formed from methanethiol under microaerobic conditions in an autocatalytic or biocatalytic reaction. Not all MT was recovered in the form as DMDS which may
be the results of microbial degradation, volatilization from the system or the formation of other, unknown, sulfur compounds. DMDS
may also adsorb to the graphite felt electrode material, another
reason why not al MT was recovered as DMDS. The applied chromatographic method can be used to further study the degradation
kinetics and interaction of the organosulfur compounds with the
electrode fur further development of this new technology. Furthermore, the method may also be used for the measurement of VOSCs
in a full-scale bio-desulfurization plant that operates with a similar
matrix.
Declaration of Competing Interest
The authors declare that they have no known competing financial interests or personal relationships that could have appeared to
influence the work reported in this paper.
7
M. Elzinga, J. Zamudio, S. van Boven kaarsmaker et al.
Journal of Chromatography A 1677 (2022) 463276
Acknowledgments
[22] I.O.C. Egwim, H.J. Gruber, Spectrophotometric measurement of mercaptans
with 4,4 -Dithiodipyridine, Anal. Biochem. 288 (2001) 188–194, doi:10.1006/
abio.20 0 0.4891.
[23] D.M. Serafim, N.R. Stradiotto, Determination of sulfur compounds in gasoline
using mercury film electrode by square wave voltammetry, Fuel 87 (2008)
1007–1013, doi:10.1016/j.fuel.2007.07.012.
[24] R. Muñoz, E.C. Sivret, G. Parcsi, R. Lebrero, X. Wang, I.H. Suffet, R.M. Stuetz,
Monitoring techniques for odour abatement assessment, Water Res. 44 (2010)
5129–5149, doi:10.1016/j.watres.2010.06.013.
[25] J. Sun, S. Hu, K.R. Sharma, B. Keller-Lehmann, Z. Yuan, An efficient method for
measuring dissolved VOSCs in wastewater using GC-SCD with static headspace
technique, Water Res. 52 (2014) 208–217, doi:10.1016/j.watres.2013.10.063.
[26] S.K. Pandey, K.H. Kim, A review of methods for the determination of reduced
sulfur compounds (RSCS) in air, Environ. Sci. Technol. 43 (2009) 3020–3029,
doi:10.1021/es803272f.
[27] L. Ni, X. Geng, S. Li, H. Ning, Y. Gao, Y. Guan, A flame photometric detector
with a silicon photodiode assembly for sulfur detection, Talanta. 207 (2020)
120283, doi:10.1016/j.talanta.2019.120283.
[28] Y. Sheng, F. Chen, X. Wang, G. Sheng, J. Fu, Odorous volatile organic sulfides
in wastewater treatment plants in Guangzhou, China, Water Environ. Res. 80
(2008) 324–330, doi:10.2175/106143007x221274.
[29] X. Cheng, E. Peterkin, K. Narangajavana, Wastewater analysis for volatile organic sulfides using purge-and-trap with gas chromatography/mass spectrometry, Water Environ. Res. 79 (2007) 442–446, doi:10.2175/106143006x111871.
[30] X. Lu, C. Fan, J. Shang, J. Deng, H. Yin, Headspace solid-phase microextraction
for the determination of volatile sulfur compounds in odorous hyper-eutrophic
freshwater lakes using gas chromatography with flame photometric detection,
Microchem. J. 104 (2012) 26–32, doi:10.1016/j.microc.2012.04.001.
[31] F. Lestremau, F.A.T. Andersson, A.T. Nielsen, V. Desauziers, Investigation of
artefact formation during analysis of volatile sulphur compounds using solid
phase microextraction, Chromatographia 59 (2004) 607–613, doi:10.1365/
s10337- 004- 0261- 5.
[32] P. Davis, M. Qian, Effect of wine matrix composition on the quantification
of volatile sulfur compounds by headspace solid-phase microextraction-gas
chromatography-pulsed flame photometric detection, Molecules (2019) 24,
doi:10.3390/molecules24183320.
[33] Y. Chen, J. Li, X. Hou, X. Zhang, H. Yin, M. Zhang, C. Zheng, Trapping and
preconcentration of volatile organic sulfur compounds in water samples by
portable and battery-powered trapping device prior to gas chromatographysulfur chemiluminescence determination, J. Chromatogr. A. 1619 (2020)
460947, doi:10.1016/J.CHROMA.2020.460947.
[34] M.A. Iqbal, K.H. Kim, J.E. Szulejko, M.M. Rahman, The selection of the standard phase (gas vs. liquid) and the related matrix effect on the direct injection
gas chromatographic analysis of VOCs at sub-ppm levels, Atmos. Pollut. Res. 5
(2014) 563–571, doi:10.5094/APR.2014.065.
[35] M.J. Playne, Determination of ethanol, volatile fatty acids, lactic and succinic
acids in fermentation liquids by gas chromatography, J. Sci. Food Agric. 36
(1985) 638–644, doi:10.1002/jsfa.2740360803.
[36] J. Hannes, A. Schaechtele, T. Robouch, R. Piotr, T. Wenzl, J. Haedrich, J. Stroka,
Guidance document on the estimation of LOD and LOQ for measurements in
the field of contaminants in feed and food, EUR 28099 EN, 2016. 10.2787/8931.
[37] J. Vial, A. Jardy, Experimental comparison of the different approaches to estimate LOD and LOQ of an HPLC method, Anal. Chem. 71 (1999) 2672–2677,
doi:10.1021/ac981179n.
[38] J.G.M. Cramers, C.A. Smit, H.P. Tuan, H.G. Janssen, C.A. Cramers, A.L.C. Smit,
E.M. Van Loo, Determination of sulfur components in natural gas: a review, J.
High Resolut. Chromatogr. 17 (1994) 373–389, doi:10.1002/jhrc.1240170603.
[39] H.P. Tuan, H.G.M. Janssen, C.A. Cramers, E.M. Kuiper-van Loo, H. Vlap, Evaluation of the performance of various universal and selective detectors for sulfur
determination in natural gas, J. High Resolut. Chromatogr. 18 (1995) 333–342,
doi:10.1002/jhrc.1240180603.
[40] X. Ma, S. Velu, J.H. Kim, C. Song, Deep desulfurization of gasoline by selective
adsorption over solid adsorbents and impact of analytical methods on ppmlevel sulfur quantification for fuel cell applications, Appl. Catal. B Environ. 56
(2005) 137–147, doi:10.1016/j.apcatb.2004.08.013.
[41] K.H. McKelvie, K.B. Thurbide, A rapid analytical method for the selective
quenching-free determination of thiols by GC-FPD, Chromatographia 81 (2018)
1559–1567, doi:10.1007/s10337- 018- 3619- 9.
[42] T.C. Hayward, K.B. Thurbide, Quenching-resistant multiple micro-flame photometric detector for gas chromatography, Anal. Chem. 81 (2009) 8858–8867,
doi:10.1021/AC901421S/ASSET/IMAGES/LARGE/AC- 2009- 01421S_0001.JPEG.
[43] J. WileyThe Chemistry of the Thiol Group Part 2, John Wiley & Sons, 1974.
[44] A. Przyjazny, W. Janicki, W. Chrzanowski, R. Staszewski, Headspace gas chromatographic determination of distribution coefficients of selected organosulphur compounds and their dependence on some parameters, J. Chromatogr. A
(00) (1983) 91567-X, doi:10.1016/S0021-9673.
[45] International Union of Pure and Applied Chemistry. Commission on Equilibrium DataInternational Union of Pure and Applied Chemistry. Commission on
Electrochemical Data., Ionisation Constants of Organic Acids in Aqueous Solution, E.P. Serjeant, B. Dempsey (Eds.), Pergamon Press, Oxford, New York, 1979.
The authors would like to thank Jill Soedarso for her valuable
contributions in the laboratory and Livio Carlucci, Hans Beijleveld
and Vinnie de Wilde for sharing their expertise on gas chromatographic systems. This research was funded by Paqell and was performed at Wageningen University and Research.
Supplementary materials
Supplementary material associated with this article can be
found, in the online version, at doi:10.1016/j.chroma.2022.463276.
References
[1] M.R. Ras, F. Borrull, R.M. Marcé, Determination of volatile organic sulfur compounds in the air at sewage management areas by thermal desorption and gas
chromatography-mass spectrometry, Talanta 74 (2008) 562–569, doi:10.1016/j.
talanta.2007.06.017.
[2] T. Jia, S. Sun, K. Chen, L. Zhang, Y. Peng, Simultaneous methanethiol and
dimethyl sulfide removal in a single-stage biotrickling filter packed with
polyurethane foam: performance, parameters and microbial community analysis, Chemosphere 244 (2020) 125460, doi:10.1016/j.chemosphere.2019.125460.
[3] S. Varjani, R. Joshi, V.K. Srivastava, H.H. Ngo, W. Guo, Treatment of wastewater from petroleum industry: current practices and perspectives, Environ. Sci.
Pollut. Res. 27 (2020) 27172–27180, doi:10.1007/s11356- 019- 04725- x.
[4] A. Calbry-Muzyka, H. Madi, F. Rüsch-Pfund, M. Gandiglio, S. Biollaz, Biogas
composition from agricultural sources and organic fraction of municipal solid
waste, Renew. Energy 181 (2022) 10 0 0–10 07, doi:10.1016/j.renene.2021.09.10 0.
[5] H. Zhang, F. Schuchardt, G. Li, J. Yang, Q. Yang, Emission of volatile sulfur compounds during composting of municipal solid waste (MSW), Waste Manag. 33
(2013) 957–963, doi:10.1016/j.wasman.2012.11.008.
[6] C.L. Lee, P. Brimblecombe, Anthropogenic contributions to global carbonyl sulfide, carbon disulfide and organosulfides fluxes, Earth Sci. Rev. 160 (2016) 1–
18, doi:10.1016/j.earscirev.2016.06.005.
[7] E. Smet, P. Lens, H. Van Langenhove, Treatment of waste gases contaminated
with odorous sulfur compounds, Crit. Rev. Environ. Sci. Technol. 28 (1998) 89–
117, doi:10.1080/10643389891254179.
[8] D.P. Kelly, N.A. Smith, Organic sulfur compounds in the environment biogeochemistry, microbiology, and ecological aspects, Adv. Microb. Ecol. (1990)
245–387.
[9] A. De Angelis, Natural gas removal of hydrogen sulphide and mercaptans, Appl.
Catal. B Environ. (2012) 37–42 113–114, doi:10.1016/j.apcatb.2011.11.026.
[10] A.K. Sharipov, Reviews mercaptans from gas condensates and crude oils,
Chemistry and Technology of Fuels and Oils 38 (4) (2002) 280–285.
[11] Q. Shi, J. Wu, Review on sulfur compounds in petroleum and its products:
state-of-the-art and perspectives, Energy Fuels 35 (2021) 14445–14461, doi:10.
1021/acs.energyfuels.1c02229.
[12] R. Bentley, T.G. Chasteen, Environmental VOSCs - Formation and degradation of
dimethyl sulfide, methanethiol and related materials, Chemosphere. 55 (2004)
291–317, doi:10.1016/j.chemosphere.2003.12.017.
[13] B.P. Lomans, C. Van der Drift, A. Pol, H.J.M. Op den Camp, Microbial cycling
of volatile organic sulfur compounds, Cell. Mol. Life Sci. 59 (2002) 575–588,
doi:10.10 07/s0 0 018-0 02-8450-6.
[14] B. Wu, F. Liu, W. Fang, T. Yang, G.H. Chen, Z. He, S. Wang, Microbial sulfur
metabolism and environmental implications, Sci. Total Environ. 778 (2021),
doi:10.1016/j.scitotenv.2021.146085.
[15] A. Exposure, G. Levels, C. Toxicology, E. Studies, D. Earth, L. Studies, Acute Exposure Guideline Levels for Selected Airborne Chemicals, National Academies,
Press, 2013, doi:10.17226/18449.
[16] W. Wardencki, Problems with the determination of environmental sulphur
compounds by gas chromatography, J. Chromatogr. A. 793 (97) (1998) 1–19
00997-7, doi:10.1016/S0021-9673.
[17] E. Pino-Cortés, S. Montalvo, C. Huiliñir, F. Cubillos, J. Gacitúa, Characteristics
and treatment of wastewater from the mercaptan oxidation process: a comprehensive review, Processes. 8 (2020), doi:10.3390/PR8040425.
[18] M. Elzinga, D. Liu, J.B.M. Klok, P. Roman, C.J.N. Buisman, A. ter Heijne, Microbial
reduction of organosulfur compounds at cathodes in bioelectrochemical systems, Environ. Sci. Ecotechnol. 1 (2020) 10 0 0 09, doi:10.1016/j.ese.2020.10 0 0 09.
[19] K. Kiragosyan, M. Picard, P.H.A. Timmers, D.Y. Sorokin, J.B.M. Klok, P. Roman,
A.J.H. Janssen, Effect of methanethiol on process performance, selectivity and
diversity of sulfur-oxidizing bacteria in a dual bioreactor gas biodesulfurization system, J. Hazard. Mater. 398 (2020) 123002, doi:10.1016/J.JHAZMAT.2020.
123002.
[20] C.M. De Graaff, Biological Treatment of Sulfidic Spent Caustics Under Haloakaline Conditions Using Soda Lake Bacteria, Wageningen University, 2012.
[21] S.K. Park, R.B. Boulton, A.C. Noble, Automated HPLC analysis of glutathione
and thiol-containing compounds in grape juice and wine using pre-column
derivatization with fluorescence detection, Food Chem. 68 (99) (20 0 0) 475–
480 00227-7, doi:10.1016/S0308-8146.
8