Development of a multianalytical strategy for detection of frauds in Coleus forskohlii supplements
Bạn đang xem bản rút gọn của tài liệu. Xem và tải ngay bản đầy đủ của tài liệu tại đây (1.1 MB, 10 trang )
Journal of Chromatography A 1676 (2022) 463198
Contents lists available at ScienceDirect
Journal of Chromatography A
journal homepage: www.elsevier.com/locate/chroma
Development of a multianalytical strategy for detection of frauds in
Coleus forskohlii supplements
Ignacio Jiménez Amezcua a,b, Sergio Rivas Blas a, Marina Díez Municio b, Ana Cristina Soria a,
Ana Isabel Ruiz Matute a, María Luz Sanz a,∗
a
b
Instituto de Química Orgánica General (IQOG-CSIC), Juan de la Cierva 3, Madrid 28006, Spain
Pharmactive Biotech Products S.L., C/ Faraday, 7, Madrid 28049, Spain
a r t i c l e
i n f o
Article history:
Received 30 March 2022
Revised 1 June 2022
Accepted 2 June 2022
Available online 9 June 2022
Keywords:
Coleus forskohlii
Food supplements
GC-MS
LC-MS
Fraud detection
a b s t r a c t
A new multianalytical methodology based on gas chromatography (GC) and liquid chromatography (LC)
coupled to mass spectrometry (MS) has been proposed to evaluate frauds affecting the composition of
Coleus forskohlii root supplements (FKS). After optimization and validation of chromatographic methods,
24 FKS were analyzed. Forskolin, their main bioactive component, was only found in 50% of the FKS evaluated (in the 0.032–17.1% range), with 27% of these supplements showing concentrations of this bioactive
lower than those declared in their labels. Application of this methodology also proved to be successful
for the detection of frauds regarding the replacement of C. forskohlii by other vegetable sources (green
tea, soy leaves and a plant of the Berberidaceae family) in 17% of supplements analyzed. A study on stability of forskolin under accelerated conditions allowed to rule out its degradation as responsible for the
lack of this bioactive or other natural constituents in 25% of FKS evaluated. It can be concluded that the
multianalytical methodology here developed is an advantageous alternative to address the wide diversity
of frauds affecting these supplements.
© 2022 The Author(s). Published by Elsevier B.V.
This is an open access article under the CC BY-NC-ND license
( />
1. Introduction
The consumption of food supplements, especially those containing plant ingredients, has increased in recent years, mainly due
to their accessibility via online market and the fact that society
perceives them as natural products to overcome nutritional deficiencies, maintain an adequate intake of nutrients, or to support
specific physiological functions [1]. However, food supplements are
not subjected to a strict legal framework like prescription drugs
are and could be target of frauds. In this sense, the replacement
of the natural source by other(s) of less economic value, the undeclared addition of pharmacological products, the discrepancy of
the presence and/or quantity of the declared bioactives or the noncontrolled addition of synthetic bioactive components have been
detected in some supplements [2–4].
Coleous forskohlii (also known as Coleus barbatus or Plectranthus barbatus) is a perennial plant from the Lamiaceae family, native from India and distributed all over different countries (Egypt,
Arabia, Ethiopia, Brazil, etc.) [5]. In Indian traditional medicine
∗
Corresponding author.
E-mail address: (M.L. Sanz).
(Ayurveda), it is applied for treating several disorders due to its antioxidant, antiaging, analgesic, antiinflamatory, bronchodilator, gastroprotective and anthelmintic properties [6–8] and its root extracts are currently commercialized as food supplements.
Roots of C. forskohlii are rich in bioactive metabolites such
as flavonoids and mainly diterpenoids. Forskolin, a labdane-type
diterpenoid, is the main bioactive component of roots (approximately 0.15–1.5 % w/w) and it has exhibited positive effects on
asthma, hypertension, heart disease, diabetes and obesity, among
others [9]. The major mechanism of action of forskolin is based on
the adenylyl-cyclase (AC) enzyme activation. This diterpenoid activates various isoforms of AC, resulting in the increase in intracellular cyclic adenosine 3 ,5 -monophosphate (cAMP), which is a
transmitter of intracellular signals that modulates and affects the
activity of many cell enzymes. In some diseases, such as obesity,
in which the cAMP levels are reduced, forskolin could play an important role, by increasing these levels and triggering the adipocite
lipolysis and the loss of fat in cells [10,11]
Several techniques have been proposed for extraction (e.g.,
hydrotropic extraction, microwave-assisted extraction, three-phase
partitioning) and isolation (e.g., silica gel column chromatography, charcoal column chromatography, immunoaffinity) of forskolin
/>0021-9673/© 2022 The Author(s). Published by Elsevier B.V. This is an open access article under the CC BY-NC-ND license
( />
I. Jiménez Amezcua, S. Rivas Blas, M. Díez Municio et al.
Journal of Chromatography A 1676 (2022) 463198
from C. forskohlii roots to be used in food supplements. Different
purities and recoveries were reported depending on the selected
technique [12]. At present, the maximum safe dose of forskolin
is not clearly established, and C. forskohlii supplements (FKS) are
marketed with standardized levels of this bioactive within a wide
range (from 1 to 20% forskolin) or even with no mention of its
content.
The composition of C. forskohlii root extracts has been widely
studied either by gas chromatography coupled to mass spectrometry (GC-MS) [6,8,13] or by high performance liquid chromatography
coupled to MS (LC-MS) [14]. However, studies regarding the characterization of FKS aimed to evaluate their quality/authenticity are
very limited and only focused on the evaluation of potential discrepancies between the declared and experimentally-determined
content of forskolin [15,16]. The characterization of other constituents of FKS, which could be used as quality markers, or the
detection of additional fraudulent practices have not been previously addressed in these samples. To that aim, in this manuscript,
a new multi-analytical strategy based on GC-MS and LC-MS analyses of C. forskohlii root supplements has been evaluated for the
first time.
weeks. Samples were taken at 0, 1, 2, 3, 4, 8 and 12 weeks of storage and then analyzed by GC-MS as indicated below. Experiments
were carried out in duplicate.
2.4. Derivatization of methanolic extracts
Trimethylsilyl oximation was selected as derivatization procedure prior to GC-MS analysis of methanolic extracts. For this purpose, 0.1 mL of phenyl-β -D-glucoside (1 mg mL−1 ) used as I.S.
were added to an eppendorf with 0.15 mL of root / FKS extracts.
Samples were dried in a rotatory evaporator at 40 °C and further
subjected to derivatization.
The two-step derivatization (oximation+silylation) procedure
was carried out as previously described by Ruiz-Aceituno et al.
[17]. For oxime formation, dried samples were treated with 350 μL
of 2.5% hydroxylamine chloride in pyridine at 75 °C for 30 min.
Silylation was then carried out using 350 μL of HMDS and 35 μL
of TFA by heating at 45 °C for 30 min. All derivatized samples were
centrifuged at 4401 g for 10 min and the supernatants further injected into the GC–MS system.
2.5. GC-MS analysis
2. Materials and methods
Derivatized and non-derivatized samples (from methanol and
heptane extracts, respectively) were analyzed in a 6890 N gas
chromatograph coupled to a 5973 single quadrupole (Q) mass
spectrometer, both from Agilent Technologies (Palo Alto, CA, USA).
Chromatographic analyses were carried out on a Zebron ZB-1 capillary column (30 m × 0.25 mm i.d.; 0.25 μm film thickness; Phenomenex, CA, USA), using helium at ∼ 1 mL min−1 as carrier gas.
Different operating conditions (oven programs and injection
temperatures) were assayed. Several initial/ending oven temperatures and ramps were evaluated to provide the best separation of
target compounds for both derivatized (methanolic extracts) and
non-derivatized (heptane extracts) samples. Injections (1 μL) were
carried out in split mode (1:15) at a temperature of 300 °C. The MS
detector was operated in electron impact (EI) mode at 70 eV, scanning the 50–650 m/z range. The transfer line was set at 280 °C and
the ionization source at 230 °C. For data acquisition and analysis,
MSD ChemStation software (Agilent Technologies) was used.
Identifications were carried out by comparison of experimental
spectra with data from mass spectral libraries (Wiley, NIST), and
were further confirmed by using linear retention indices (IT ), calculated from retention data of suitable n-alkanes (from C10 to C40 )
analyzed under identical chromatographic conditions.
The internal standard method was used for quantitation. Standard solutions over the expected concentration range in the samples under study were used to calculate the response factor (RF)
relative to the internal standard (phenyl-β -D-glucoside for derivatized compounds; octadecane and docosane for underivatized compounds). All analyses were carried out in triplicate.
2.1. Reagents and samples
Analytical standards of fructose, galactose, glucose, sucrose,
chiro-inositol, maltose, myo-inositol, pinitol, sedoheptulose, 1,9dideoxyforskolin (1,9-DDF), forskolin and phenyl-β -D-glucoside
(internal standard, I.S.) were obtained from Sigma Aldrich (St.
Louis, MO, US). Derivatization reagents including hydroxylamine
chloride, anhydrous pyridine, hexamethyldisilazane (HMDS) and
trifluoroacetic acid (TFA) were also acquired from Sigma Aldrich.
FKS from different brands (FKS1-FKS24) were purchased online
in different websites (Amazon, Aliexpress and iHerb). Table S1 of
Supplementary Material shows the different formulations (tablets
and capsules) and composition of FKS under study, as declared in
the labelling. All supplements were analyzed prior to their expiration date.
C. forskohlii roots were acquired from Plantaromed (Spain).
Samples were ground to fine particles in an IKA A10 basic mill
(IKA-Werke, Germany), sieved through a 500 μm mesh and stored
in closed containers at room temperature and protected from light
until extraction. Soy leaves, green tea and a berberine supplement
were acquired in local shops (Madrid, Spain).
2.2. Extraction procedure
To evaluate the authenticity of FKS, reference extracts from C.
forskohlii roots were obtained and analyzed. Methanol was selected
as a polar solvent to re-dissolve FKS or to extract polar bioactives,
whereas heptane was used as solvent for non-polar compounds.
Ultrasound assisted extraction of C. forskohlii roots (100 mg) and
FKS (60 mg) with these solvents (1 mL) was carried out using
an ultrasonic bath (Elma Schmidbauer GmbH, Singen, Germany) at
25 °C for 5 min. In both cases, extracts were immediately centrifuged at 4401 g for 10 min and diluted (1:2–1:160, v/v) as required. Unless otherwise specified, all experiments were performed
in triplicate.
2.6. LC-MS analysis
Analysis of forskolin and its derivatives in C. forskohlii food supplements was performed on two LC-MS instruments.
The first one, used for the qualitative and quantitative analysis of all FKS, was a 1260 Infinity II Prime LC System, including an autosampler, a quaternary pump, a thermostatized column
compartment and a diode array detector, coupled to a 6125 single quadrupole mass detector (Agilent Technologies, Santa Clara,
CA, US) provided with an electrospray ionization (ESI) source. Optimization of electrospray source parameters was performed by infusion of a forskolin standard solution under both positive and negative polarities. Different values for fragmentor voltage (50–150 V)
and nebulizing gas (N2 , 99.5% purity) pressure (207–345 KPa) were
2.3. Stability of forskolin
Aliquots (0.2 mL) of the methanolic extracts of C. forskohlii root
and FKS1 were evaporated to dryness in a miVac Duo Concentrator from GeneVac Ltd. (Ipswich, UK) and stored at 50 °C for 12
2
I. Jiménez Amezcua, S. Rivas Blas, M. Díez Municio et al.
Journal of Chromatography A 1676 (2022) 463198
to internal standards of sodium [2, 2, 3, 3-2 H4 ]-3-(trimethylsilyl)propanoate in D2 O (δ H 0.00) and 1,4-dioxane (δ C 67.40) in D2 O,
respectively. One-dimensional (1D) NMR experiments (1 H and
13 C{1 H}) were performed using standard pulse sequences.
also considered. Nitrogen drying gas flow rate and temperature
were set at 12 L min−1 and 300 °C, while capillary voltage was
set at 30 0 0 V. Analyses were carried out in SCAN mode (50–
20 0 0 m/z range). Data acquisition and processing were performed
using OpenLAB CDS Software (v.2.19.20, Agilent Technologies).
The second equipment was used to identify unknown structures
of FKS1, FKS12, FKS18 and FKS19. It was an Agilent 1100 Series
LC system (equipped with a binary pump, an autosampler, and
a column oven) coupled to a Maxis II quadrupole-time of flight
(QToF) mass spectrometer (LC-QToF MS, Bruker, Massachusetts, US)
provided with an ESI interface working in positive-ion mode. The
electrospray voltage was set at 3.5 kV and the drying gas temperature at 200 °C. Nitrogen (99.5% purity) was used as nebulizer
(2.0 bar) and drying gas (6 L min−1 ), while nitrogen of higher purity (99.999%) was used as the collision gas. Optimization of ion
transmission into the analyzer was performed by infusing the default test mixture. Full scan mass spectra were recorded in the
50–30 0 0 m/z range with external calibration. MS/MS experiments
were performed using broad banding collision, with 30 eV as collision energy. Data acquisition and processing were performed using
Data Analysis v.4.4.200 software (Bruker).
Chromatographic separation was carried out by using a Luna
C18 column (100 mm × 2.1 mm, 3 μm; Phenomenex, Cheshire, UK)
operating at 0.22 mL min−1 and thermostatized at 30 °C. Different binary gradients consisting of water (eluent A) and acetonitrile
(eluent B), both with 0.1% formic acid, were assayed for the optimization of LC-MS method. Injection volume was set as 5 μL.
Compound identification in FKS was based on chromatographic
retention and MS data and it was confirmed, when possible, by
co-injection of the corresponding commercial standards. For further confirmation of these identifications and for characterization
of unknowns, MS/MS data were used. Comparison of experimental
MS/MS patterns and data provided by Metlin database (Metabolite
and Chemical Entity Database, The Scripps Research Institute, San
Diego, CA) was also carried out. When analytical standards were
not available, identifications were considered as tentative.
Quantitative analysis of forskolin and its derivatives in FKS
by LC-MS was performed in triplicate using an external standard
calibration curve of forskolin. Prior to quantitation, matrix effect
was evaluated by quantifying forskolin in FKS1 extract diluted in
methanol at different ratios (1:1–1:500, v/v).
2.9. Statistical analysis
Statistica 7.0 program (StatSoft, Inc. Tulsa, OK, USA) was used
for statistical analysis of data. The compliance between experimental and declared values of forskolin and concentrations determined
by GC-MS and LC-MS were assessed by t-test for independent samples (p < 0.01). Significance (p < 0.05) of differences for results
obtained in other studies (e.g., forskolin stability, matrix effect, etc)
was determined by the analysis of variance (ANOVA, Tukey test).
3. Results and discussion
Three analytical methods (by GC-MS for non-polar and polar
extracts, and by LC-MS for polar extracts) were developed in this
work with a double objective: (i) to select the most appropriate method to determine the forskolin content and (ii) to obtain
a multi-component authenticity profile of these supplements to
identify potential frauds affecting C. forskohlii supplements.
3.1. Optimization of analytical methods
3.1.1. Sample preparation
Sample preparation was evaluated prior to the optimization of
chromatographic methods. Solvents of different polarities were assayed for the extraction/redisolution, not only of forskolin, but also
of other C. forskohlii root and FKS components. Heptane was used
as a non-polar solvent and as a more environmentally safer alternative to benzene which had been applied in previous studies for forskolin extraction [18]. Regarding polar solvents, water
is the most universal and greenest solvent; however, solubility of
forskolin in this solvent is low [12]. Both methanol and ethanol
were shown to be appropriate solvents to extract this bioactive
(0.69 and 0.60 mg g−1 , respectively) together with other constituents from C. forskohlii roots. However, as methanol provided
an improved performance, it was selected for further studies. These
results were in good agreement with those published by Singh and
Suryanarayana [7], who reported methanol as the optimal solvent
for extraction of forskolin.
Special attention was paid to the derivatization process required
for the GC-MS analysis of non-volatile and thermolabile polar compounds such as carbohydrates present in methanolic extracts. In
this sense, and although forskolin and other terpenoids do not
form oximes and give rise to a single TMS derivative, trimethylsilyl oximation was considered as it provides only two peaks per
reducing sugar (corresponding to the syn (E) and anti (Z) forms)
and, therefore, a better resolution among the different compounds
is achieved.
2.7. Validation of analytical methods
Different parameters were considered for validation of the optimized GC-MS and LC-MS methods. Reproducibility was measured
in terms of intra- and inter-day precision by derivatizing (when required) and analysing diluted FKS1 sample (1:40, v/v) under optimal conditions within the same day (n = 5) or in 5 consecutive days, respectively. Linearity of the responses was evaluated
in the 0.0 0 05–1 mg mL−1 range. Goodness of fitting of calibration
curves was evaluated using their correlation coefficients. Recovery
was calculated in triplicate after spiking this sample with a known
amount of forskolin standard. Limits of detection (LOD) and quantitation (LOQ) were calculated for forskolin as three and ten times
the signal to noise ratio (S/N), respectively.
3.1.2. Operating conditions
GC-MS conditions were optimized with the aim of achieving
the best resolution of FKS components. For the analysis of heptane
extracts, the best separation among the different compounds was
obtained when the oven temperature was programmed from 50 to
270 °C at 6 °C min−1 , then to 310 °C at 10 °C min−1 for 15 min.
Regarding GC-MS analyses of methanolic extracts, initial temperature was set at 150 °C, and different ramps to increase the
temperature up to 310 °C were assayed. Low resolution values
were obtained between 1,9-DDF and phenyl-β -D-glucoside, used
as internal standard (Rs = 0.84), and between forskolin and an unknown compound with m/z ion 545 (Rs = 0.07) using 6 °C min−1
2.8. Nuclear magnetic resonance analysis
Nuclear Magnetic Resonance (NMR) analysis of food supplements (FKS4, FKS5, FKS13-16), was accomplished using an Agilent SYSTEM 500 NMR spectrometer (1 H 500 MHz, 13 C 125 MHz),
equipped with a 5-mm HCN cold probe. NMR spectra were
recorded at 25 °C, using D2 O as solvent. Chemical shifts of 1 H
(δ H ) and 13 C (δ C ) in parts per million were determined relative
3
I. Jiménez Amezcua, S. Rivas Blas, M. Díez Municio et al.
Journal of Chromatography A 1676 (2022) 463198
Table 1
Validation of GC-MS and LC-MS methods for the analysis of forskolin in methanolic extracts.
Calibration curve
Linear range (mg mL−1 )
Intra-day precision (RSD %)
Inter-day precision (RSD %)
Recovery (%)
LOD/LOQ (ng mL−1 )
a
GC-MS
LC-MS
y = 0.3157x – 0.1470
R2 = 0.993
0.05–1.00
3.06
3.50
101 (6)a
186.03 (21.77) / 620.11
(72.58)
y = 2 109 x + 1 106
R² = 0.994
0.0005–0.01
1.17
1.81
96 (6)
23.86 (1.67) / 79.54 (5.57)
Standard deviation in parenthesis.
to 270 °C and then 10 °C min−1 to 310 °C (Fig. S1 of Supplementary material). On the contrary, good resolution values (Rs = 1.59
and Rs = 1.31, respectively) were achieved with 8 °C min−1 to
225 °C followed by 10 °C min−1 up to 310 °C. This temperature
was held for 10 min.
As regards LC-Q MS analyses, different binary gradients of water (eluent A): acetonitrile (eluent B), both with 0.1% formic acid,
were assayed. The best conditions for the separation of forskolin
and its derivatives were as follows: from 20% to 70% B in 25 min,
then to 85% B in 3 min and finally to 90% B in 2 min. This percentage was kept for 5 min and initial conditions were resumed in
1 min. Regarding MS, forskolin could be detected in both positive
and negative polarity modes as previously observed by Cuthbertson et al. [19]. However, peak areas were fifteen times higher in
positive mode, which was selected for further experiments. High
intensity quasimolecular ions were found at 433 and 375 m/z, corresponding to [M+Na]+ and [M+H-2H2 O]+ , respectively. Different fragmentor voltages and nebulizing gas pressure values were
tested. While no significant differences were observed in forskolin
response between 276 and 345 KPa, lower values were obtained
at 204 KPa. Regarding fragmentor voltages, the highest response
was found at 100 V followed by 150 V. Considering these results,
100 V and 276 KPa were selected as optimal conditions. Although
forskolin was detected by the three methods, considering its low
solubility in non-polar solvents [7], heptane extracts were not considered for the quantitative analysis of this bioactive. As regards
the analysis of methanolic extracts, a linear response was obtained
for forskolin by both GC-MS and LC-Q MS methods (Table 1). Good
values for intra-day (3.06 and 1.17%) and inter-day (3.50 and 1.81%)
precision and recovery (101% and 96%) were found for these methods, respectively. Moreover, no significant differences at the 99%
confidence level were found in the forskolin content of FKS determined by both methods (e.g., 17.2 (SD 0.5) by GC-MS and 16.5
(SD 0.4) mg g−1 by LC-MS for FKS1). However, considering the
higher sensitivity of LC-Q MS (LOD: 23.86 ng mL−1 , LOQ: 79.54 ng
mL−1 ) vs. GC-MS (LOD: 186.03 ng mL−1 , LOQ: 620.11 ng mL−1 ),
this technique was selected for the quantitative determination of
forskolin and its derivatives. These values were lower than those
found in previously developed methods to determine FKS quality
(HPLC-ELSD 0.95 μg mL−1 [16] and RPLC-PDA 1.5 μg mL−1 [15]).
Non-significant differences in forskolin content were found at the
different concentration levels evaluated and, therefore, matrix effect was discarded.
not detected in the remaining 42% of the supplements under study
(Groups 3 and 4).
The percentages of forskolin in FKS determined by LC-Q MS
are shown in Table 2. Values ranged from 0.032% in FKS9 to
17.1% in FKS24. Similar percentages (ranging 1–20%) were found
by Schaneberg and Khan [15] in the analysis by LC with a photodiode array detector of some commercial products. Although most
of the forskolin concentrations experimentally determined were in
good agreement with these contents, the t-test statistical analysis revealed that concentrations of 27% FKS under study were significantly lower than those stated in labelling. It is worth noting
the case of FKS1, which showed a forskolin percentage four times
lower than the content declared. Forskolin concentration was not
specified in supplement FSK9, but the extremely low value experimentally determined for this bioactive questions its effectiveness
for reported health benefits.
3.3. Study of authentication profiles
Once the quality of FKS attending to their forskolin concentration was evaluated, a comprehensive characterization of FKS1FKS24 supplements was done based on the information provided by the three chromatographic methods previously optimized
(Section 3.1.) to determine the authenticity of their natural source.
In this sense, the different chromatographic profiles of FKS were
compared with those of a laboratory-made reference C. forskohlii
root extract.
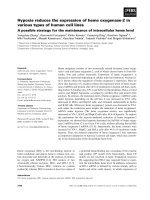
3.3.1. Non-polar extracts
Similar GC-MS profiles of heptane extracts were observed for
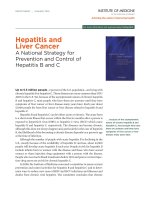
supplements containing forskolin (Group 1, Fig. S2). Fig. 1 shows
the GC-MS profile of the FKS1 heptane extract as an example.
Apart from forskolin, its derivative 1,9-DDF was identified from GCMS data (IT and mass spectrum) of the corresponding commercial standard. Other diterpenoids such as 9-deoxyforskolin (9-DE),
6-acetyl-7-deacetylforskolin (isoforskolin), trans-ferruginol, abieta8,11,13-triene and sugiol were tentatively identified in most of
these supplements by comparison of their IT and mass spectra
with those found in the NIST database. These compounds were also
found in the reference root extract (see GC-MS profile of Fig. S3A)
and their presence had been previously described in C. forskohlii
roots by other authors [20,21]. Borneol and bornyl acetate, present
in the root extract, were also found in some samples. The presence of all these compounds could confirm the genuineness of
these supplements. Other terpenoids present in roots, previously
described in the literature [21], were not detected, probably due
to processing conditions of this matrix employed for the manufacture of food supplements. Sterols, decyl acetate and ethyl 4ethoxybenzoate were also detected; however, their presence was
not detected in the root reference extract.
On the contrary, supplements FKS7 and FKS9 only showed the
presence of abieta-8,11,13-triene (peak 5), trans-ferruginol (peak 6),
1,9-DDF (peak 7) and sterols (peak10). Alkanes from triacosane to
3.2. Forskolin content of FKS
Firstly, the quality of FKS was evaluated in terms of forskolin
content, by agreement or mismatch with the declared values. All
supplements were analyzed by the optimized LC-Q MS method,
which resulted in the detection of forskolin at levels greater than
the LOQ in only 50% of them (Group 1, Fig. S2 of Supplementary
Material). Traces of this compound were also detected in FKS2 and
FKS7 samples (Group 2), while the presence of this bioactive was
4
I. Jiménez Amezcua, S. Rivas Blas, M. Díez Municio et al.
Journal of Chromatography A 1676 (2022) 463198
Table 2
Contents (mg g−1 ) of forskolin in FSK determined by LC-MS and values declared in their corresponding labels. Standard deviation in parenthesis (n = 3).
∗
∗∗
Supplement
Experimental
Declared
FKS1
FKS2
FKS3
FKS6
FK7
FKS8
FKS9
FKS10
FKS11
FKS20
FKS21
FKS22
FKS23
FKS24
16.5 (0.4)∗
tr∗∗
44.2 (2.4)
71.8 (0.05)∗
tr
102.8 (2.4)
0.32 (0.004)
20.1 (1.1)
19.9 (2.2)∗
110 (1)
62.8 (0.1)
132.5 (3.5)
69.4 (1.3)
171 (5)
76
26
41
87
85
22
32
98
57
113
67
200
Significant differences (p < 0.01) between the experimental and declared contents of forskolin.
tr: traces (< LOQ).
-: non declared.
∗∗∗
Fig. 1. GC-MS profile of FKS1 heptane extract. 1. borneol, 2. bornyl acetate, 3. decyl acetate, 4. ethyl p-ethoxybenzoate, 5. abieta-8,11,13-triene, 6. trans-ferruginol, 7. 1,9-DDF,
8. 1,9-DDF related compound, 9. 9-DE, 10. sterols, 11. sugiol, 12. sterols, 13. forskolin, 14. isoforskolin; is1 and is2: internal standards.
heptatriacontane were detected in FKS4, while characteristic compounds of C. forskohlii were not found. No peaks were detected in
the heptane extracts of the rest of the food supplements analyzed
(FKS2 and groups 3 and 4), with the exception of caffeine in FKS17
and FKS18.
found in these supplements. Some of these peaks were also detected in the methanolic reference root extract at very low levels (Fig. S3B). Other compounds, such as sucrose and piperine
(0.12 mg g−1 ) were detected in FKS10, probably coming from black
pepper, whose addition is declared on its label. N-acetyl-tyrosine
(tR 10.41 min; 70.0 mg g−1 ), declared as ingredient in FSK10, was
also found in FKS21. Moreover, maltose and maltotriose were also
found in FKS1 and FKS6, probably arising from the declared addition of maltodextrins and cornstarch, respectively, as ingredients in
supplement formulation.
Different monosaccharides including hexoses, such as fructose,
glucose, galactose and mannose, and heptoses, such as sedoheptulose, were detected in supplements FKS1, FKS9 and those of group
2. These carbohydrates were also found in the root reference extract (see Fig. S3B), confirming their genuine origin. As shown
in Table 3, high contents of sedoheptulose (14.1–50.6 mg g−1 ),
as compared to the total concentration of monosaccharides (1.9–
5.8 mg g−1 ), were present in these supplements. High levels of
this carbohydrate, which is known to play an important role in
the cyclic regeneration of D-ribulose for carbon dioxide fixation in
plant photosynthesis [22], have been previously described in leaves
of different varieties of Coleus [23] and also in roots of different
3.3.2. Polar extracts
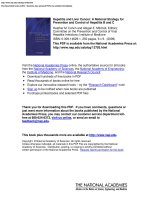
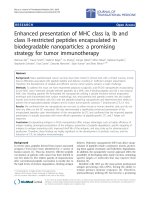
GC-MS profiles. In general, the GC-MS profiles of methanolic extracts of FKS containing forskolin (Group 1 and 2, Fig. S2) were
characterized by two types of compounds: carbohydrates and/or
diterpenoids (e.g., FSK1 in Fig. 2A), also found in C. forskohlii root
extract (Fig. S3B). Supplements of group 1, except for FKS1 and
FKS9, only contained diterpenoids, while in samples of group 2
only the characteristic carbohydrates were detected.
In group 1, FKS carbohydrates would have been probably eliminated during their manufacture as a consequence of the purification followed for their enrichment in diterpenoids. In addition
to forskolin and 1,9-DDF, other characteristic compounds of C.
forskohlii such as forskolin D, 9-DE and isoforskolin were also tentatively identified in these FKS (mass spectra can be found in Fig.
S4). Moreover, different unknown compounds with retention times
(tR between 14.5 and 18 min, labelled with asterisks in Fig. 2A)
and mass spectra (Fig. S4) compatible with diterpenoids were
5
I. Jiménez Amezcua, S. Rivas Blas, M. Díez Municio et al.
Journal of Chromatography A 1676 (2022) 463198
Fig. 2. GC-MS profiles of FKS1 (A) and FKS12 (B) methanolic extracts. 1. mannitol, 2. fructose, 3. galactose E + mannose E, 4. glucose E, 5. glucose Z + galactose Z + mannose
Z, 6. myo-inositol, 7. sedoheptulose, 8. 1,9-DDF, 9. forskolin D, 10. 9-DE, 11. forskolin, 12. isoforskolin, 13. maltose, 14. maltotriose, 15. malic acid, 16. quinic acid, 17. viboquercitol, 18. sucrose, ∗ unknowns.
vegetable samples such as rhodiola (Sedum roseum, [22]) and carrot (Daucus carota L.,[24]).
Regarding food supplements that did not contain forskolin
(groups 3 and 4, Fig. S2), different GC-MS profiles were obtained.
All supplements from group 3 showed the presence of different
compounds non characteristic of C. forskohlii roots. In this sense,
in FKS12, apart from carbohydrates (glucose fructose, myo-inositol
and sucrose), vibo-quercitol, quinic acid and malic acid were identified (Fig. 2B). vibo-Quercitol (also known as viburnitol) is a deoxyinositol previously described in different oak species [25], while
malic and quinic acids are carboxylic acids ubiquitous in plant
kingdom [26,27], but not previously detected in C. forskohlii. Similarly, caffeine, gallic acid, epicatechin and catechin, characteristic
compounds of green tea [28], were detected in FKS17 and FKS18
(Fig. S5A), while pinitol, ononitol and chiro-inositol, typical of soy
bean leaves [29], were identified in FKS19 (Fig. S5B). The presence of these compounds in supplements of group 3, not detected
in C. forskohlii roots extract, together with the no similarity with
the typical carbohydrate and terpenoid profile experimentally determined for this reference extract, pointed at the presumed substitution of the natural source declared in these supplements.
On the other hand, group 4 (Fig. S2) consisted of supplements
that only contained small amounts of carbohydrates (glucose, fructose, maltose and/or maltotriose) or those in which no compound
was detected by this chromatographic technique.
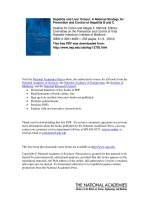
LC-MS profiles. A similar profile was observed for all the food supplements containing forskolin (groups 1 and 2). Fig. 3A shows
the LC-Q MS profile of FKS1 as an example. Apart from forskolin
and 1,9-DDF, different diterpenoids such as deacetylforskolin
(forskolin D), deoxyforskolin isomers (i.e., 9-DE, 1-acetoxycoleosol),
forskolin isomers (isoforskolin and 1-acetyl-7-deacetylforskolin),
acetyl-forskolin isomers (forskolin B and 6-acetylforskolin) and
carnosic acid were tentatively identified by LC-QToF MS (Table S2).
6
I. Jiménez Amezcua, S. Rivas Blas, M. Díez Municio et al.
Journal of Chromatography A 1676 (2022) 463198
Fig. 3. LC-MS profiles of FKS1 (A) and FKS12 (B) methanolic extracts. 1. mono-, di- and trisaccharides, 2. forskolin D, 3. 9-DE, 4. isoforskolin, 5. 1-acetoxycoleosol, 6. 1acetyl-7-deacetylforskolin + forskolin B, 7. forskolin, 8. deoxyforskolin isomer, 9. 1,9-DDF+6-acetylforskolin, 10. carnosic acid, 11. quercitol, 12. jatrorrhizine, 13. palmatine,
14. berberine.
Most of these assignations were in good agreement with those
previously described by Zhang et al. [30] in C. forskohlii plants.
These compounds were also identified in the C. forskohlii reference extract (Fig. S3C), confirming thus the genuine origin of these
supplements. Concentrations of these compounds in FKS under
study can be found in Table 4. Isoforskolin was the most abundant diterpenoid, apart from forskolin, with the highest values in
FKS24 and FKS1 (17.7 and 14.4 mg g−1 , respectively), followed by
1-acetoxycoleosol (7.0 and 4.5 mg g−1 for FKS24 and FKS22, respectively).
LC-Q MS analyses of FKS5, FKS13-FKS16 only revealed the presence of one peak eluting at the beginning of the chromatogram
(1.25 min) corresponding to the coelution of carbohydrates from
DP1 ([M+Na]+ = 203) to DP5 ([M+Na]+ = 851). The presence of
these compounds in supplements could mainly arise from excipients such as maltodextrins, corn starch or cellulose used for their
manufacturing, although their presence was only declared in FKS5
and FKS13.
As previously found by GC-MS, other compounds atypical of C.
forskohlii reference extract but characteristic of other plant sources
were also detected in FKS12, FKS17, FKS18 and FKS19. MS/MS patterns obtained by LC-QToF MS and the use of Metlin database allowed the tentative identification of jatrorrhizine, palmatine and
berberine in FKS12 (Fig. 3B). These compounds are characteristic
7
tR (min)
IT
FKS1
FKS2
FKS3
FKS4
FKS5
FKS6
FKS7
FKS9
FKS10
FKS12$
FKS13
FKS16
FKS17
FKS18
FKS19#
Mannitol
7.54
2003
-
-
-
-
-
-
-
-
-
-
-
-
-
-
0.033
(0.03)
1.49
(0.08)
-
2069 /
2089
2158
-
0.57
(0.03)
-
0.80
(0.03)
-
0.57
(0.02)
-
2310 /
2324
2741
-
-
-
-
-
-
-
6.5
(0.3)
0.76
(0.05)
-
4.4
(0.3)
0.64
(0.05)
-
0.053
(0.06)
6.9
(0.3)
0.83
(0.04)
8.0
(0.3)
0.34
(0.02)
-
-
-
-
1.1
(0.1)
0.79
(0.06)
tr
-
-
-
1.4
(0.1)
0.89
(0.04)
1.71
(0.09)
2.1
(0.8)
0.99
(0.09)
0.63
(0.07)
-
-
12.0
(0.5)
7.7
(0.2)
-
-
3.2
(0.5)
4.8
(0.3)
1.12
(0.06)
-
-
2974/
2992
3846/
3876
1.63
(0.07)
-
-
24.77/
24.94
32.18/
32.60
1.10
(0.08)
-
1.14
(0.04)
0.085
(0.004)
19.0
(0.7)
-
0.44
(0.02)
-
11.04/
11.24
20.96
0.76
(0.04)
0.13
(0.01)
14.1
(2.5)
-
0.82
(0.09)
0.35
(0.01)
4.8
(0.4)
-
0.042
(0.08)
2.1
(0.2)
-
8.24 /
8.45
9.22
3.8
(0.5)
0.33
(0.01)
2.0
(0.2)
0.08
(0.01)
-
-
8.12
0.47
(0.08)
4.1
(0.5)
0.09
(0.01)
1.6
(0.2)
0.55
(0.09)
50.6
(6.3)
-
-
2013 /
2022
2058
0.13
(0.01)
0.96
(0.04)
tr∗
-
7.65/ 7.74
0.14
(0.01)
1.15
(0.05)
-
-
Fructose
0.33
(0.05)
1.7
(0.2)
0.44
(0.02)
1.21
(0.09)
0.27
(0.03)
25.0
(1.9)
-
14.0
(0.9)
14.3
(0.7)
3.6
(0.5)
12.2
(1.1)
12.2
(1.0)
3.5
(0.6)
97.7
(4.5)
3.09
(0.15)
10.1
(0.6)
Identification
Galactose
+Mannose
Glucose
myoInositol
Sedoheptulose
Sucrose
Maltose
Maltotriose
∗
$
#
-
-
-
I. Jiménez Amezcua, S. Rivas Blas, M. Díez Municio et al.
Table 3
Concentrations (mg g−1 ) of carbohydrates detected by GC-MS in methanolic extracts of FKS. Standard deviation in parenthesis (n = 3).
tr: traces.
vibo-quercitol: 3.3 (0.4) mg g−1 .
chiro-inositol: tr, pinitol: 4.9 (0.3) mg g−1 and ononitol: 0.54 (0.03) mg g−1 .
8
Table 4
Concentrations (mg g−1 ) of forskolin derivatives detected by LC-MS in methanolic extacts of FKS. Standard deviation in parenthesis (n = 3).
Identification
Forskolin D
tR (min)
13.53
14.43
Isoforskolin
15.67
1Acetoxycoleosol
16.65
21.02
Deoxyforskolin
isomer
1,9DDF+6acetylforskolin
∗
∗∗
22.50
tr: traces (< LOQ).
-: non detected (< LOD).
FKS2
FKS3
FKS6
FKS7
FKS8
FKS9
FKS10
FKS11
FKS20
FKS21
FKS22
FKS23
FKS24
∗
-
tr
tr
-
tr
-
tr
tr
-
-
0.2
(0.1)
tr
0.23
(0.01)
-
tr
0.22
(0.01)
tr
tr
0.35
(0.03)
0.82
(0.06)
tr
0.340
(0.002)
tr
0.090
(0.001)
2.61
(0.17)
3.02
(0.14)
tr
11.2
(0.2)
3.73
(0.07)
0.57
(0.03)
1.5
(0.1)
0.3
(0.1)
7.3
(0.1)
2.6
(0.1)
0.54
(0.04)
tr
0.6
(0.1)
3.7
(0.2)
2.0
(0.1)
0.25
(0.01)
0.62
(0.02)
0.06
(0.02)
4.18
(0.03)
tr
tr
∗∗
2.99
(0.01)
4.54
(0.02)
2.8
(0.1)
2.6
(0.2)
2.17
(0.09)
tr
1.39
(0.09)
1.0
(0.3)
17.7
(0.1)
7.0
(0.5)
-
1.8
(0.1)
1.99
(0.01)
tr
2.26
(0.03)
0.02
(0.0005)
0.52
(0.01)
0.570
(0.001)
3.05
(0.09)
2.51
(0.03)
2.6
(0.2)
1.6
(0.11)
7.57
(0.09)
1.51
(0.03)
0.74
(0.01)
14.40
(0.01)
1.37
(0.09)
0.81
(0.01)
tr
2.07
(0.03)
tr
-
tr
tr
-
0.11
(0.01)
tr
tr
Journal of Chromatography A 1676 (2022) 463198
9-DE
FKS1
I. Jiménez Amezcua, S. Rivas Blas, M. Díez Municio et al.
Journal of Chromatography A 1676 (2022) 463198
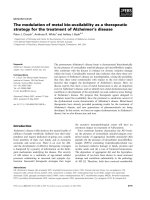
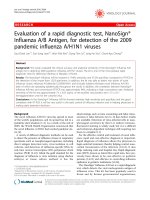
Fig. 4. Concentration of forskolin in FKS1 and reference root extract during storage at 50 °C for 12 weeks. Different letters indicate significant (p < 0.05) differences in
forskolin concentration between storage times.
of several Chinese herbal medicines [31] such as Coptis chinensis Franch and Tinospora cordifolia [32]. Similarly, theanine, theobromine, epicatechin, catechin, theaflavin and epigallocatechin gallate were identified by LC-QToF MS in FKS17 and FKS18, characteristic of green tea [28]; and genistin, daidzin, glycitin, daidzein
and glycitein in FKS19, characteristic of soy bean [33] (Fig. S6A, B).
Assignations of all these compounds, and their presumable implication in C. forskohlii frauds were also confirmed by the analysis
of laboratory-made genuine extracts of these plant sources (green
tea and soy bean leaves, considering also the identifications carried
out by GC-MS) and a commercial berberine supplement of certified
origin.
Finally, and in agreement with GC-MS data, the LC-Q MS analysis of 25% of supplements analysed (Group 4) evidenced the very
limited number (or even the absence) of compounds detectable by
this chromatographic technique. In order to characterize their composition, these samples were subjected to 13 C-NMR and 1 H-NMR
analysis, revealing the presence of glucooligosaccharides of high
molecular weight (Fig. S7), which are only described as excipients
in only some of them (e.g., FKS5 and FKS13).
and 1 week samples. On the contrary, statistically significant differences were found in forskolin concentration for 1 week onwards
compared to control. Despite forskolin degradation might occur at
some extent with inappropriate storage of FKS, the variability here
observed in terms of absolute concentration would not support the
lack of this bioactive observed for several FKS.
4. Conclusions
The proposed multi-analytical strategy here optimized in terms
of chromatographic and MS operating parameters, based on the
combined use of GC-MS and LC-MS data, has been shown to be advantageous over single analytical techniques to evidence not only
frauds regarding the content of forskolin, but also related to the
undeclared addition of other plant sources in C. forskohlii supplements.
The application of this novel methodology has revealed that a
high percentage of the C. forskohlii supplements analyzed do not
comply with the declarations made on their labelling. These results
highlight the need for a more reliable control of these products by
the competent authorities and the usefulness of the methodology
proposed in this study to detect these frauds.
3.4. Stability of forskolin with storage
Declaration of Competing Interest
Considering the low percentage of supplements containing
forskolin, a stability study of this compound was carried out to
evaluate its potential degradation after manufacturing and during
the commercialization period before the expiration date. For this
purpose, the C. forskohlii reference extract and FKS1 were stored
under accelerated conditions (50 °C, 12 weeks). Fig. 4 shows the
changes in forskolin concentration for these two samples along the
studied period. Although a slight decreasing trend was observed in
forskolin content of FKS1, only significant differences were found
at the end of the storage period (12 weeks) compared to control
The authors declare that they have no known competing financial interests or personal relationships that could have appeared to
influence the work reported in this paper.
CRediT authorship contribution statement
Ignacio Jiménez Amezcua: Formal analysis, Methodology, Validation, Investigation, Writing – original draft. Sergio Rivas Blas:
9
I. Jiménez Amezcua, S. Rivas Blas, M. Díez Municio et al.
Journal of Chromatography A 1676 (2022) 463198
Methodology, Validation, Writing – original draft. Marina Díez Municio: Investigation, Project administration, Resources, Writing –
original draft, Writing – review & editing. Ana Cristina Soria: Data
curation, Investigation, Project administration, Resources, Validation, Visualization, Writing – original draft, Writing – review &
editing. Ana Isabel Ruiz Matute: Conceptualization, Data curation,
Investigation, Supervision, Writing – original draft, Writing – review & editing. María Luz Sanz: Conceptualization, Funding acquisition, Investigation, Project administration, Resources, Supervision,
Writing – original draft, Writing – review & editing.
[12] K.G. Ramawat, J.M. Mérillon, Methods of isolation and analysis of forskolin
from Coleus forskohlii, Nat. Prod. Phytochem. Bot. Metab. Alkaloids Phenolics
Terpenes (2013) 3325–3343, doi:10.1007/978- 3- 642- 22144- 6.
[13] M.M. Ibrahim, N.M. Arafa, U.I. Aly, Antioxidant activity, phenol and flavonoid
contents of plant and callus cultures of Plectranthus barbatus andrews, Egypt.
Pharm. J. 17 (2018) 32, doi:10.4103/epj.epj_38_17.
[14] M.G.D.V. Silva, L.B. Lima, M.D.C.F. De Oliveira, M.C. De Mattos, J. Mafezoli,
Quantification of barbatusin and 3 β -hydroxy-3-deoxybarbatusin in Plectranthus species by HPLC-DAD, Int. J. Anal. Chem. (2017) 2017, doi:10.1155/2017/
2397131.
[15] B.T. Schaneberg, I.A. Khan, Quantitative analysis of forskolin in Coleus forskohlii
(Lamiaceae) by reversed-phase liquid chromatography, J. AOAC Int. 86 (2003)
467–470, doi:10.1093/jaoac/86.3.467.
[16] N. Virgona, Y. Taki, K. Umegaki, A rapid HPLC with evaporative light scattering
method for quantification of forskolin in multi-herbal weight-loss solid oral
dosage forms, Pharmazie 65 (2010) 322–326, doi:10.1691/ph.2010.9346.
[17] L. Ruiz-Aceituno, C. Carrero-Carralero, A.I. Ruiz-Matute, L. Ramos, M.L. Sanz,
I. Martínez-Castro, Characterization of cyclitol glycosides by gas chromatography coupled to mass spectrometry, J. Chromatogr. A 1484 (2017) 58–64,
doi:10.1016/j.chroma.2017.01.001.
[18] P. Inamdar, P. Kanitkar, J. Reden, N. de Souza, Quantitative determination
of forskolin by TLC and HPLC, Planta Med. 50 (1984) 30–34, doi:10.1055/
s- 2007- 969614.
[19] D.J. Cuthbertson, S.R. Johnson, J. Piljac-Žegarac, J. Kappel, S. Schäfer, M. Wüst,
R.E.B. Ketchum, R.B. Croteau, J.V. Marques, L.B. Davin, N.G. Lewis, M. Rolf,
T.M. Kutchan, D.D. Soejarto, B.M. Lange, Accurate mass-time tag library for
LC/MS-based metabolite profiling of medicinal plants, Phytochemistry 91
(2013) 187–197, doi:10.1016/j.phytochem.2013.02.018.
[20] N.J. De Souza, Industrial development of traditional drugs: the forskolin example a mini-review, J. Ethnopharmacol. 38 (1993) 167–175, doi:10.1016/
0378- 8741(93)90013- U.
[21] M. Bhowal, B. Pharm, D.M. Mehta, Coleus Forskholii: phytochemical and pharmacological profile, Int. J. Pharm. Sci. Res. 8 (2017) 3599–3618, doi:10.13040/
IJPSR.0975- 8232.8(9).3599- 18.
[22] C. Carrero-Carralero, S. Rodríguez-Sánchez, I. Calvillo, I. Martínez-Castro,
A.C. Soria, L. Ramos, M.L. Sanz, Gas chromatographic-based techniques for the
characterization of low molecular weight carbohydrates and phenylalkanoid
glycosides of Sedum roseum root supplements, J. Chromatogr. A 1570 (2018)
116–125, doi:10.1016/j.chroma.2018.07.071.
[23] N.E. Tolbert, C.W. Nystrom, P.C. Kerr, Sedoheptulose in Coleus, Plant Physiol. 32
(1957) 269–274, doi:10.1104/pp.32.4.269.
[24] P.K. Inamdar, H. Dornauer, N.J. de Souza, GLC method for assay of forskolin, a
novel positive inotropic and blood pressure-lowering agent, J. Pharm. Sci. 69
(1980) 1449–1451, doi:10.10 02/jps.260 0691230.
[25] W.A. Anderson, B. Magasanik, The pathway of myo-inositol degradation in
aerobacter aerogenes, J. Biol. Chem. 246 (1971) 5662–5675, doi:10.1016/
s0021-9258(18)61857-5.
[26] T. Wang, A.R. Gonzalez, E.E. Gbur, J.M. Aselage, Organic acid changes during
ripening of processing peaches, J. Food Sci. 58 (1993) 631–632, doi:10.1111/j.
1365-2621.1993.tb04343.x.
[27] J. Zhang, J. Yun Nie, J. Li, H. Zhang, Y. Li, S. Farooq, S.A.S. Bacha, J. Wang, Evaluation of sugar and organic acid composition and their levels in highbush
blueberries from two regions of China, J. Integr. Agric. 19 (2020) 2352–2361,
doi:10.1016/S2095- 3119(20)63236- 1.
[28] L. Zhang, C.T. Ho, J. Zhou, J.S. Santos, L. Armstrong, D. Granato, Chemistry
and biological activities of processed camellia sinensis teas: a comprehensive review, Compr. Rev. Food Sci. Food Saf. 18 (2019) 1474–1495, doi:10.1111/
1541-4337.12479.
[29] J.G. Streeter, Simple partial purification of D-pinitol from soybean leaves, Crop
Sci. 41 (2001) 1985–1987, doi:10.2135/cropsci2001.1985.
[30] W.W. Zhang, J.G. Luo, J.S. Wang, Y.Y. Lu, L.Y. Kong, LC-DAD-ESI-MS-MS for characterization and quantitative analysis of diterpenoids from Coleus forskohlii,
Chromatographia 70 (2009) 1635–1643, doi:10.1365/s10337- 009- 1370- y.
[31] Q. Liu, Y. Liu, Y. Li, S. Yao, Nonaqueous capillary electrophoresis coupled with
laser-induced native fluorescence detection for the analysis of berberine, palmatine, and jatrorrhizine in Chinese herbal medicines, J. Sep. Sci. 29 (2006)
1268–1274, doi:10.10 02/jssc.20 060 0 032.
[32] J. Wang, Y. Jiang, B. Wang, N. Zhang, A review on analytical methods for
natural berberine alkaloids, J. Sep. Sci. 42 (2019) 1794–1815, doi:10.1002/jssc.
201800952.
[33] Y. Nakamura, S. Tsuji, Y. Tonogai, Determination of the levels of isoflavonoids
in soybeans and soy-derived foods and estimation of isoflavonoids in the
Japanese daily intake, J. AOAC Int. 83 (20 0 0) 635–650, doi:10.1093/jaoac/83.
3.635.
Acknowledgments
This work is part of the I+D+I projects AGL2016-80475R funded by the Spanish MINECO/AEI/FEDER, UE and PID2019106405GB-I00 financed by MCIN/AEI/10.13039/50110 0 011033. Authors thank the Comunidad of Madrid and European funding from
FSE and FEDER programs (project S2018/BAA-4393, AVANSECAL-IICM) for financial support. I. Jiménez-Amezcua thanks the Comunidad de Madrid for a Industrial Doctorate grant (IND2020/BIO17409) awarded to IQOG (CSIC) and Pharmactive Biotech Products
S.L.
Supplementary materials
Supplementary material associated with this article can be
found, in the online version, at doi:10.1016/j.chroma.2022.463198.
References
[1] European Food Safety Authority (EFSA), (2005). />topics/topic/food-supplements.
[2] E. Hong, S.Y. Lee, J.Y. Jeong, J.M. Park, B.H. Kim, K. Kwon, H.S. Chun, Modern
analytical methods for the detection of food fraud and adulteration by food
category, J. Sci. Food Agric. 97 (2017) 3877–3896, doi:10.1002/jsfa.8364.
[3] J.T. Dwyer, P.M. Coates, M.J. Smith, Dietary supplements: regulatory challenges
and research resources, Nutrients 10 (2018) 1–24, doi:10.3390/nu10010041.
[4] D. Koncz, B. Tóth, O. Roza, D. Csupor, A systematic review of the european
rapid alert system for food and feed: tendencies in illegal food supplements for
weight loss, Front. Pharmacol. 11 (2021) 1–14, doi:10.3389/fphar.2020.611361.
[5] D.M. Bhowal, M. Mehta, Coleus forskholii: phytochemical and pharmacological
profile, Int. J. Pharm. Sci. Res. 8 (2017) 3599–3618.
[6] S. Murugesan, C. Rajeshkannan, R. Sumathi, P. Manivachakam, D. Suresh Babu,
Bioactivity of root hexane extract of Coleus forskohlii briq. Labiatae: GC/MS/MS
characterization and identification, Eur. J. Exp. Biol. 2 (2012) 1469–1473
journal- of- experimental- biology/
vol2- iss5/EJEB- 2012- 2- 5- 1469- 1473.pdf.
[7] P. Singh, M.A. Suryanarayana, Effect of solvents and extraction methods on
forskolin content from coleus forskholii roots, Indian J. Pharm. Sci. 81 (2019)
1136–1140, doi:10.36468/pharmaceutical-sciences.614.
[8] K. Rajkumar, R. Malathi, Phytochemical investigation GC-MS analysis and in
vitro antimicrobial activity of Coleus forskohlii, Bangladesh J. Pharmacol. 10
(2015) 924–930, doi:10.3329/bjp.v10i4.24406.
[9] B. Salahshour, S. Sadeghi, H. Nazari, K. Soltaninejad, Research paper: determining undeclared synthetic pharmaceuticals as adulterants in weight loss herbal
medicines, Int. J. Med. Toxicol. Forensic Med. 10 (2020) 1–8, doi:10.32598/
ijmtfm.v10i1.26253.
[10] B. Salehi, M. Staniak, K. Czopek, A. Stepien, K. Dua, The therapeutic potential of the labdane diterpenoid forskolin, Appl. Sci. 9 (2019) 4089, doi:10.3390/
app9194089.
[11] I. Pateraki, J. Andersen-Ranberg, N.B. Jensen, S.G. Wubshet, A.M. Heskes,
V. Forman, B. Hallström, B. Hamberger, M.S. Motawia, C.E. Olsen, D. Staerk,
J. Hansen, B.L. Møller, B. Hamberger, Total biosynthesis of the cyclic AMP
booster forskolin from Coleus forskohlii, eLife 6 (2017) 1–28, doi:10.7554/eLife.
23001.
10