Impregnation of preparative high-performance solid phase extraction chromatography columns by organophosphorus acid compounds
Bạn đang xem bản rút gọn của tài liệu. Xem và tải ngay bản đầy đủ của tài liệu tại đây (1.64 MB, 9 trang )
Journal of Chromatography A 1676 (2022) 463278
Contents lists available at ScienceDirect
Journal of Chromatography A
journal homepage: www.elsevier.com/locate/chroma
Impregnation of preparative high-performance solid phase extraction
chromatography columns by organophosphorus acid compounds
Meher G. Sanku, Kerstin Forsberg, Michael Svärd∗
Department of Chemical Engineering, KTH Royal Institute of Technology, Teknikringen 42, SE-11428 Stockholm, Sweden
a r t i c l e
i n f o
Article history:
Received 17 March 2022
Revised 18 May 2022
Accepted 24 June 2022
Available online 25 June 2022
Keywords:
Physisorption
Impregnation
Metal extraction
Column
Separation
a b s t r a c t
The flexible and reversible preparation of columns for use in high-performance solid phase extraction
chromatography by physisorption of organophosphorus acid extractants has been investigated in detail.
Two extractants have been evaluated, bis (2-ethyl-1-hexyl) phosphoric acid (HDEHP) and 2-ethyl-1-hexyl
(2-ethyl-1-hexyl) phosphonic acid (HEHEHP), but the developed procedure should be broadly applicable
to other extractants. The liquid-liquid solubility of the extractants in feed solvents consisting of aqueous
ethanol solutions of varying composition has been determined. The total amount of adsorbed extractant has been quantified by complete desorption and elution with ethanol followed by acid-base titrimetry. Column impregnation with feed solutions of varying concentration in the undersaturated region has
been systematically evaluated, and the influence of a subsequent water wash step has been explored.
It is shown that to achieve a robust and reproducible physisorption, the adsorbed amount of extractant
should be determined after the wash step, and care must be taken when using indirect methods of measurement. Equilibrium Langmuir-type adsorption isotherms as a function of the extractant concentration
in the feed solution have been determined. Adsorption of HEHEHP is higher than HDEHP for equal feed
compositions, but the solubility of HEHEHP is lower, resulting in approximately identical maximum coverage levels. The ability of the resulting columns to separate rare earth elements have been verified for a
mixture of eight metals using a combined isocratic and gradient elution of nitric acid.
© 2022 The Author(s). Published by Elsevier B.V.
This is an open access article under the CC BY license ( />
1. Introduction
Chromatography as a separation method has been gaining attention as a promising alternative to solvent extraction – a current cornerstone technology in hydrometallurgy – for many important metals including but not limited to rare earths and precious
metals [1–5]. Depending on the metals and the purity requirements, solvent extraction can require a large number of mixersettler units in series, which consume vast quantities of often
volatile and hazardous organic solvents [6]. By attaching a suitable extractant onto the solid phase in a chromatographic column,
the extraction process can be made more sustainable and environmentally friendly. This is partly due to reduced consumption of
solvents and extractants, and improved chemical recycling possibilities, but also because a single column corresponds to multiple
equilibrium stages, which eliminates the need for multiple units.
In high-performance solid phase extraction chromatography [5,7],
reverse-phase HPLC columns packed with particles containing ad-
∗
Corresponding author.
E-mail address: (M. Svärd).
sorbed extractant molecules are used. The metals are typically separated by elution with a gradient of a mineral acid, such as nitric
acid, in a dynamic process. The main challenge with a chromatographic process is to increase the productivity while retaining the
purity of individual components [8]. Although partly a multivariate
optimization problem involving decisions regarding operation variables and fractionation [5], attention should also be directed towards how to reliably and effectively supply the solid phase with
a high and stable coverage of extractant.
The molecular structure of many suitable extractants is composed of a hydrophilic part that interacts with the metal ions and a
lipophilic part that interacts with the nonpolar phase, which could
be an extraction solvent or the stationary phase of a chromatographic column. Bis (2-ethyl-1-hexyl) phosphoric acid (HDEHP) is
amongst the most extensively studied extractants [5,7,9–12] with
some studies also available on 2-ethyl-1-hexyl (2-ethyl-1-hexyl)
phosphonic acid (HEHEHP) [1,10,13] and other acidic as well as
neutral extractants [1,10,13–16]. Such extractants can be physically
adsorbed (physisorption) onto the solid particles of a reverse phase
column. The stationary material in such columns typically consists
of porous silica particles functionalized with e.g. octadecyl (C18 )
carbon chains. By impregnating the particles with a feed solution
/>0021-9673/© 2022 The Author(s). Published by Elsevier B.V. This is an open access article under the CC BY license ( />
M.G. Sanku, K. Forsberg and M. Svärd
Journal of Chromatography A 1676 (2022) 463278
containing dissolved extractant, the surface of the particles can be
coated with a layer of extractant molecules. The coverage reached
is limited by the appropriate adsorption isotherm under the conditions of the impregnation process. Once established, the interactions between the lipophilic part of the extractant and the nonpolar chains on the support material are stable in aqueous solution,
even at quite low pH.
The extractant can be loaded onto the solid support material
either before (batch loading) [7,10,12,14,15,17,18] or after (flowthrough loading) [7,9,13,18–20] the column is packed. The flowthrough impregnation process has several advantages; it is easy to
perform and undo without the need for specialized equipment, the
resulting column performance has been repeatedly claimed to be
stable over several repeated elutions even under harsh acidic conditions, and the choice of extractant and the coverage level – and
thereby the column performance – can be tuned to specific needs.
Moreover, any gradual decrease in the column performance could
easily be restored to initial levels by a re-impregnation step.
Using 55 wt% methanol in water as feed solvent, extractant coverages in the range 89 to 345 mol HDEHP/m3 column have been
attained in previous studies [7,9,13,21]. For HEHEHP, a coverage of
103 mol/m3 column has been reported [13]. However, the methodology for quantification and validation of the coverage is often not
described, or differs, ranging from analysis of breakthrough solution during impregnation [3,7] to complete flushing of extractant
before analysis [13]. Moreover, it is rarely shown that the impregnation processes are reproducible or under which circumstances.
Kifle et al. evaluated impregnation of columns at a coverage of approx. 120 mol/ m3 column (approx. 0.3 mmol HDEHP on the column) and reported that the process was repeatable [7]. No studies
were performed at higher extractant concentrations. Conversely,
Max-Hansen reported that the ligand concentration after column
impregnation did not always reach expected levels (although no
column details were reported in the study) [3].
In order to serve as the basis for a feasible separation process,
it is of crucial importance that the impregnation process can reproducibly and reliably deliver a column with the desired extractant
coverage level, and a sufficient stability over repeated elutions under the conditions required to separate the metals for which it is
designed. Currently, there is ambiguity or a lack of clarity in the
available literature with respect to these matters. In the present
work, the first step for metal extraction using column chromatography, the column preparation step, has been thoroughly studied,
for two extractants (HDEHP and HEHEHP; shown in Fig. 1). Data
on the liquid-liquid solubility of the extractants in the feed solvent
mixtures, crucial to avoid liquid-liquid phase separation during impregnation which could lead to obstructed flow, pressure build-up
and a damaged column, has been collected. Adsorption isotherms,
key to knowing how to alter the feed solution composition in order
to obtain the required extractant coverage on the stationary phase,
have been measured. Particular attention is devoted to the repro-
ducibility of the impregnation process. Two methods of estimating the extractant coverage are contrasted, shedding light on the
adsorption behaviour of the extractant. Reverse phase C18 -coated
mesoporous silica columns have been impregnated with each extractant using an ethanol-water mixture as feed solvent. The resulting columns have been evaluated with respect to their ability
to separate eight REEs predominant in apatite ore (La, Ce, Pr, Nd,
Sm, Gd, Dy and Y) [22]. However, the results of the study should be
broadly applicable to other RP columns, solvents and extractants.
2. Materials and methods
2.1. Materials
The different solutions used in this study are described below.
All solutions were prepared using the individual components as received.
HNO3 (>69.9%), and ethanol (>99%) were purchased from VWR,
acetic acid (>96%) from Merck, HDEHP (D2 EHPA, bis (2-ethyl-1hexyl) phosphoric acid; >97%), Arsenazo III (2,7-bis (2-arsonophenylazo) chromotropic acid) and urea (>99.5%) from SigmaAldrich, HEHEHP (EHEHPA; PC-88A; 2-ethyl-1-hexyl (2-ethyl-1hexyl) phosphonic acid; >95%) from Daihachi Chemical Industry
Co., and NaOH (2.5 M) from J.T.Baker. Single-element REE standard
solutions (10,0 0 0 mg/L) were purchased from Teknolab Sorbent. All
chemicals were used as received. Milli-Q grade water was used to
prepare all the solutions.
Column conditioner. A solution of ethanol and water with a
concentration matching the feed solution: 62 wt% ethanol in water.
Feed solution. Acidic organophosphorus solutions of HDEHP or
HEHEHP dissolved in 62 wt% ethanol in water. The amount of extractant in these solutions was decided based on the solubility, and
the resulting solution was verified to be a homogeneous singlephase liquid.
NaOH solution. A 0.25 M solution of NaOH in water was used
for titrations.
REE solution. A solution of eight REEs (La, Ce, Pr, Nd, Sm, Gd,
Dy and Y), with a concentration of 37.5 mg/L (with respect to each
metal) or 300 mg/L (with respect to the total REE content), prepared from standard solutions mixed in equal amounts. The HNO3
concentration in the solution was maintained at 0.59 M.
HNO3 solutions. 2.0 M and 5.0 M HNO3 solutions prepared by
dilution of concentrated HNO3 (69.9%).
Arsenazo III solution. A 0.15 mM aqueous Arsenazo III solution, containing 0.10 M acetic acid and 10 mM urea, used for postcolumn reaction.
2.2. Experimental setup
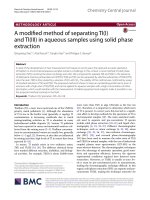
A modified Thermo Scientific Dionex ICS-50 0 0+ Ion Chromatography System, shown in Fig. 2, has been used in the present
work. Solutions, kept in a cryostatic water bath (Julabo FP-50,
25±1 °C) for temperature control, were pumped via a degasser
through the column using a quaternary gradient pump. The column temperature was maintained at 25±2 °C by means of a column thermostat (BioTek Instruments HPLC 582) and the tubing
between the solution bottles and the column was thermally insulated. A dedicated pump was used for the post-column reaction solution, which was mixed with the eluting solution downstream of the column. A 750 μL knitted reaction coil was used to
provide the necessary reaction time for Arsenazo III-REE complex
formation. A Dionex UV–Vis variable wavelength detector (VWD),
placed downstream of the column, was used to detect extractant breakthrough signals at 288 nm and chromatograms (Arsenazo III-REE complexes) at 658 nm. An automatic fraction collector module was used to collect samples for NaOH titration. A
Fig. 1. Molecular structure of the two extractants.
2
M.G. Sanku, K. Forsberg and M. Svärd
Journal of Chromatography A 1676 (2022) 463278
Fig. 2. Schematic of the HPLC setup used in this work. The solutions used at the different channels in the water bath vary with the purpose. For column preparation: A –
column conditioner, B – acidic organophosphorus solution, C – ethanol, and D – Milli-Q water. For REE separation: A – Milli-Q water, B – 2 M HNO3 , C – 5 M HNO3 and E –
Arsenazo III solution.
150 mm x 4.6 mm (i.d.) column packed with Kromasil
(Nouryon) C18 -functionalized mesoporous spherical particles (di˚ pore volume = 0.9 mL/g;
ameter = 10 μm; pore size = 100 A;
BET-surface = 320 m2 /g; packed density = 0.66 g/mL; carbon content = 20% or 3.5 μmol/m2 ) was used. The volume of the column
available for the liquid flow (henceforth CV) as well as contributions to the dead volume was measured by tracer analysis using
uracil.
2.3.3. Titration
HDEHP and HEHEHP can be detected at a wavelength of
288 nm. However, because of the wide range of extractant concentrations evaluated, a linear relationship between the intensity and
concentration according to the Beer-Lambert law is not applicable,
and the use of the detector was restricted to qualitative analysis. In
this work, the amount of adsorbed organophosphorus compound
was calculated using NaOH titration. Two methods were used: the
indirect method (Eq. (1)), by titration of the feed collected after
passing through the column, and the direct method (Eq. (2)), by
titration of the ethanol eluate collected after washing the column
with water.
2.3. Column preparation
2.3.1. Solubility of organophosphorus compounds
The (liquid-liquid) solubility of the organophosphorus extractant compounds (HDEHP and HEHEHP) in aqueous ethanol solutions has been determined using an iterative process. Initially, 0.4
to 5 g of the respective organophosphorus compound was added to
3.6 to 15 g of ethanol to form a homogeneous solution. Water was
added to this solution dropwise until the solution turned turbid,
indicating liquid-liquid phase separation. Ethanol was again added
until the clear point was reached. The process was then repeated
several times. The cloud points (onset of liquid-liquid separation)
and the clear points (homogeneous solution) thus form two curves,
which flank the true solubility curve. Experiments were performed
in a total of 20 vials to produce 104 and 114 data points (counting
both cloud and clear points) for HDEHP and HEHEHP, respectively.
q = c1 F t − c2 V
(1)
q = c2 V
(2)
where q is the estimated amount of adsorbed acid (in mmol), c1 is
the inlet concentration (in M) of acid feed solution to the column,
F is the feed flow rate (in mL/min), t is the feed duration (in min),
V is the volume of NaOH solution consumed (in mL) and c2 is the
concentration of NaOH solution (in M).
The difference between the acid amount obtained by both
methods should correspond to the difference between the amounts
of extractant adsorbed strongly and weakly (weakly adsorbed acid
is removed in the water wash step). All samples were titrated
with 0.25 M NaOH solution using phenolphthalein as indicator. To
establish the accuracy and validity of the process, titration was
also performed using solutions of known amounts of HDEHP and
HEHEHP. Titration of samples from the water wash step was not
done due to the presence of two liquid phases.
2.3.2. Resin impregnation
The retention of ligands on the column is a result of hydrophobic interactions between the C18 chains and the aliphatic moieties
of the HDEHP and HEHEHP molecules. Before column impregnation, any retained acid from previous runs was eluted with ethanol
(14 CVs). Then 20 CVs of column conditioner was run through the
column at 1 mL/min. This was followed by equilibration of the column with organophosphorus feed solution at varying flow rates
(0.85 to 1 mL/min for HEHEHP and 0.61 to 1 mL/min for HDEHP)
chosen to ensure constant inlet pressure (72.5 ± 4 bar). Preliminary runs were performed to measure the amount of feed solution required to achieve an equilibrium coverage level. Finally, the
column was washed with Milli-Q water (at least 20 CVs). For improved reproducibility, special attention has been paid to transition
steps that can lead to formation of two phases. For example, the
ethanol wash and the water wash steps are performed at low flow
rates of 0.1 or 0.2 mL/min for at least 1.2 CVs followed by gradual
increase of flow rate and flushing the column with ethanol/water
at a higher flow rate. The higher flow rate was set to 1 mL/min for
ethanol and 2 mL/min for water unless otherwise specified.
2.3.4. Data presentation
The performance indicator of interest in this study is the
amount of organophosphorus acid adsorbed on the stationary
phase (the extractant coverage). Presenting coverage values only
as amount of acid adsorbed on the column (q; in mmol) restricts
the comparison of data to a single column. For the results to be
comparable across different columns, it is beneficial to also present
them in a more generalized form. Coverage values given in units of
e.g. mmol/m3 of internal column volume, or mmol/m2 of available
stationary phase surface area, could be scaled with the column dimension, provided that the columns are identically packed with
the same stationary phase particles. Kifle et al. compared the results of an impregnation process on different columns, including C8
and C18 columns as well as two C18 columns with different surface
area [7]. This study clearly shows that the amount of adsorbed acid
(presented as mmol/g silica) is affected by both the hydrophobicity (length of the carbon chain) of the column material and by the
3
M.G. Sanku, K. Forsberg and M. Svärd
Journal of Chromatography A 1676 (2022) 463278
physical properties of the material such as surface area and pore
size. The results of a C18 column are hardly transferable to a C8 column, but more studies are required even to compare two C18 materials (of different pore size and surface area) and to know under
what conditions they are comparable. In the present study, since
only one type of column was used for all experiments, extractant
coverage is presented in terms of mmol adsorbed acid per entire
column. Corresponding values of mmol adsorbed acid per mmol of
carbon on the stationary phase surface (as estimated by the supplier) are given in Table A.1 and A.2 of the Appendix. The data can
be converted to other forms based on the information provided in
Section 2.2 according to Eq. (3). Since most literature data is only
presented in terms of mmol per entire column with little details
about the properties of the material used, in the introduction section, data reported in literature is presented in terms of mmol/m3
of internal column volume for crude comparison.
q
q
=
n
Vc ρ p aϕ
(3)
where n denotes the amount of C18 groups in the packed column
(in mmol), Vc the hollow column volume (in mL), and where ρ p
is the packing density (in g/mL), a the specific surface area (in
m2 /g), and ϕ the carbon content (in mmol C18 /m2 ) of the stationary phase.
Fig. 3. Experimental data and regressed exponential curves of the liquid-liquid solubility of HDEHP in ethanol-water solutions. Black and white symbols - experimental data; black line - regressed curve; pink bands - 95% confidence bands; solid
symbols – cloud points; hollow symbols – clear points; red triangle – maximum
feed concentration used for impregnation experiments.
2.4. REE separation
Two columns were prepared, with coverages of 0.5 mmol of
HDEHP and HEHEHP, respectively, according to the method described in Section 2.3.2, and evaluated for separation of eight REEs
(La, Ce, Nd, Pr, Sm, Gd, Dy and Y) under different elution conditions. Before each run, remaining traces of metals were initially removed from the column by eluting with 5 CVs of 5 M HNO3 solution, after which the column was conditioned with at least 5 CVs
of HNO3 solution of the same concentration as the elution solution.
A 50 μL sample of REE solution was then injected and elution was
performed under isocratic conditions for 30 min. A 10 min HNO3
gradient up to 5 M HNO3 was appended after the isocratic step to
ensure all REEs in the column were completely eluted. The HNO3
concentration was controlled using the quaternary pump by means
of mixing water with 2 M or 5 M HNO3 solution. The column and
solution temperatures were kept constant at 25 °C. A constant flow
rate of 1 mL/min was used throughout the experiments.
Fig. 4. Experimental data and regressed exponential curves of the liquid-liquid solubility of HEHEHP in ethanol-water solutions. Black and white symbols - experimental data; black line - regressed curve; pink bands - 95% confidence bands; solid
symbols – cloud points; hollow symbols – clear points; red triangle – maximum
feed concentration used for impregnation experiments.
3. Results and discussion
3.1. Validation of titration method
Table 1 shows the concentrations of HDEHP and HEHEHP obtained by titration (ct ) for solutions of known extractant concentrations (cf ) as well as for pure water and ethanol. Between 1 –
3 repeat analyses were carried out for each solution. Negligible
amounts of acid were detected in the pure solvents as expected.
The deviation between repeat experiments is consistently below
1.4%, indicating good reproducibility irrespective of differences in
concentration and extractant. However, the relative error with respect to the known concentration is generally higher (mean 4.8%,
ranging up to 13%). Most of the errors obtained are positive, and
a part of this can be attributed to the small but systematic error involved in using phenolphthalein as indicator. There is a trend
of larger relative errors obtained for lower acid concentrations, as
should be expected.
3.2. Column preparation
3.2.1. Solubility of organophosphorus compounds
The liquid-liquid solubility of HDEHP and HEHEHP in ethanolwater solutions is shown in Figs. 3 and 4 as sets of experimentally determined cloud- and clear points. The experimental data
has been regressed to fit an exponential function, Eq. (4), shown as
solid black lines in the graphs together with associated 95% confidence bands. The corresponding fitting parameters are given in
Table 2 together with goodness of fit values (R2 ).
cs = A · exp
4
x
B
+C
(4)
M.G. Sanku, K. Forsberg and M. Svärd
Journal of Chromatography A 1676 (2022) 463278
Table 1
Validation of the titration method against solutions of known concentration.
Calc.
Experiment 1
cf
(mmol)
ct
(mmol)
RE∗
(%)
ct
(mmol)
RE∗
(%)
HDEHP (24 mM)
HDEHP (60 mM)
HDEHP
(167 mM)
HDEHP
(239 mM)
HDEHP
(300 mM)
HDEHP
(525 mM)
0.213
0.213
1.494
0.225
0.24
1.623
6%
13%
9%
0.225
0.23
1.63
6%
8%
9%
4.269
4.263
<1%
4.275
<1%
5.394
5.54
3%
5.394
5.113
5%
5.395
<1%
<1%
HEHEHP
(21 mM)
HEHEHP
(83 mM)
HEHEHP
(207 mM)
0.214
0.235
10%
0.24
12%
<1%
0.858
0.903
5%
0.898
5%
<1%
4.288
2.144
2.144
2.144
4.463
2.153
2.2
2.178
4%
1%
3%
2%
2.223
2.218
2.203
4%
3%
3%
Water (per mL)
Ethanol (per mL)
0
0
0.0000025
0.0000288
Sample
∗
Relative error = 100 · |ct c−cf |
f
#
Deviation =
100
ct
(ct −ct )2
n
Experiment 2
Experiment 3
ct
(mmol)
RE∗
(%)
<1%
<1%
<1%
4.338
2%
2.169
0.0000038
0.0000163
1%
A
B
C
R2
0.00481 ± 0.00103
2.7·10−6 ± 1.1·10−6
10.9 ± 0.3
5.3 ± 0.2
−0.484 ± 0.042
−0.015 ± 0.014
0.99376
0.98445
10 CVs
30 CVs
Run 1
q
(mmol)
Run 2
q
(mmol)
0.18
1.81
0.17
1.39
0.08
1.82
0.23
1.41
Dev (%)
Run 1
q
(mmol)
Run 2
q
(mmol)
Dev (%)
41%
0%
14%
1%
0.2
1.07
0.18
1.27
0.15
1.59
0.18
1.3
15%
19%
1%
1%
Table 4
The effect of flow rate during the water wash step on the loss of adsorbed acid.
F (mL/min)
q
(mmol)∗
VH2O,1
(CVs) #
VH2O,2
(CVs)§
1
2
3
4
0.88
0.88
0.84
0.86
2.4
2.4
2.3
2.2
16.2
22.2
18.0
16.9
∗
Calculated by the direct method (Eq. (2)).
#
The amount of water required to reach an approximately flat detector signal (around 6 mins)
in Fig. 4.
§
The amount of water required until no more peaks can be observed in the zoomed-in detector
signal (calculated from the beginning of water wash).
Table 5
Langmuir isotherm parameters (Eq. (5)), together with standard errors and R2 .
HDEHP
HEHEHP
1.4%
<1%
<1%
where c̅t is the mean of the values obtained by repeated titration and n is the total number of measurements.
Table 3
Effect of amount of feed solution on the amount of acid retained in the column, estimated using the indirect method (Eq. (1)).
23 mM HDEHP
525 mM HDEHP
21 mM HEHEHP
207 mM HEHEHP
<1%
<1%
<1%
0.0000038
0.0000213
Table 2
Solubility regression parameters (Eq. (4)).
HDEHP
HEHEHP
Dev#
(%)
qmax (mmol)
K (mM−1 )
R2
2.3 ± 0.3
3.8 ± 0.7
0.0017 ± 3.6·10−4
0.0019 ± 4.8·10−4
0.98979
0.99512
5
M.G. Sanku, K. Forsberg and M. Svärd
Journal of Chromatography A 1676 (2022) 463278
did not lead to a statistically significant increase in the amount of
ligand retained in the column. It can thus be established that 10
CVs is a sufficient amount of feed solution, and this amount was
used in all subsequent experiments.
In total 38 column impregnation experiments (20 of which
have been analysed both by the direct and the indirect method),
consisting of several repeats using a range of feed concentrations of the two extractants, have been performed. The results in
terms of amount of extractant retained in the column are given
in Fig. 5. The amount of extractant retained in the column during
the impregnation step has been calculated by the indirect method
(Eq. (1)), and the amount of adsorbed extractant by the direct
method (Eq. (2)). The two sets of values are compared in Fig. 5. As
seen in the figure and Table 3, the values obtained by the indirect
method (Eq. (1)) show low repeatability, with a deviation between
repeat experiments as high as 33%. The variability is particularly
pronounced at higher concentrations, and for HDEHP (as shown
in Fig. 5). However, the values of the adsorbed amount obtained
by Eq. (2) show a high repeatability, with deviations between repeat experiments lower than 7% in all cases. There is a marked
difference between the sets of values obtained with the two methods, with adsorbed amount consistently lower than the amount retained during the feed step. This shows that a significant fraction
of the retained extractant is loosely bound to the column after the
impregnation step, and can be washed out with water. The large
difference between the values obtained with the two methods emphasizes that care must be exercised when using indirect methods to quantify the amount of extractant adsorbed during column
impregnation. At least, any indirect measurement method should
specifically account for extractant lost in the water wash step.
The influence of the flow rate of the water wash step has
been studied for column impregnation with a feed concentration
of 447 mM HDEHP. The final flow rate of the water wash step was
changed and the adsorbed acid on the column was measured by
the direct method (Eq. (2)) after 40 CVs of water wash. The results
of the changed flow rate, shown in Table 4, suggest that the flow
rate did not have any noticeable effect on the amount of adsorbed
acid for the range of flow rates and duration considered in these
studies. Additionally, the UV signal at 288 nm was used as a qualitative indication of the loss of acid during the water wash step. As
Fig. 5. The amount of organophosphorus acid retained in the column estimated
using the indirect method (Eq.. (1)) of titration of feed solutions (solid symbols)
and the direct method (Eq.. (2)) of titration of ethanol eluate after washing (hollow
symbols). Circles – HDEHP; triangles – HEHEHP. Error bars represent the propagated
error. The corresponding data is shown in Table A.1 and A.2 in the appendix.
In Eq. (4), cs is the solubility of the extractant, x is the proportion (in wt-%) of ethanol in the ethanol-water mixture (solvent
basis) and A, B and C are fitting parameters.
As can be seen from a comparison of Figs. 3 and 4, HDEHP has
higher solubility in aqueous ethanol solutions than HEHEHP, for all
evaluated compositions. Based on the measured solubilities, maximum concentration limits of HDEHP and HEHEHP feed solutions
were chosen (indicated by red diamonds in the graphs) as 0.75 and
0.26 mmol/g solvent mixture, respectively.
3.2.2. Column impregnation
Preliminary experiments were performed to investigate the
amount of feed solution required for the extractant adsorption to
reach equilibrium between the solid phase and the solution, shown
in Table 3. Increasing the amount of feed from 10 CVs to 30 CVs
Fig. 6. Loss of organophosphorus acid during the water wash step detected with an in-line UV detector. Black – Signal value (mAU); Red – Flow rate (mL/min). The data
shown corresponds to F = 2 mL/min in Table 4. Inset shows a magnified part of the detector signal.
6
M.G. Sanku, K. Forsberg and M. Svärd
Journal of Chromatography A 1676 (2022) 463278
extractant and should be investigated to analyse the need for column regeneration steps, which would affect the economic viability
of the process.
3.2.3. Adsorption isotherms
The experimentally determined values for the adsorbed amount
of extractant after water washing (Eq. (2)) are plotted vs. feed concentration in Fig. 7, for both extractants. For identical molar extractant concentrations in the feed, significantly more HEHEHP is
adsorbed compared to HDEHP. However, the solubility of HEHEHP
in a given ethanol-water solution is much lower than the solubility of HDEHP. Consequently, the maximum amount of extractant
that can be adsorbed on the column under the evaluated conditions (column properties, temperature and solvent composition)
is quite similar for both compounds (slightly more than 1 mmol,
corresponding to approximately 400 mol/m3 column or 0.6 mmol
acid/mmol C18 ). Nevertheless, the amount of extractant required in
the solution for a given coverage level is lower in case of HEHEHP
compared to HDEHP. The experimental data for both extractants is
well described by a Langmuir isotherm, Eq. (5), where q denotes
the amount adsorbed on the column, c the feed concentration, and
qmax (the maximum adsorbed amount) and K (the equilibrium constant) are parameters determined in the fit. The fitted isotherms
are shown in Fig. 7 with parameters given in Table 5.
Fig. 7. Column adsorption isotherms of HDEHP and HEHEHP at 25 °C. Symbols –
experimental data; lines – regressed Langmuir isotherms; pink bands - 95% confidence bands; circles – HDEHP; triangles – HEHEHP. Error bars represent the error
in experimental data calculated as shown in the Appendix. The corresponding data
is shown in Table A.1 and A.2 in the appendix.
q=
seen in Fig. 6, the loss of adsorbed acid occurs in two steps. First,
there is a period of significant loss of acid (in this case until about
6 mins) followed by a period of more subtle and intermittent loss
seen as peaks in the inset. The total number of CVs of water wash
required for these respective losses are noted in Table 4 for comparison. Again, the effect of flow rate was negligible. For all feed
concentrations between 80 and 500 mM, for both extractants, repeat experiments were carried out using different amounts of water, in the range 20 – 50 CVs. In all cases, increasing the amount
of water in the wash step did not lead to a detectable change in
the amount of extractant adsorbed. This shows that any loss of
loosely bound extractant occurring after the initial loss did not significantly affect the adsorbed acid amount. However, long term exposure, e.g. over several months, might lead to a significant loss of
qmax Kc
1 + Kc
(5)
3.3. REE separation
For the columns used for separation experiments, the amount
of adsorbed extractant was found to be 0.52 and 0.56 mmol of
HDEHP and HEHEHP, respectively, as obtained after titration of
ethanol elution. Fig. 8 shows chromatograms obtained in three REE
separation experiments. On the HDEHP column, isocratic elution
using 0.12 M of nitric acid solution as eluent led to visible separation of the lighter REEs (La, Ce, Pr and Nd) while the middle
to heavy REEs (Sm, Gd, Dy and Y) could be separated using gradient elution, in well separated peaks over the approximate nitric
Fig. 8. Chromatograms showing separation of REE using a C18 column functionalized with 0.5 mmol of HDEHP (top) and HEHEHP (middle and bottom), with 30 min isocratic
elution at the concentration specified in the legend followed by 10 min gradient elution to 5 M HNO3 (elution profiles shown as black lines on second axis).
7
M.G. Sanku, K. Forsberg and M. Svärd
Journal of Chromatography A 1676 (2022) 463278
acid concentration range 1 – 3 M. On the HEHEHP column, isocratic elution at an HNO3 concentration of 0.12 M led to co-elution
of La, Ce, Pr and Nd as one peak. Sm eluted directly following the
peak of the light REEs, with Gd following. The heavy REEs (Dy and
Y) remained to be eluted by gradient elution (at approx. 2 – 3 M
HNO3 ). A significantly lower HNO3 concentration of 0.05 M during
the isocratic stage provided for a much better separation of the
lighter REEs on the HEHEHP column, and also resulted in Sm and
Gd being retained in the column until the gradient step.
Overall, the results show that RP-HPLC columns with either
HDEHP or HEHEHP as adsorbed extractants, prepared using the
method described in this work, can be used for separation of REEs.
It should be noted that these chromatographic experiments are not
optimized for either resolution or productivity. Proper optimization
is a major undertaking, and would require a substantial amount
of experimental data, and – for preparative chromatographic
purposes – significantly increased sample loads into the so-called
overloaded range.
It is interesting to compare the performance of the two extractants for REE separation, relative to each other in a chromatographic process, and relative to their reported performance in
solvent extraction. This has been studied for analytical application
by Horwitz et al. [10] using a chromatographic setup where extractant is adsorbed on large (50–100 μm) polymer beads and slurrypacked in glass column, and where REEs are eluted by gravityinduced flow. In their comparison, the selectivities of the extractants was shown to be virtually identical for the two techniques.
HDEHP (pKa = 3.24) [23] is known to be an efficient extractant
for the separation of REEs in traditional solvent extraction, but the
difficulty in stripping the loaded metals leads to a limited use for
extraction of heavy REEs. HEHEHP (pKa = 4.51) [23] has a somewhat lower affinity for REE overall, but compensates with a somewhat increased selectivity, and allows stripping of REEs at lower
acid concentrations [6,24,25]. For the HPLC-type process used in
the present work, a comparison of the extractants (Fig. 8) adsorbed
at approximately equal molar coverage levels shows that elution
with comparable separation can be achieved at significantly lower
acidity for HEHEHP compared to HDEHP, mirroring their solvent
extraction behaviour. A reduced HNO3 consumption would be beneficial in an industrial process [6,26].
It is also shown that a significant and variable amount of the
extractant is loosely bound to the column and readily removed by
water in a subsequent washing step. A significant loss of extractant
is shown to occur at the beginning of the washing step (requiring
in total about 2.4 CVs of water) with subsequent loss being intermittent and lasting for approx. 16–23 CVs. Additional washing did
not show a detectable difference in the amount of extractant adsorbed on the column. The influence of the flow rate during the
washing step was found to be negligible. Overall, this stresses the
importance of basing the estimation of the amount of extractant
adsorbed on the column on data obtained after washing with sufficient amounts of water. It should be mentioned that phenomena
such as pore dewetting and phase collapse [27], which constitute
potential problems for scale-up of chromatographic processes, have
not been studied specifically in this work, and should be investigated in more detail.
Funding sources
This work was carried out within the REEform project, for
which the authors gratefully acknowledge funding by Formas
(grant no. 2019–01150).
Declaration of Competing Interest
The authors declare that they have no known competing financial interests or personal relationships that could have appeared to
influence the work reported in this paper.
CRediT authorship contribution statement
Meher G. Sanku: Formal analysis, Investigation, Methodology,
Validation, Writing – original draft, Writing – review & editing. Kerstin Forsberg: Conceptualization, Funding acquisition, Supervision, Writing – original draft, Writing – review & editing.
Michael Svärd: Conceptualization, Funding acquisition, Methodology, Project administration, Supervision, Writing – original draft,
Writing – review & editing.
Acknowledgement
Nouryon Pulp and Performance Chemicals, Bohus, Sweden, are
gratefully acknowledged for supplying Kromasil C18 columns.
4. Conclusions
Supplementary materials
A process has been developed for reliably preparing an RP-HPLC
column with organophosphorus acid extractants by physisorption
through impregnation by elution with aqueous alcoholic solutions,
as demonstrated for HDEHP and HEHEHP. By making use of the
solubility curves and adsorption isotherms, appropriate feed concentrations can be obtained, allowing columns with a required extractant concentration to be prepared. The resulting columns containing either HDEHP or HEHEHP as adsorbed extractants, prepared
using the method described in this work, are verified to be able to
separate the REEs in mixture of eight elements using a combined
isocratic and gradient elution with nitric acid.
The solubility of both extractants increases non-linearly with
ethanol content in the solvent mixture, with the solubility of
HEHEHP in any given solvent composition being lower than
HDEHP. For solutions of equal extractant concentrations, however,
the amount of extractant adsorbed on the column at equilibrium is
significantly higher for HEHEHP than for HDEHP. This indicates that
a lower extractant consumption is required for HEHEHP compared
to HDEHP, in order to reach the same coverage on the column. It
is established that elution with 10 CVs of feed solution is sufficient
to reach equilibrium with respect to the adsorbed amount of extractant.
Supplementary material associated with this article can be
found, in the online version, at doi:10.1016/j.chroma.2022.463278.
References
[1] D.R. McAlister, E.P. Horwitz, Characterization of extraction of chromatographic materials containing bis(2-ethyl-1-hexyl)phosphoric acid, 2-ethyl1-hexyl (2-ethyl-1-hexyl) phosphonic acid, and bis(2,4,4-trimethyl-1pentyl)phosphinic acid, Solvent Extr. Ion Exch. 25 (6) (2007) 757–769,
doi:10.1080/07366290701634594.
[2] I. Akaza, Correlation between extraction chromatography and liquid-liquid
extraction, J. Chromatogr. Lib. 2 (1975) 17–44, doi:10.1016/S0301-4770(08)
60968-9.
[3] M. Max-Hansen, Modeling and Optimization of Rare Earth Element Chromatography, Lund University, Faculty of Engineering, Dept. Chemical Engineering, 2014.
[4] M. Max-Hansen, F. Ojala, D. Kifle, N. Borg, B. Nilsson, Optimization of preparative chromatographic separation of multiple rare earth elements, J. Chromatogr. A 1218 (51) (2011) 9155–9161, doi:10.1016/j.chroma.2011.10.062.
[5] H.-.K. Knutson, M. Max-Hansen, C. Jönsson, N. Borg, B. Nilsson, Experimental productivity rate optimization of rare earth element separation through
preparative solid phase extraction chromatography, J. Chromatogr. A 1348
(2014) 47–51, doi:10.1016/j.chroma.2014.04.085.
[6] F. Xie, T.A. Zhang, D. Dreisinger, F. Doyle, A critical review on solvent extraction
of rare earths from aqueous solutions, Miner. Eng. 56 (2014) 10–28, doi:10.
1016/j.mineng.2013.10.021.
8
M.G. Sanku, K. Forsberg and M. Svärd
Journal of Chromatography A 1676 (2022) 463278
[7] D. Kifle, G. Wibetoe, M. Frøseth, J. Bigelius, Impregnation and characterization
of high performance extraction columns for separation of metal ions, Solvent
Extr. Ion Exch. 31 (6) (2013) 668–682, doi:10.1080/07366299.2013.806737.
[8] H. Schmidt-Traub, M. Schulte, A. Seidel-Morgenstern, Preparative Chromatography, Wiley-VCH, 2012 second edition.
[9] N. Sivaraman, R. Kumar, S. Subramaniam, P.R. Vasudeva Rao, Separation of lanthanides using ion-interaction chromatography with HDEHP coated columns, J.
Radioanal. Nucl. Chem. 252 (3) (2002) 491–495, doi:10.1023/A:1015894418606.
[10] E.P. Horwitz, D.R. McAlister, M.L. Dietz, Extraction chromatography versus solvent extraction: how similar are they? Sep. Sci. Technol. 41 (10) (2006) 2163–
2182, doi:10.1080/01496390600742849.
[11] T.B. Pierce, R.S. Hobbs, The separation of the rare earths by partition chromatography with reversed phases: part I. Behaviour of column material, J.
Chromatogr. A 12 (1963) 74–80, doi:10.1016/S0021-9673(01)83648-7.
[12] S. Watanabe, I. Goto, K. Nomura, Y. Sano, Y. Koma, Extraction chromatography experiments on repeated operation using engineering scale column system, Energy Procedia 7 (2011) 449–453, doi:10.1016/j.egypro.2011.06.060.
[13] M. Ramzan, D. Kifle, G. Wibetoe, Comparative study of stationary phases impregnated with acidic organophosphorus extractants for HPLC separation of
rare earth elements, Sep. Sci. Technol. 51 (3) (2016) 494–501, doi:10.1080/
01496395.2015.1112400.
[14] M. Husain, S.A. Ansari, P.K. Mohapatra, R.K. Gupta, V.S. Parmar, V.K. Manchanda, Extraction chromatography of lanthanides using N,N,N ,N -tetraoctyl
diglycolamide (TODGA) as the stationary phase, Desalination 229 (1) (2008)
294–301, doi:10.1016/j.desal.2007.10.016.
[15] W.A. Abbasi, M. Streat, Sorption of uranium from nitric acid solution using
TBP-impregnated activated carbons, Solvent Extr. Ion Exch. 16 (5) (1998) 1303–
1320, doi:10.1080/07360299808934581.
[16] N. Schaeffer, S.M. Grimes, C.R. Cheeseman, Use of extraction chromatography
in the recycling of critical metals from thin film leach solutions, Inorg. Chim.
Acta 457 (2017) 53–58, doi:10.1016/j.ica.2016.11.020.
[17] T.B. Pierce, P.F. Peck, R.S. Hobbs, The separation of the rare earths by partition chromatography with reversed phases: part II. Behaviour of individual elements on HDEHP-CORVIC columns, J. Chromatogr. A 12 (1963) 81–88,
doi:10.1016/S0021-9673(01)83649-9.
[18] S. Siekierski, R.J. Sochacka, Reversed-phase partition chromatography with di(2-ethylhexyl) orthophosphoric acid as the stationary phase: part II. Factors
affecting the height of the plate, J. Chromatogr. A 16 (1964) 385–395, doi:10.
1016/S0021-9673(01)82502-4.
[19] P.G. Jaison, P. Kumar, V.M. Telmore, S.K. Aggarwal, Comparative study of ion
interaction reagents for the separation of lanthanides by reversed-phase high
performance liquid chromatography (RP-HPLC), J. Liq. Chromatogr. Related
Technol. 32 (15) (2009) 2146–2163, doi:10.1080/10826070903163230.
[20] M.G. Sanku, K. Forsberg, M. Svärd, Extraction chromatography for separation of
rare earth elements, in: Rare Metal Technology 2021 - Proceedings of the TMS
Annual Meeting & Exhibition, 2021, pp. 155–161.
[21] M. Ramzan, D. Kifle, G. Wibetoe, A rapid impregnation method for loading desired amounts of extractant on prepacked reversed-phase columns for high
performance liquid chromatographic separation of metal ions, J. Chromatogr.
A 1500 (2017) 76–83, doi:10.1016/j.chroma.2017.04.005.
˚
[22] M. Alemrajabi, A.C.
Rasmuson, K. Korkmaz, K. Forsberg, Recovery of rare earth
elements from nitrophosphoric acid solutions, Hydrometallurgy 169 (2017)
253–262, doi:10.1016/j.hydromet.2017.01.008.
[23] Z. Zhang, Q. Jia, W. Liao, Progress in the separation processes for rare earth
resources J.-C.G. Bünzli, V.K. Pecharsky (Eds.), Handbook On the Physics and
Chemistry of Rare Earths, 48, Elsevier, North-Holland, 2015.
[24] X. Luo, X. Huang, Z. Zhu, Z. Long, Y. Liu, Synergistic extraction of cerium from
sulfuric acid medium using mixture of 2-ethylhexyl phosphonic acid mono 2ethylhexyl ester and Di-(2-ethyl hexyl) phosphoric acid as extractant, J. Rare
Earths 27 (1) (2009) 119–122, doi:10.1016/S1002- 0721(08)60204- 5.
[25] C. Zhang, L. Wang, X. Huang, J. Dong, Z. Long, Y. Zhang, Yttrium extraction
from chloride solution with a synergistic system of 2-ethylhexyl phosphonic acid mono-(2-ethylhexyl) ester and bis(2,4,4-trimethylpentyl) phosphinic
acid, Hydrometallurgy 147-148 (2014) 7–12, doi:10.1016/j.hydromet.2014.
04.008.
[26] N.V. Thakur, Separation of rare earths by solvent extraction, Miner. Process.
Extr. Metall. Rev. 21 (1–5) (20 0 0) 277–306, doi:10.1080/0882750 0 0 08914171.
[27] R. Majors, M. Przybyciel, Phase collapse in reversed-phase liquid chromatography, LCGC North America 20 (6) (2002).
9