World Economic Outlook Slowing Growth, Rising Risks pdf
Bạn đang xem bản rút gọn của tài liệu. Xem và tải ngay bản đầy đủ của tài liệu tại đây (7.23 MB, 241 trang )
World Economic Outlook, September 2011
World Economic Outlook
Slowing Growth, Rising Risks
World Economic Outlook
Slowing Growth, Rising Risks
World Economic and Financial Surveys
INTERNATIONAL MONETARY FUND
11
SEP
IMF
SEP
11
WORLD ECONOMIC OUTLOOK
September 2011
Slowing Growth, Rising Risks
International Monetary Fund
World Economic and Financial Surveys
©2011 International Monetary Fund
Cover and Design: Luisa Menjivar and Jorge Salazar
Composition: Maryland Composition
Cataloging-in-Publication Data
World economic outlook (International Monetary Fund)
World economic outlook : a survey by the staff of the International Monetary Fund. —
Washington, DC : International Monetary Fund, 1980–
v. ; 28 cm. — (1981–1984: Occasional paper / International Monetary Fund, 0251-6365).
— (1986– : World economic and financial surveys, 0256-6877)
Semiannual. Some issues also have thematic titles.
Has occasional updates, 1984–
1. Economic development — Periodicals. 2. Economic forecasting — Periodicals.
3. Economic policy — Periodicals. 4. International economic relations — Periodicals.
I. International Monetary Fund. II. Series: Occasional paper (International Monetary Fund).
III. Series: World economic and financial surveys.
HC10.80
ISBN 978-1-61635-119-9
Please send orders to:
International Monetary Fund, Publication Services
P.O. Box 92780, Washington, D.C. 20090, U.S.A.
Tel.: (202) 623-7430 Fax: (202) 623-7201
E-mail:
www.imfbookstore.org
International Monetary Fund | September 2011 iii
Assumptions and Conventions ix
Further Information and Data x
Preface xi
Foreword xiii
Executive Summary xv
Chapter 1. Global Prospects and Policies 1
Slowing Global Activity 1
Renewed Financial Instability 1
More Uneven Expansion 3
Economic Slack alongside Signs of Overheating 9
Risks Are Clearly to the Downside 11
Policy Challenges 19
National Perspectives on Policy Challenges 19
Multilateral Perspectives on Policy Challenges 27
Appendix 1.1. Commodity Market Developments and Prospects 32
References 66
Chapter 2. Country and Regional Perspectives 71
e United States: Weakening Again amid Daunting Debt Challenges 72
Europe: Enduring Economic and Financial Turbulence 76
Commonwealth of Independent States: Moderate Growth Performance 80
Asia: Securing a More Balanced Expansion 84
Latin America and the Caribbean: Moving toward More Sustainable Growth 88
Sub-Saharan Africa: Sustaining the Expansion 92
Middle East and North Africa: Growth Stalling amid Uncertainty 96
References 99
Chapter 3. Target What You Can Hit: Commodity Price Swings and Monetary Policy 101
Commodity Price Swings and Ination 104
Monetary Policy and Food Price Shocks: A Simulation-Based Perspective 110
Policy Implications for Responding to Commodity Price Shocks 118
Appendix 3.1. Economies in the Data Set 122
Appendix 3.2. Technical Appendix 122
References 132
CONTENTS
WORLD ECONOMIC OUTLOOK: SLOWING GROWTH, RISING RISKS
iv International Monetary Fund | September 2011
Chapter 4. Separated at Birth? The Twin Budget and Trade Balances 135
Estimating the Strength of the Twin Decits Link 137
Insights from Model-Based Simulations 145
Summary and Implications for the Outlook 151
Appendix 4.1 Data Construction and Sources 152
Appendix 4.2 Statistical Methodology, Robustness Checks, and Selected Additional
Results on Export and Import Responses 153
Appendix 4.3 Global Integrated Monetary and Fiscal Model (GIMF) 156
References 159
Annex: IMF Executive Board Discussion of the Outlook, August 2011 161
Statistical Appendix 163
Assumptions 163
What’s New 164
Data and Conventions 164
Classication of Countries 165
General Features and Composition of Groups in the World Economic Outlook Classication 165
Table A. Classication by World Economic Outlook Groups and eir Shares
in Aggregate GDP, Exports of Goods and Services, and Population, 2010 167
Table B. Advanced Economies by Subgroup 168
Table C. European Union 168
Table D. Emerging and Developing Economies by Region and Main Source
of Export Earnings 169
Table E. Emerging and Developing Economies by Region, Net External Position,
and Status as Heavily Indebted Poor Countries 170
Box A1. Economic Policy Assumptions Underlying the Projections for Selected Economies 172
List of Tables 177
Output (Tables A1–A4) 178
Ination (Tables A5–A7) 186
Financial Policies (Table A8) 192
Foreign Trade (Table A9) 193
Current Account Transactions (Tables A10–A12) 195
Balance of Payments and External Financing (Tables A13–A15) 202
Flow of Funds (Table A16) 206
Medium-Term Baseline Scenario (Table A17) 210
World Economic Outlook, Selected Topics 211
Boxes
Box 1.1. Slow Recovery to Nowhere? A Sectoral View of Labor Markets in Advanced Economies 41
Box 1.2. Credit Boom-Bust Cycles: eir Triggers and Policy Implications 47
Box 1.3. Are Equity Price Drops Harbingers of Recession? 51
Box 1.4. Financial Investment, Speculation, and Commodity Prices 56
Box 1.5. External Liabilities and Crisis Tipping Points 61
Box 3.1. Ination in Sub-Saharan Africa during the 2008 Commodity Price Surge 125
Box 3.2. Food Price Swings and Monetary Policy in Open Economies 130
Box A1. Economic Policy Assumptions Underlying the Projections for Selected Economies 172
CONTENTS
International Monetary Fund | September 2011 v
CONTENTS
Tables
Table 1.1. Overview of the World Economic Outlook Projections 2
Table 1.2. Global Oil Demand and Production by Region 35
Table 1.2.1. What Triggers Credit Booms? 49
Table 1.3.1. Summary Statistics for Real Equity Price Growth 51
Table 1.3.2. Predicting New Recessions with Financial Market Variables 53
Table 1.5.1. Probit Estimates of Crisis Probability 63
Table 1.5.2. Model’s Predictive Power 64
Table 2.1. Selected Advanced Economies: Real GDP, Consumer Prices, Current Account
Balance, and Unemployment 75
Table 2.2. Selected European Economies: Real GDP, Consumer Prices, Current Account
Balance, and Unemployment 78
Table 2.3. Commonwealth of Independent States: Real GDP, Consumer Prices, Current
Account Balance, and Unemployment 83
Table 2.4. Selected Asian Economies: Real GDP, Consumer Prices, Current Account Balance,
and Unemployment 85
Table 2.5. Selected Western Hemisphere Economies: Real GDP, Consumer Prices, Current
Account Balance, and Unemployment 91
Table 2.6. Selected Sub-Saharan African Economies: Real GDP, Consumer Prices, Current
Account Balance, and Unemployment 95
Table 2.7. Selected Middle East and North African Economies: Real GDP, Consumer Prices,
Current Account Balance, and Unemployment 99
Table 3.1. Gasoline Pass-through from Oil Prices 107
Table 3.2. Flour and Bread Pass-through from Wheat Prices 107
Table 3.1.1. Variations in Ination: Sub-Saharan Africa 127
Table 3.1.2. Food Ination Dynamics 128
Table 3.1.3. Ination Dynamics 129
Table 3.1.4. Macroeconomics Environment: Sub-Saharan Africa 129
Table 4.1. Data Sources 152
Table A1. Summary of World Output 178
Table A2. Advanced Economies: Real GDP and Total Domestic Demand 179
Table A3. Advanced Economies: Components of Real GDP 180
Table A4. Emerging and Developing Economies by Country: Real GDP 182
Table A5. Summary of Ination 186
Table A6. Advanced Economies: Consumer Prices 187
Table A7. Emerging and Developing Economies: Consumer Prices 188
Table A8. Major Advanced Economies: General Government Fiscal Balances and Debt 192
Table A9. Summary of World Trade Volumes and Prices 193
Table A10. Summary of Balances on Current Account 195
Table A11. Advanced Economies: Balance on Current Account 197
Table A12. Emerging and Developing Economies: Balance on Current Account 198
Table A13. Emerging and Developing Economies: Net Financial Flows 202
Table A14. Emerging and Developing Economies: Private Financial Flows 203
Table A15. Emerging and Developing Economies: Reserves 204
Table A16. Summary of Sources and Uses of World Savings 206
Table A17. Summary of Word Medium-Term Baseline Scenario 210
WORLD ECONOMIC OUTLOOK: SLOWING GROWTH, RISING RISKS
vi International Monetary Fund | September 2011
Online Tables
Table B1. Advanced Economies: Unemployment, Employment, and Real per Capita GDP
Table B2. Emerging and Developing Economies: Real GDP
Table B3. Advanced Economies: Hourly Earnings, Productivity, and Unit Labor Costs
in Manufacturing
Table B4. Emerging and Developing Economies: Consumer Prices
Table B5. Summary of Financial Indicators
Table B6. Advanced Economies: General and Central Government Net Lending/Borrowing
and Excluding Social Security Schemes
Table B7. Advanced Economies: General Government Structural Balances
Table B8. Advanced Economies: Exchange Rates
Table B9. Emerging and Developing Economies: General Government Net Lending/Borrowing
and Overall Fiscal Balance
Table B10. Emerging and Developing Economies: Broad Money Aggregates
Table B11. Advanced Economies: Export Volumes, Import Volumes, and Terms of Trade
in Goods and Services
Table B12. Emerging and Developing Economies by Region: Total Trade in Goods
Table B13. Emerging and Developing Economies by Source of Export Earnings:
Total Trade in Goods
Table B14. Advanced Economies: Current Account Transactions
Table B15. Emerging and Developing Economies: Balances on Current Account
Table B16. Emerging and Developing Economies by Region: Current Account Transactions
Table B17. Emerging and Developing Economies by Analytical Criteria:
Current Account Transactions
Table B18. Summary of Balance of Payments, Financial Flows, and External Financing
Table B19. Emerging and Developing Economies by Region: Balance of Payments
and External Financing
Table B20. Emerging and Developing Economies by Analytical Criteria: Balance of Payments
and External Financing
Table B21. Summary of External Debt and Debt Service
Table B22. Emerging and Developing Economies by Region: External Debt by Maturity
and Type of Creditor
Table B23. Emerging and Developing Economies by Analytical Criteria: External Debt,
by Maturity and Type of Creditor
Table B24. Emerging and Developing Economies: Ratio of External Debt to GDP
Table B25. Emerging and Developing Economies: Debt-Service Ratios
Table B26. Emerging and Developing Economies, Medium-Term Baseline Scenario:
Selected Economic Indicators
Figures
Figure 1.1. Global Indicators 3
Figure 1.2. Financial Strains in Europe and the United States 4
Figure 1.3. Recent Financial Market Developments 5
Figure 1.4. Prospects for Near-Term Activity 6
Figure 1.5. Global Outlook 7
Figure 1.6. Current and Forward-Looking Growth Indicators 8
Figure 1.7. Balance Sheets and Saving Rates 9
CONTENTS
International Monetary Fund | September 2011 vii
CONTENTS
Figure 1.8. Emerging Market Conditions 10
Figure 1.9. Emerging Market Economies with Strong Credit Expansion 11
Figure 1.10. Measures of Monetary Policy and Liquidity in Selected Advanced
and Emerging Market Economies 12
Figure 1.11. General Government Fiscal Balances and Public Debt 13
Figure 1.12. Cyclical Conditions 14
Figure 1.13. Global Projection Model Estimates of the Output Gap 15
Figure 1.14. Global Ination 16
Figure 1.15. Risks to the Global Outlook 17
Figure 1.16. WEO Downside Scenario 18
Figure 1.17. Overheating Indicators for the G20 Economies 22
Figure 1.18. Policy Requirements in Emerging Market Economies 23
Figure 1.19. External Developments 24
Figure 1.20. Global Imbalances 25
Figure 1.21. Employment and Unemployment 26
Figure 1.22. Drivers of Global Growth and Rebalancing 29
Figure 1.23. Commodity Prices 33
Figure 1.24. World Energy Market Developments 34
Figure 1.25. Developments in Base Metal Markets 38
Figure 1.26. Recent Developments in Markets for Major Food Crops 39
Figure 1.1.1. Trends in Employment and Labor Productivity 42
Figure 1.1.2. Sectoral Trends May Aect Potential Output Growth 44
Figure 1.1.3. Employment, Prots, and Intermediate Goods Trade in the United States 45
Figure 1.2.1. Credit Booms 47
Figure 1.3.1. Predicted Probability of a New Recession in a Quarter 54
Figure 1.4.1. Commodity Market Financialization 57
Figure 1.4.2. Commodity Price Volatility, 1990–2011 57
Figure 1.4.3. Commodity Futures Risk Premiums 59
Figure 1.5.1. Net Foreign Asset Indicators in the Run-up to External Crises 61
Figure 1.5.2. Model Estimate of Crisis Probabilities 64
Figure 2.1. Current Global Growth versus Precrisis Average 71
Figure 2.2. Output Gaps and Ination 72
Figure 2.3. United States and Canada: Current Growth versus Precrisis Average 73
Figure 2.4. United States: Struggling to Gain a Foothold 74
Figure 2.5. Europe: Current Growth versus Precrisis Average 77
Figure 2.6. Europe: An Uneven Performance and Elevated Risks 79
Figure 2.7. Commonwealth of Independent States: Current Growth versus Precrisis Average 81
Figure 2.8. Commonwealth of Independent States: A Gradual Recovery 82
Figure 2.9. Asia: Current Growth versus Precrisis Average 84
Figure 2.10. Asia: A Bright Spot in the World Economy 86
Figure 2.11. Latin America and the Caribbean: Current Growth versus Precrisis Average 89
Figure 2.12. Latin America: Maintaining the Growth Momentum 90
Figure 2.13. Sub-Saharan Africa: Current Growth versus Precrisis Average 93
Figure 2.14. Sub-Saharan Africa: Continued Strength 94
Figure 2.15. Middle East and North Africa: Current Growth versus Precrisis Average 97
Figure 2.16. Middle East and North Africa: Weakening Activity in an Uncertain Environment 98
Figure 3.1. World Commodity Prices, 2000–11 102
WORLD ECONOMIC OUTLOOK: SLOWING GROWTH, RISING RISKS
viii International Monetary Fund | September 2011
Figure 3.2. World Commodity Prices, 1957–2011 104
Figure 3.3. Food Price Forecasts 105
Figure 3.4. Pass-through from World Ination to Domestic Ination 106
Figure 3.5. Variability of Real Domestic Prices 108
Figure 3.6. Share of Food in the Consumption Basket 109
Figure 3.7. Contribution of Food and Transportation to Headline Ination 110
Figure 3.8. Response of Ination Expectations to Ination Surprises 111
Figure 3.9. Pass-through from International to Domestic Food Price Ination 112
Figure 3.10. Response to a Food Price Shock in a Stylized Emerging and Developing Economy 115
Figure 3.11. Ination-Output Policy Frontier 116
Figure 3.12. Response to a Food Price Shock in a Stylized High-Credibility Emerging
and Developing Economy 117
Figure 3.13. Response to a Food Price Shock in a Stylized Advanced Economy 118
Figure 3.14. One-Time versus Persistent Food Price Shocks 119
Figure 3.15. Response to a Food Price Shock amid Current Cyclical Conditions 120
Figure 3.1.1. Income and Food Share in Sub-Saharan Africa 125
Figure 3.1.2. Changes in Ination in Sub-Saharan Africa, 2007–08 126
Figure 3.1.3. Rice Price, Madagascar 127
Figure 3.2.1. Net Commodity Exporters, 2000–10 130
Figure 3.2.2. Net Commodity Importers, 2000–10 131
Figure 4.1. Incidence of Action-Based Fiscal Policy Changes by Year 139
Figure 4.2. Eects on the Current Account of a 1 Percent of GDP Fiscal Consolidation 141
Figure 4.3. Eects on Economic Activity of a 1 Percent of GDP Fiscal Consolidation 142
Figure 4.4. Eects on Saving and Investment of a 1 Percent of GDP Fiscal Consolidation 143
Figure 4.5. Eects on the Composition of Saving and Investment of a 1 Percent of GDP
Fiscal Consolidation 144
Figure 4.6. Eects on Export and Import Volumes of a 1 Percent of GDP Fiscal Consolidation 145
Figure 4.7. Eects on Exchange Rates, Prices, and Interest Rates of a 1 Percent of GDP
Fiscal Consolidation 146
Figure 4.8. Eects of a 1 Percent of GDP Fiscal Consolidation under Pegged
and Nonpegged Exchange Rate Regimes 147
Figure 4.9. Eects of a 1 Percent of GDP Fiscal Consolidation under Constrained Monetary
Policy: GIMF Simulations 148
Figure 4.10. Eects of a Synchronized Global 1 Percent of GDP Fiscal Consolidation:
GIMF Simulations 149
Figure 4.11. Planned Fiscal Adjustment and the Current Account Impact: GIMF Simulations 150
Figure 4.12. Robustness: Eects on the Current Account of a 1 Percent of GDP
Fiscal Consolidation 155
Figure 4.13. Eects on the Current Account of a 1 Percent of GDP Fiscal Policy Change 156
Figure 4.14. Fiscal Instruments and eir Eects on the Current Account 158
International Monetary Fund | September 2011 ix
A number of assumptions have been adopted for the projections presented in the World Economic Outlook. It
has been assumed that real eective exchange rates remained constant at their average levels during July 18–August
15, 2011, except for the currencies participating in the European exchange rate mechanism II (ERM II), which are
assumed to have remained constant in nominal terms relative to the euro; that established policies of national authori-
ties will be maintained (for specic assumptions about scal and monetary policies for selected economies, see Box
A1 in the Statistical Appendix); that the average price of oil will be $103.20 a barrel in 2011 and $100.00 a barrel in
2012 and will remain unchanged in real terms over the medium term; that the six-month London interbank oered
rate (LIBOR) on U.S. dollar deposits will average 0.4 percent in 2011 and 0.5 percent in 2012; that the three-month
euro deposit rate will average 1.3 percent in 2011 and 1.2 percent in 2012; and that the six-month Japanese yen
deposit rate will yield on average 0.5 percent in 2011 and 0.3 percent in 2012. ese are, of course, working hypoth-
eses rather than forecasts, and the uncertainties surrounding them add to the margin of error that would in any event
be involved in the projections. e estimates and projections are based on statistical information available through
early September 2011.
e following conventions are used throughout the World Economic Outlook:
. . . to indicate that data are not available or not applicable;
– between years or months (for example, 2010–11 or January–June) to indicate the years or months
covered, including the beginning and ending years or months;
/ between years or months (for example, 2010/11) to indicate a scal or nancial year.
“Billion” means a thousand million; “trillion” means a thousand billion.
“Basis points” refer to hundredths of 1 percentage point (for example, 25 basis points are equivalent to ¼ of
1 percentage point).
Data for Estonia are now included in the aggregates for the euro area and advanced economies.
As in the April 2011 World Economic Outlook, WEO aggregated data exclude Libya for the projection years
due to the uncertain political situation.
Starting with the September 2011 World Economic Outlook, Guyana and Suriname are classied as members
of the South America region and Belize as a member of the Central America region. Previously, they were
members of the Caribbean region.
For Sudan, the projections for 2011 and later exclude South Sudan.
In gures and tables, shaded areas indicate IMF sta projections.
If no source is listed on tables and gures, data are drawn from the WEO database.
When countries are not listed alphabetically, they are ordered on the basis of economic size.
Minor discrepancies between sums of constituent gures and totals shown reect rounding.
As used in this report, the terms “country” and “economy” do not in all cases refer to a territorial entity that
is a state as understood by international law and practice. As used here, the term also covers some territorial
entities that are not states but for which statistical data are maintained on a separate and independent basis.
Composite data are provided for various groups of countries organized according to economic characteris-
tics or region. Unless otherwise noted, country group composites represent calculations based on 90 percent or
more of the weighted group data.
e boundaries, colors, denominations, and any other information shown on the maps do not imply, on
the part of the International Monetary Fund, any judgment on the legal status of any territory or any endorse-
ment or acceptance of such boundaries.
ASSUMPTIONS AND CONVENTIONS
WORLD ECONOMIC OUTLOOK: TENSIONS FROM THE T WOSPEED RECOVERY
x International Monetary Fund | September 2011
FURTHER INFORMATION AND DATA
is version of the World Economic Outlook is available in full on the IMF’s website, www.imf.org. Accom-
panying it on the website is a larger compilation of data from the WEO database than is included in the
report itself, including les containing the series most frequently requested by readers. ese les may be
downloaded for use in a variety of software packages.
e data appearing in the World Economic Outlook are compiled by the IMF sta at the time of the WEO
exercises. e historical data and projections are based on the information gathered by the IMF country
desk ocers in the context of their missions to IMF member countries and through their ongoing analysis
of the evolving situation in each country. Historical data are updated on a continual basis, as more informa-
tion becomes available, and structural breaks in data are often adjusted to produce smooth series with the use
of splicing and other techniques. IMF sta estimates continue to serve as proxies for historical series when
complete information is unavailable. As a result, WEO data can dier from other sources with ocial data,
including the IMF’s International Financial Statistics.
e WEO data and metadata provided are “as is” and “as available,” and every eort is made to ensure, but
not guarantee, their timeliness, accuracy, and completeness. When errors are discovered, there is a concerted
eort to correct them as appropriate and feasible. For details on the terms and conditions for usage of the
WEO database, please refer to the IMF Copyright and Usage website, />Inquiries about the content of the World Economic Outlook and the WEO database should be sent by mail,
forum, or fax (telephone inquiries cannot be accepted) to
World Economic Studies Division
Research Department
International Monetary Fund
700 19th Street, N.W.
Washington, D.C. 20431, U.S.A.
Forum address: www.imf.org/weoforum
Fax: (202) 623-6343
FURTHER INFORMATION AND DATA
International Monetary Fund | September 2011 xi
e analysis and projections contained in the World Economic Outlook are integral elements of the IMF’s
surveillance of economic developments and policies in its member countries, of developments in international
nancial markets, and of the global economic system. e survey of prospects and policies is the product
of a comprehensive interdepartmental review of world economic developments, which draws primarily on
information the IMF sta gathers through its consultations with member countries. ese consultations are
carried out in particular by the IMF’s area departments—namely, the African Department, Asia and Pacic
Department, European Department, Middle East and Central Asia Department, and Western Hemisphere
Department—together with the Strategy, Policy, and Review Department; the Monetary and Capital Markets
Department; and the Fiscal Aairs Department.
e analysis in this report was coordinated in the Research Department under the general direction of Oliv-
ier Blanchard, Economic Counsellor and Director of Research. e project was directed by Jörg Decressin,
Senior Advisor, Research Department and Rupa Duttagupta, Deputy Division Chief, Research Department.
e primary contributors to this report are Abdul Abiad, John Bluedorn, Jaime Guajardo, omas Helbling,
Daniel Leigh, Andrea Pescatori, Shaun Roache, Marco E. Terrones, Petia Topalova, and John Simon. Other
contributors include Ali Alichi, Luis Catão, Ondra Kamenik, Heejin Kim, Michael Kumhof, Douglas Laxton,
Prakash Loungani, Gian Maria Milesi-Ferretti, Rafael Portillo, and Felipe Zanna. Toh Kuan, Gavin Asdorian,
Shan Chen, Angela Espiritu, Laura Feiveson, João Jalles, Murad Omoev, Katherine Pan, David Reichsfeld,
Marina Rousset, Andy Salazar, Min Kyu Song, Ercument Tulun, and Su Wang provided research assistance.
Kevin Clinton provided comments and suggestions. Tingyun Chen, Mahnaz Hemmati, Emory Oakes, Rajesh
Nilawar, and Steve Zhang managed the database and the computer systems. Shanti Karunaratne, Skeeter
Mathurin, and Cristina Tumale were responsible for word processing. Linda Grin Kean of the External Rela-
tions Department edited the manuscript and coordinated the production of the publication. External con-
sultants Anastasia Francis, Aleksandr Gerasimov, Wendy Mak, Shamiso Mapondera, Nhu Nguyen, and Pavel
Pimenov provided additional technical support.
e analysis has beneted from comments and suggestions by sta from other IMF departments, as well as
by Executive Directors following their discussion of the report on August 31, 2011. However, both projections
and policy considerations are those of the IMF sta and should not be attributed to Executive Directors or to
their national authorities.
PREFACE
International Monetary Fund | September 2011 xiii
FOREWORD
R
elative to our previous World Economic
Outlook last April, the economic recovery
has become much more uncertain. e
world economy suers from the conu-
ence of two adverse developments. e rst is a
much slower recovery in advanced economies since
the beginning of the year, a development we largely
failed to perceive as it was happening. e second
is a large increase in scal and nancial uncertainty,
which has been particularly pronounced since
August. Each of these developments is worrisome—
their combination and their interactions more so.
Strong policies are urgently needed to improve the
outlook and reduce the risks.
Growth, which had been strong in 2010,
decreased in 2011. is slowdown did not ini-
tially cause too much worry. We had forecast some
slowdown, due to the end of the inventory cycle
and scal consolidation. One-time events, from the
earthquake and tsunami in Japan to shocks to the
supply of oil, oered plausible explanations for a
further slowdown. And the initial U.S. data under-
stated the size of the slowdown itself. Now that the
numbers are in, it is clear that more was going on.
What was going on was the stalling of the two
rebalancing acts, which we have argued in many
previous issues of the World Economic Outlook are
needed to deliver “strong, balanced, and sustainable
growth.”
Take rst internal rebalancing: What is needed
is a shift from scal stimulus to private demand.
Fiscal consolidation is indeed taking place in most
advanced economies (although not in Japan). But
private demand is not taking the relay. e reasons
vary, depending on the country. But tight bank
lending, the legacy of the housing boom, and high
leverage for many households all turn out to be
putting stronger brakes on the recovery than we
anticipated.
Turn to external rebalancing: Advanced econo-
mies with current account decits, most notably the
United States, need to compensate for low domestic
demand through an increase in foreign demand.
is implies a symmetric shift away from foreign
demand toward domestic demand in emerging mar-
ket economies with current account surpluses, most
notably China. is rebalancing act is not taking
place. While imbalances decreased during the crisis,
this was due more to a large decrease in output in
advanced relative to emerging market economies
than to structural adjustment in these economies.
Looking forward, the forecast is for an increase
rather than a decrease in imbalances.
Now turn to the second adverse development,
increased scal and nancial uncertainty: Mar-
kets have clearly become more skeptical about the
ability of many countries to stabilize their public
debt. For some time, their worries were mostly
limited to a few small countries on the periphery of
Europe. As time has passed, and as growth pros-
pects have dimmed, their worries have extended to
more European countries and to countries beyond
Europe—from Japan to the United States. Worries
about sovereigns have translated into worries about
the banks holding these sovereign bonds, mainly in
Europe. ese worries have led to a partial freeze
of nancial ows, with banks keeping high levels
of liquidity and tightening lending. Fear of the
unknown is high. Stock prices have fallen. ese
will adversely aect spending in the months to
come. Indeed, August numbers indicate that this is
already happening.
Low underlying growth and scal and nancial
linkages may well feed back on each other, and this
is where the risks are. Low growth makes it more
dicult to achieve debt sustainability and leads
markets to worry even more about scal stabil-
ity. Low growth also leads to more nonperforming
loans and weakens banks. Front-loaded scal con-
solidation in turn may lead to even lower growth.
Weak banks and tight bank lending may have the
same eect. Weak banks and the potential need for
WORLD ECONOMIC OUTLOOK: SLOWING GROWTH, RISING RISKS
xiv International Monetary Fund | September 2011
more capital lead to more worry about scal stabil-
ity. Downside risks are very real.
I have been focusing so far on advanced econo-
mies. e reason is that, until now, emerging mar-
ket economies have been largely immune to these
adverse developments. ey have had to deal with
volatile capital ows, but in general have continued
to sustain high growth. Indeed, some are close to
overheating, although prospects are more uncertain
again for many others. Under the risk scenarios,
they may well suer more adverse export conditions
and even more volatile capital ows. Low exports
and, perhaps, lower commodity prices will also cre-
ate challenges for low-income countries.
In light of the weak baseline and high downside
risks, strong policy action is of the essence. It must
rely on three main legs.
e rst leg is scal policy. Fiscal consolidation
cannot be too fast or it will kill growth. It cannot
be too slow or it will kill credibility. e speed must
depend on individual country circumstances, but the
key continues to be credible medium-term consolida-
tion. Some countries need substantial outside help
to succeed. Going beyond scal policy, measures to
prop up domestic demand, ranging from continued
low interest rates, to increased bank lending, to reso-
lution programs for housing, are also of the essence.
e second leg is nancial measures. Fiscal
uncertainty will not go away overnight. And even
under the most optimistic assumptions, growth in
advanced economies will remain low for some time.
During that time, banks have to be made stronger,
not only to increase bank lending and baseline
growth, but also—and more important—to reduce
risks of vicious feedback loops. For a number of
banks, especially in Europe, this is likely to require
additional capital buers, either from private or
from public sources.
e third leg is external rebalancing. It is hard
to see how, even with the policy measures listed
above, domestic demand in the United States and
other economies hit by the crisis can, by itself,
ensure sucient growth. us, exports from
the United States and crisis-hit economies must
increase, and, by implication, net exports from the
rest of the world must decrease. A number of Asian
economies, in particular China, have large current
account surpluses and have indicated plans to rebal-
ance from foreign to domestic demand. ese plans
cannot be implemented overnight. But they must
be implemented as fast as possible. Only with this
global rebalancing can we hope for stronger growth
in advanced economies and, by implication, for the
rest of the world.
Olivier Blanchard
Economic Counsellor
International Monetary Fund | September 2011 xv
T
he global economy is in a dangerous
new phase. Global activity has weakened
and become more uneven, condence
has fallen sharply recently, and downside
risks are growing. Against a backdrop of unresolved
structural fragilities, a barrage of shocks hit the
international economy this year. Japan was struck
by the devastating Great East Japan earthquake and
tsunami, and unrest swelled in some oil-producing
countries. At the same time, the handover from
public to private demand in the U.S. economy
stalled, the euro area encountered major nan-
cial turbulence, global markets suered a major
sell-o of risky assets, and there are growing signs
of spillovers to the real economy. e structural
problems facing the crisis-hit advanced economies
have proven even more intractable than expected,
and the process of devising and implementing
reforms even more complicated. e outlook for
these economies is thus for a continuing, but weak
and bumpy, expansion. Prospects for emerging
market economies have become more uncertain
again, although growth is expected to remain fairly
robust, especially in economies that can counter the
eect on output of weaker foreign demand with less
policy tightening.
World Economic Outlook (WEO) projections
indicate that global growth will moderate to about
4 percent through 2012, from over 5 percent in
2010. Real GDP in the advanced economies is
projected to expand at an anemic pace of about
1½ percent in 2011 and 2 percent in 2012, helped
by a gradual unwinding of the temporary forces
that have held back activity during much of the
second quarter of 2011. However, this assumes that
European policymakers contain the crisis in the
euro area periphery, that U.S. policymakers strike a
judicious balance between support for the economy
and medium-term scal consolidation, and that
volatility in global nancial markets does not
escalate. Moreover, the removal of monetary accom-
modation in advanced economies is now expected
to pause. Under such a scenario, emerging capacity
constraints and policy tightening, much of which
has already happened, would lower growth rates in
emerging and developing economies to a still very
solid pace of about 6 percent in 2012.
e risks are clearly to the downside, and two
warrant particular attention from policymakers:
• The first is that the crisis in the euro area runs
beyond the control of policymakers, notwith-
standing the strong policy response agreed at the
July 21, 2011, EU summit. Policymakers must
swiftly ratify the commitments made at the July
summit, and in the meantime, the European
Central Bank (ECB) must continue to inter-
vene strongly to maintain orderly conditions in
sovereign debt markets. Leaders must stand by
their commitments to do whatever it takes to
preserve trust in national policies and the euro.
Furthermore, given declining inflation pressure
and heightened financial and sovereign tensions,
the ECB should lower its policy rate if downside
risks to growth and inflation persist.
• The second is that activity in the United States,
already softening, might suffer further blows—
for example, from a political impasse over fiscal
consolidation, a weak housing market, rapid
increases in household saving rates, or deteriorat-
ing financial conditions. Deep political divisions
leave the course of U.S. policy highly uncertain.
There is a serious risk that hasty fiscal cutbacks
will further weaken the outlook without provid-
ing the long-term reforms required to reduce
debt to more sustainable levels. News from the
housing market has been disappointing, with no
end in sight to the overhang of excess supply and
declining prices, and equity prices have corrected
sharply. These or other developments could
prompt households to accelerate their pace of
deleveraging, by raising their saving rates further.
Given growing downside risks to U.S. activity,
the Federal Reserve should stand ready to deploy
more unconventional support, and the pace of
EXECUTIVE SUMMARY
WORLD ECONOMIC OUTLOOK: SLOWING GROWTH, RISING RISKS
xvi International Monetary Fund | September 2011
fiscal consolidation could become more back-
loaded provided credible medium-term measures
are adopted.
Either one of these eventualities would have
severe repercussions for global growth. e renewed
stress could undermine nancial markets and
institutions in advanced economies, which remain
unusually vulnerable. Commodity prices and
global trade and capital ows would likely decline
abruptly, dragging down growth in emerging and
developing economies. e extent to which this
could lower global growth is illustrated in more
detail in a downside scenario––the euro area and
the United States could fall back into recession,
with activity some 3 percentage points lower in
2012 than envisaged in WEO projections. Damage
to other economies would also be signicant.
Homegrown risks in emerging and developing
economies seem less severe. Signs of overheating
still warrant close attention, particularly from the
monetary and prudential authorities. Risks related
to commodity prices and social and political unrest
in some parts of the world continue to loom large.
e uneven nature of the expansion and the
many risks that threaten activity are symptomatic
of a global economy that continues to struggle
to accomplish the two rebalancing acts identied
in earlier issues of the World Economic Outlook.
First, private demand must take over from public
demand. On this front, many economies have made
considerable progress, but the major advanced
economies lag behind. Second, economies with
large external surpluses must rely increasingly on
domestic demand, whereas those with large decits
must do the opposite. is rebalancing act has
gone only halfway.
1
Key advanced and emerging
market economies need to strengthen their poli-
cies to advance rebalancing and hedge against the
many downside risks. Policies must be calibrated to
reect the transformed global environment, includ-
ing lower potential output in many advanced and
1
See Blanchard, Oliver, and Gian Maria Milesi-Ferretti, 2011,
“(Why) Should Current Account Balances Be Reduced?” IMF
Sta Discussion Note No. 11/03 (Washington: International
Monetary Fund); and Lane, Philip, and Gian Maria Milesi-
Ferretti, 2011, “External Adjustment and the Global Crisis,”
IMF Working Paper No. 11/197 (Washington: International
Monetary Fund), for further discussion of this challenge.
crisis-hit emerging market economies, unusually
vulnerable nancial sectors, high public decits and
debt and more sovereign credit risk dierentiation
among advanced economies, and the greater eco-
nomic resilience of many emerging economies.
Rebalancing from public to private demand:
Policymakers in crisis-hit economies must resist
the temptation to rely mainly on accommoda-
tive monetary policy to mend balance sheets and
accelerate repair and reform of the nancial sector.
Fiscal policy must navigate between the twin perils
of losing credibility and undercutting recovery.
Fiscal adjustment has already started, and progress
has been signicant in many economies. Strength-
ening medium-term scal plans and implementing
entitlement reforms are critical to ensuring cred-
ibility and scal sustainability and to creating policy
room to support balance sheet repair, growth, and
job creation. Better short-term real sector prospects,
in turn, would help make medium-term adjustment
plans more credible. Should the macroeconomic
environment deteriorate substantially, countries
with more room for scal policy maneuvering
should allow automatic stabilizers to operate fully
and could choose a more back-loaded adjustment
prole.
• In the euro area, the adverse feedback loop
between weak sovereign and financial institutions
needs to be broken. Fragile financial institutions
must be asked to raise more capital, preferably
through private solutions. If these are not avail-
able, they will have to accept injections of public
capital or support from the EFSF, or be restruc-
tured or closed. Medium-term plans for fiscal
consolidation are appropriately ambitious. In the
economies of the periphery, a major task will be
to find the right balance between fiscal consolida-
tion and structural reform on the one hand and
external support on the other, so as to ensure that
adjustment in these economies can be sustained.
• The top priorities in the United States include
devising a medium-term fiscal consolidation plan
to put public debt on a sustainable path and
to implement policies to sustain the recovery,
including by easing the adjustment in the hous-
ing and labor markets. The American Job Act
would provide needed short-term support to the
EXECUTIVE SUMMARY
International Monetary Fund | September 2011 xvii
economy, but it must be flanked with a strong
medium-term fiscal plan that raises revenues and
contains the growth of entitlement spending.
• In Japan, the government should pursue more
ambitious measures to deal with the very high
level of public debt while attending to the imme-
diate need for reconstruction and development in
the areas hit by the earthquake and tsunami.
In all these economies, major progress with
respect to entitlement and tax reform would create
more room to adapt the pace of near-term scal
consolidation to the strength of domestic demand
and thereby limit further weakening of the recovery.
Rebalancing from external to domestic demand:
Progress on this front has become even more
important to sustain global growth. Some emerging
market economies are contributing more domes-
tic demand than is desirable (for example, several
economies in Latin America); others are not con-
tributing enough (for example, key economies in
emerging Asia). e rst set needs to restrain strong
domestic demand by considerably reducing struc-
tural scal decits and, in some cases, by further
removing monetary accommodation. e second
set of economies needs signicant currency appre-
ciation alongside structural reforms to reduce high
surpluses of savings over investment. Such policies
would help improve their resilience to shocks origi-
nating in the advanced economies as well as their
medium-term growth potential.
e Great Recession amplied a number of real-
sector problems, especially in advanced economies.
e United States could be facing a very sluggish
recovery of employment. Although unemployment
is below post–World War II highs, job losses during
the crisis were unprecedented and came on top of
lackluster employment performance during the pre-
ceding decade. Households are more worried about
future income prospects than at any time since the
early 1980s. Priorities include easing adjustment
in the housing market and strengthening active
labor market policies. In many ways, however, the
problem is so large that it warrants a drastic change
in macroeconomic policy: major entitlement and
tax reform with a view to creating more room for
scal policy to sustain the recovery in the short
term. In the euro area, abstracting from the large
problems posed by the nancial turbulence, the
situation is more mixed. Households generally seem
less concerned than in the United States, and job
destruction has been much less severe, except in the
crisis-hit economies of the periphery. e key struc-
tural challenge is for the economies in the periphery
to adopt reforms that improve their capacity to
rebuild and maintain their competitiveness.
Structural challenges elsewhere in the world vary
widely. Large capital inows in some emerging mar-
ket economies underscore the need to improve their
absorptive capacity by further opening product and
services markets to foreign capital and strengthen-
ing nancial stability frameworks. In addition, high
food prices underscore the need for many emerging
and developing economies to develop well-targeted
social safety nets.
In view of the slow pace of global demand rebal-
ancing, high commodity prices, and the modest
growth outlook for advanced economies, long-term
interest rates for key sovereigns are likely to stay
low. is may foster risk taking in other econo-
mies––previous episodes of money recycling on
a massive scale have rarely been without nancial
accidents. Symptoms of excessive risk taking are
in fact evident in a few advanced and a number
of emerging market economies: very high credit
growth, booming real estate markets, and large
ows into nancial markets. More generally, the
nancial crisis brought to the fore the extraordi-
nary vulnerability of the global nancial system to
disruptions in wholesale funding markets. At the
national level, central banks have responded by
putting in place temporary mechanisms that inject
liquidity if wholesale funding threatens to dry up.
ere are, however, no such mechanisms at the
international level. In general, the latest nancial
crisis illustrates the urgent need to beef up the size
and scope of international risk-sharing mechanisms,
which have fallen far behind the size of interna-
tional nancial markets.
To ensure that trade remains supportive of the
global recovery, policymakers must continue to
resist protectionist pressures. Just as important,
with negotiations on the long-running World Trade
Organization (WTO) Doha Round of trade talks at
a pivotal juncture, political leaders need to muster
WORLD ECONOMIC OUTLOOK: SLOWING GROWTH, RISING RISKS
xviii International Monetary Fund | September 2011
the will and high-level attention to devise a credible
plan to move the negotiations forward, including by
strongly communicating the benets to the public.
Failure of the round could lead to fragmentation of
the global trading system and a weakening of the
WTO and multilateralism.
Unless policies are strengthened, especially in
advanced economies, nothing beyond a weak and
bumpy recovery is in the cards. ere are potential
major benets to a stronger, collaborative policy
response. As explained in a separate IMF report
for the G20 Mutual Assessment Program, adopt-
ing growth-friendly medium-term scal consolida-
tion programs in advanced economies, policies
to rebalance demand in emerging market surplus
economies, and structural reforms to boost poten-
tial growth everywhere could provide a considerable
llip to global GDP.
2
Perhaps even more important,
together with measures to facilitate balance sheet
adjustment by households and banks, such policies
would forestall a lost decade of growth in advanced
economies, which would be very detrimental for all.
However, achieving this will require that policymak-
ers tackle dicult political economy challenges at
home and resuscitate the strong collaborative spirit
that prevailed at the height of the crisis.
2
See Group of Twenty, 2010, “G20 Mutual Assessment Process—
Alternative Policy Scenarios,” report prepared by sta of the
International Monetary Fund for the G20 Mutual Assessment
Process, G-20 Toronto Summit, Toronto, Canada, June 26–27
(Washington: International Monetary Fund). www.imf.org/
external/np/g20/pdf/062710a.pdf.
1
chapter
International Monetary Fund | September 2011 1
1
CHAPTER
Slowing Global Activity
Activity has weakened signicantly (Figure 1.1),
following a number of quarters of growth broadly in
line with World Economic Outlook (WEO) projec-
tions. e slowdown reects both anticipated and
unanticipated developments. e strong cyclical
rebound in global industrial production and trade
in 2010 was never expected to persist. However, in
crisis-hit advanced economies, especially the United
States, the handover from public to private demand
is taking more time than anticipated. In addition,
sovereign debt and banking sector problems in the
euro area have proven much more tenacious than
expected. Furthermore, the disruptions resulting
from the Great East Japan earthquake and tsunami,
as well as the spreading unrest in the Middle East
and North Africa (MENA) region and the related
surge in oil prices, were major surprises.
e shocks to Japan and the oil supply have had a
temporary eect on global growth, which is begin-
ning to unwind. Various considerations suggest that
they may have lowered output in advanced econo-
mies by ½ percentage point, mostly in the second
quarter of 2011.
• According to some estimates, the number of cars
manufactured worldwide may have dropped by
up to 30 percent in the two months following
the Japanese earthquake and tsunami because of
supply-chain disruptions. For the United States,
some estimates put losses on the order of 1per-
centage point of GDP in the second quarter of
2011;
1
others report smaller effects of about ½
percentage point of GDP.
2
• During the second quarter of 2011, oil prices
briefly rose more than 25percent above the levels
that prevailed in January 2011. It is hard to deter-
mine the extent to which prices were driven up by
1
See Macroeconomic Advisers (2011). Based on manufacturers’
announced plans, they argue that rising car assembly could add
1¼percentage points to GDP in the third quarter.
2
See IMF (2011).
stronger demand or by lower supply (for example,
from Libya). Assuming that a significant share of
the price increase reflected lower supply, it may
have reduced output in advanced economies by ¼
to ½percentage point of GDP.
At the same time, emerging and developing
economies performed broadly as forecast, with con-
siderable variation across regions. Activity began to
rebound fairly strongly in the crisis-hit economies of
central and eastern Europe (CEE) and the Common-
wealth of Independent States (CIS), helped in the
latter by buoyant commodity prices. Surging com-
modity prices also propelled Latin America to high
growth rates. Activity in developing Asia weakened
modestly in response to global supply-chain disrup-
tions and destocking in the face of more uncertain
demand from advanced economies. Sub-Saharan
Africa (SSA) continued to expand at a robust pace.
By contrast, economic activity in the MENA region
suered from political and social conict, although
strong revenues boosted the economies of oil export-
ers. e net result of the various developments in
advanced and emerging market economies was
unexpectedly weak global activity during the second
quarter (Figure1.1, bottom panel).
Renewed Financial Instability
Recently, nancial volatility has again increased
drastically, driven by concerns about developments
in the euro area and the strength of global activity,
especially in the United States. Policy indecision has
exacerbated uncertainty and added to nancial strains,
feeding back into the real economy. e September
2011 Global Financial Stability Report observes that
renewed doubts about the prospects for addressing the
problems in the euro area resurfaced in spring 2011
and have since deepened, notwithstanding the strong
measures agreed at the July 21, 2011, EU summit. It
is worrisome that investors have signicantly pushed
up sovereign risk premiums for Belgium, Italy, and
Spain, and—to a much lesser extent—France (Figure
GLOBAL PROSPECTS AND POLICIES
WORLD ECONOMIC OUTLOOK: SLOWING GROWTH, RISING RISKS
Table 1.1. Overview of the World Economic Outlook Projections
(Percent change unless noted otherwise)
Year over Year
Difference from June
2011 WEO Projections
Q4 over Q4
Projections Estimates Projections
2009 2010 2011 2012 2011 2012 2010 2011 2012
World Output
1
–0.7 5.1 4.0 4.0 –0.3 –0.5 4.8 3.6 4.1
Advanced Economies –3.7 3.1 1.6 1.9 –0.6 –0.7 2.9 1.4 2.2
United States –3.5 3.0 1.5 1.8 –1.0 –0.9 3.1 1.1 2.0
Euro Area –4.3 1.8 1.6 1.1 –0.4 –0.6 2.0 1.1 1.6
Germany –5.1 3.6 2.7 1.3 –0.5 –0.7 3.8 1.6 2.0
France –2.6 1.4 1.7 1.4 –0.4 –0.5 1.4 1.4 1.7
Italy –5.2 1.3 0.6 0.3 –0.4 –1.0 1.5 0.4 0.4
Spain –3.7 –0.1 0.8 1.1 0.0 –0.5 0.6 0.7 1.7
Japan –6.3 4.0 –0.5 2.3 0.2 –0.6 2.5 0.5 2.0
United Kingdom –4.9 1.4 1.1 1.6 –0.4 –0.7 1.5 1.5 1.7
Canada –2.8 3.2 2.1 1.9 –0.8 –0.7 3.3 1.4 2.5
Other Advanced Economies
2
–1.1 5.8 3.6 3.7 –0.4 –0.1 4.8 3.8 3.9
Newly Industrialized Asian Economies –0.7 8.4 4.7 4.5 –0.4 0.0 6.0 5.2 4.7
Emerging and Developing Economies
3
2.8 7.3 6.4 6.1 –0.2 –0.3 7.4 6.4 6.4
Central and Eastern Europe –3.6 4.5 4.3 2.7 –1.0 –0.5 5.3 2.9 2.7
Commonwealth of Independent States –6.4 4.6 4.6 4.4 –0.5 –0.3 4.6 3.8 3.9
Russia –7.8 4.0 4.3 4.1 –0.5 –0.4 4.4 4.0 3.6
Excluding Russia –3.0 6.0 5.3 5.1 –0.3 0.0 . . . . . . . . .
Developing Asia 7.2 9.5 8.2 8.0 –0.2 –0.4 9.0 8.1 8.1
China 9.2 10.3 9.5 9.0 –0.1 –0.5 9.8 9.3 9.1
India 6.8 10.1 7.8 7.5 –0.4 –0.3 9.2 7.0 7.5
ASEAN-5
4
1.7 6.9 5.3 5.6 –0.1 –0.1 6.0 5.4 5.6
Latin America and the Caribbean –1.7 6.1 4.5 4.0 –0.1 –0.1 5.4 4.1 3.9
Brazil –0.6 7.5 3.8 3.6 –0.3 0.0 5.0 3.8 3.8
Mexico –6.2 5.4 3.8 3.6 –0.9 –0.4 4.2 3.7 3.2
Middle East and North Africa 2.6 4.4 4.0 3.6 –0.2 –0.8 . . . . . . . . .
Sub-Saharan Africa 2.8 5.4 5.2 5.8 –0.3 –0.1 . . . . . . . . .
Memorandum
European Union –4.2 1.8 1.7 1.4 –0.3 –0.7 2.1 1.3 1.9
World Growth Based on Market Exchange Rates –2.3 4.0 3.0 3.2 –0.4 –0.5 . . . . . . . . .
World Trade Volume (goods and services) –10.7 12.8 7.5 5.8 –0.7 –0.9 . . . . . . . . .
Imports
Advanced Economies –12.4 11.7
5.9 4.0 –0.1 –1.1 . .
. . . . . . .
Emerging and Developing Economies –8.0 14.9 11.1 8.1 –1.0 –0.9 . . . . . . . . .
Exports
Advanced Economies –11.9 12.3 6.2 5.2 –0.6 –0.9 . . . . . . . . .
Emerging and Developing Economies –7.7 13.6 9.4 7.8 –1.8 –0.5 . . . . . . . . .
Commodity Prices (U.S. dollars)
Oil
5
–36.3 27.9 30.6 –3.1 –3.9 –2.1 . . . . . . . . .
Nonfuel (average based on world commodity
export weights) –15.7 26.3 21.2 –4.7 –0.4 –1.4 . . . . . . . . .
Consumer Prices
Advanced Economies 0.1 1.6 2.6 1.4 0.0 –0.3 1.6 2.5 1.3
Emerging and Developing Economies
3
5.2 6.1 7.5 5.9 0.6 0.3 6.2 6.9 5.1
London Interbank Offered Rate (percent)
6
On U.S. Dollar Deposits 1.1 0.5 0.4 0.5 –0.2 –0.3 . . . . . . . . .
On Euro Deposits 1.2 0.8 1.3 1.2 –0.4 –1.4 . . . . . . . . .
On Japanese Yen Deposits 0.7 0.4 0.5 0.3 0.0 0.1 . . . . . . . . .
Note: Real effective exchange rates are assumed to remain constant at the levels prevailing during July 18–August 15, 2011. When economies are not listed alphabetically, they are ordered on
the basis of economic size. The aggregated quarterly data are seasonally adjusted.
1
The quarterly estimates and projections account for 90 percent of the world purchasing-power-parity weights.
2
Excludes the G7 (Canada, France, Germany, Italy, Japan, United Kingdom, United States) and Euro Area countries.
3
The quarterly estimates and projections account for approximately 80 percent of the emerging and developing economies.
4
Indonesia, Malaysia, Philippines, Thailand, and Vietnam.
5
Simple average of prices of U.K. Brent, Dubai, and West Texas Intermediate crude oil. The average price of oil in U.S. dollars a barrel was $79.03 in 2010; the assumed price based on
futures markets is $103.20 in 2011 and $100.00 in 2012.
6
Six-month rate for the United States and Japan. Three-month rate for the Euro Area.
CHAPTER 1 GLOBAL PROSPECTS AND POLICIES
International Monetary Fund | September 2011 3
1.2, top panels); and that Cyprus has come under
major pressure. Interbank markets are again under
strain, and some banks reportedly are nding it di-
cult to continue to obtain funding (Figure 1.2, center-
right panel). With accumulating signs of weakness in
key advanced economies, notably bad news about the
U.S. economy over the past couple of months, equity
markets have fallen sharply and equity price volatility
has jumped up (Figure 1.3, top panels); also, prices
for strong sovereign bonds and gold have risen—all
signs that investors have become much more cau-
tious about the prospects for the major advanced
economies.
More Uneven Expansion
Worryingly, various consumer and business con-
dence indicators in advanced economies have retreated
sharply, rather than strengthened as might have been
expected in the presence of mostly temporary shocks
that are unwinding. Accordingly, the IMF’s Growth
Tracker (Figure 1.4, top panel) points to low growth
over the near term. WEO projections assume that
policymakers keep their commitments and the nancial
turmoil does not run beyond their control, allowing
condence to return as conditions stabilize. e return
to stronger activity in advanced economies will then be
delayed rather than derailed by the turmoil. Projections
thus point to a modest pickup of activity in advanced
economies and robust growth in emerging and devel-
oping economies during 2011–12 (Figure 1.5; Table
1.1). Global growth is expected to be about 4 percent.
Real GDP growth in the major advanced economies––
the United States, euro area, and Japan––is forecast to
rise modestly, from about ¾percent in the rst half
of 2011 to about 1½percent in 2012, as the eects
of temporary disturbances abate and the fundamental
drivers of expansion slowly reassert themselves. Activity
will be more robust in a number of other advanced
economies, especially in those with close ties to emerg-
ing Asia. In emerging and developing economies,
capacity constraints, policy tightening, and slowing
foreign demand are expected to dampen growth to
varying extents across countries. As a result, growth in
these economies will drop from about 7percent in the
rst half of 2011 to about 6 percent in 2012. Risks are
mainly to the downside over the near term.
2
1
3
4
5
Sources: Bureau of Economic Analysis; U.S. Treasury; European Central Bank; Haver
Analytics; Netherlands Bureau for Economic Policy Analysis for CPB trade volume index;
and IMF staff estimates.
Not all economies are included in the regional aggregations. For some economies,
monthly data are interpolated from quarterly series.
In SDR terms.
Argentina, Brazil, Bulgaria, Chile, China, Colombia, Hungary, India, Indonesia, Latvia,
Lithuania, Malaysia, Mexico, Pakistan, Peru, Philippines, Poland, Romania, Russia, South
Africa, Thailand, Turkey, Ukraine, and Venezuela.
Australia, Canada, Czech Republic, Denmark, euro area, Hong Kong SAR, Israel, Japan,
Korea, New Zealand, Norway, Singapore, Sweden, Switzerland, Taiwan Province of China,
United Kingdom, and United States.
U.S. dollars a barrel; right scale; simple average of spot prices of U.K. Brent, Dubai
Fateh, and West Texas Intermediate crude oil.
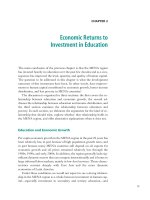
Figure 1.1. Global Indicators
1
(Annualized percent change of three-month moving average over previous
three-month moving average unless noted otherwise)
Global trade and industrial production lost momentum during the second quarter of
2011, partly because an earthquake and tsunami in Japan disrupted global supply
chains and high oil prices slowed consumption in advanced economies. As a result,
global growth turned out weaker than expected, mainly in advanced economies.
2
-75
-50
-25
0
25
50
World Trade
2000 02 04 06 Jun.
11
CPB trade
volume index
Trade value
08
80
85
90
95
100
105
110
Japanese Industrial Production
(Jan. 2010 = 100)
Jan.
2010
Jul.
11
Jul.
10
Jan.
11
Japan
4
3
-36
-24
-12
0
12
24
Industrial Production
World
2005 07 Jul.
11
Advanced
economies
Emerging
economies
09
Advanced
economies
excluding
Japan
5
90
100
110
120
130
140
70
80
90
100
110
120
Food and Oil Prices
Jan.
2010
Aug.
11
Jul.
10
Jan.
11
Oct. 10 WEO
Jan. 11
WEO
Jun. 11 WEO
Apr. 11 WEO
Food
(index; left scale)
Oil
0
1
2
3
4
5
0
2
4
6
8
10
12
Advanced economies (left scale)
2010:Q1 12:Q111:Q1
Real GDP Growth
(percent; quarter over quarter, annualized)
April 2011 WEO
12:Q4
Emerging and developing economies (right scale)
October 2010 WEO
WORLD ECONOMIC OUTLOOK: SLOWING GROWTH, RISING RISKS
4 International Monetary Fund | September 2011
Some expansionary forces are expected to return
Key drivers of stronger activity over the near
term include the rebound of activity in Japan,
the drop in oil and food prices (Appendix 1.1),
and solid demand growth in key emerging market
economies.
• Reports from Japan confirm a rapid recovery in
both output and domestic spending. Industrial
production is now growing rapidly, business senti-
ment is improving sharply, and household spending
is recovering quickly. Although electricity shortages
will likely weigh on production throughout the
summer, and the government’s rebuilding program
could suffer further delays, a V-shaped short-term
rebound seems to be under way.
• Oil prices are back where they were at the dawn of
unrest in the MENA region (Appendix 1.1). They
ended the second quarter at about $105 a barrel,
after peaking at about $120 by the end of April,
helped partly by more supply from other mem-
bers of the Organization of Petroleum Exporting
Countries (OPEC) and the release of crude oil and
petroleum stocks from strategic emergency reserves
by International Energy Agency (IEA) members.
The IMF base metal price index declined by about
9 percent from its first- quarter peak in Febru-
ary. However, the decline in food prices has been
much more limited, amounting to about 4 percent,
mainly because food crops are now expected to be
below earlier estimates.
Activity is likely to receive further support from
several sources. e pace of inventory reduction
should slow with the repair of global supply chains
(Figure 1.6, middle-right panel). Investment in
machinery and equipment has been expanding at
a fairly solid pace in both advanced and emerging
market economies (Figure 1.6, bottom-right panel)
and is forecast to continue to do so, helped by
strong corporate protability and relatively healthy
corporate balance sheets.
But consumption in major advanced economies is
expected to lag behind
Consumption in emerging market economies
has been going strong for some time, propelled by
rapidly expanding employment and incomes. But
Figure 1.2. Financial Strains in Europe and the United
States
Sources: Bloomberg Financial Markets; and IMF staff calculations.
Three-month London interbank offered rate minus three-month government bill rate.
CDS = credit default swap.
1
2
1
Jul.
10
The crisis in the euro area has deepened and broadened. Spreads on sovereign
bonds of economies in the periphery have reached new highs. Concurrently, spreads
of several other economies have also widened to varying degrees. Stock prices have
suffered sharp corrections, dragged down by concerns about weak activity and
financial sectors in advanced economies. Strains have resurfaced in interbank
markets. At the same time, credit default swap (CDS) spreads on U.S. government
bonds have moved up. This contrasts with the decline in U.S. bond rates. Both the
euro and U.S. dollar depreciated against the Swiss franc until recently.
-100
0
100
200
300
400
500
Jan.
10
Austria
Sep.
11
Italy
Belgium
Jan.
11
0
1000
2000
3000
4000
5000
6000
7000
8000
Government Bond Spreads
(two-year yield spreads over German bunds; basis points)
Jan.
10
Greece
Sep.
11
Ireland
Portugal
Jan.
11
France
May 10,
2010
May 10,
2010
76
80
84
88
92
96
100
104
108
MSCI Daily Change Differences
(Jan. 1, 2010 = 100)
Euro total–
World total
Euro financial–
World financial
0.6
0.8
1.0
1.2
1.4
1.6
Exchange Rates
U.S. dollar/euro
0
20
40
60
80
100
120
Interbank Spreads
(basis points)
U.S.
dollar
Euro
0
20
40
60
80
100
120
140
Jan.
10
Sep.
11
Jan.
11
U.S. Sovereign CDS
2
Spreads
(one-year; basis points)
Jul.
10
Jul.
10
Jul.
10
Jan.
10
Sep.
11
Jan.
11
Jan.
10
Sep.
11
Jan.
11
Jul.
10
Jan.
10
Sep.
11
Jan.
11
Jul.
10
U.S. dollar/Swiss franc
euro/Swiss franc
July 21,
2011
July 21,
2011
July 21,
2011
July 21,
2011
July 21,
2011
United
States
France
Germany
Netherlands
Spain
CHAPTER 1 GLOBAL PROSPECTS AND POLICIES
International Monetary Fund | September 2011 5
consumption in advanced economies is likely to
remain anemic for these key reasons:
• Unemployment is likely to stay high for some
time. Employment may well exhibit more weak-
ness during much of the summer, even if purchas-
ing managers’ index (PMI) survey indicators for
employment have so far shown greater resilience
than those for production (Figure 1.6, top pan-
els). Neither a significant acceleration nor a large
drop in employment seems in the offing.
• Sluggish wages and low funding costs have
boosted corporate profits, but this is not directly
benefiting households with a high propensity to
consume. Concerns about income prospects are
particularly elevated in the United States, where
an extraordinarily large loss of jobs has added to
an ongoing trend decline in the pace of employ-
ment creation (see below). Meanwhile, the share
of corporate profits in income has returned to
about 10 percent, which is close to the high
precrisis levels. A similar conclusion about jobs
and incomes emerges from an analysis of sectoral
output and employment (Box 1.1).
• House prices show no signs of stabilizing in key
crisis-hit economies such as the United States and
Spain (Figure 1.7, bottom-left panel). A large over-
hang of unsold properties with underwater mort-
gages continues to present a major downside risk to
consumption in the United States. House prices are
rising again in other advanced economies, such as
France and Germany, and remain high in Canada.
However, households everywhere have recently suf-
fered significant losses in stock market wealth.
Financial volatility could hold back activity
As discussed in the September 2011 Global
Financial Stability Report, nancial stability risks
have once again increased dramatically. e IMF
sta’s nancial conditions indices, which consider
developments in equity and bond prices, spreads,
and bank lending volume in the United States and
the euro area, have tightened noticeably lately (see
Figure 1.3, bottom panel), reecting mainly lower
stock prices and tighter spreads. How nancial
markets will evolve—and how they will aect real
sectors in advanced economies—is still unclear.
1
2
3
4
Figure 1.3. Recent Financial Market Developments
Financial Conditions Index
4
(positive = tightening; standard deviations from average)
1
3
2
Sources: Bank of America/Merrill Lynch; Bank of Japan; Bloomberg Financial Markets;
European Central Bank; Federal Reserve; Haver Analytics; Thomson Datastream; and IMF
staff calculations.
VIX = Chicago Board Options Exchange Market Volatility Index; VXY = JPMorgan
Emerging Market Volatility Index; CSFB = Credit Suisse Fear Barometer.
Ten-year government bonds.
Annualized percent change of three-month moving average over previous three-month
moving average. After January 2009, loans adjusted for sales and securitization are used for
the euro area. Spike for the United States in late 2010 is due to securitized credit card assets
that banks owned, which were brought onto their balance sheets in 2010.
Historical data are monthly, and forecasts (dashed lines) are quarterly.
30
40
50
60
70
80
90
100
110
120
0
10
20
30
40
50
60
70
80
90
Implied Volatility
(percent)
Emerging markets (VXY)
U.S. (VIX)
Sep.
11
DJ Euro
Stoxx
S&P
500
Equity Markets
(2007 = 100; national currency)
Topix
2000 02 04 06
Sep.
11
08
Equity markets have retreated, and volatility has been on the rise. Investors have
taken flight in government bonds of perceived “safe-haven” countries. There were
signs that credit was bottoming until recently. Financial conditions indices have
tightened lately, but projections assume gradual easing.
May 10, 2010
2000 02 04 06 08
CSFB
-20
-10
0
10
20
30
Private Credit Growth
20000406
Jul.
11
0802
United
States
Japan
Euro area
United States
-2
-1
0
1
2
3
4
5
2000 02 04 10
12:
Q4
Euro Area
-2
-1
0
1
2
3
4
5
Quantities
Spreads
Prices
Quantities
Spreads
Prices
06 08 20000204 10
12:
Q4
06 08
0
1
2
3
4
5
6
Government Bond Yields
Japan
United
States
2002 04 06 Sep.
11
08
Germany
10
1010
10
WORLD ECONOMIC OUTLOOK: SLOWING GROWTH, RISING RISKS
6 International Monetary Fund | September 2011
WEO forecasts assume that the latest bout of
volatility will not lead to large increases in sav-
ing rates and that it will delay, rather than derail,
the normalization of lending conditions. Spreads
on corporate lending in capital markets and on
emerging market sovereigns are still relatively low.
IMF sta projections assume that banks can do
without a sharp and sustained tightening of lending
conditions, in some cases thanks to liquidity sup-
port from central banks. However, weaker growth
prospects pose threats to public and private balance
sheets and signicantly increase the challenge of
coping with heavy debt burdens.
Financial conditions remain supportive of
growth in emerging and developing economies,
notwithstanding higher volatility (Figure 1.8). In
most of these economies, bank credit is still going
strong (Figure1.9, top panels). Search for yield is
spurring capital inows and magnifying already
ample domestic liquidity. But ows are volatile
(Figure 1.8, bottom panels). WEO forecasts see net
private capital ows to most regions rising further,
assuming policymakers in advanced economies
forestall a cycle of deteriorating sovereign and
nancial sector prospects. e eect of strong
growth and tighter monetary conditions in emerg-
ing market economies would then outweigh the
eect of more elevated risk aversion among inves-
tors. However, as noted in the Global Financial
Stability Report, with global downside risks rising,
emerging markets could also face a sharp reduction
in demand, a reversal in capital ows, and a rise
in funding costs that could impact the nancial
soundness of domestic banks.
Monetary policy will continue to support activity
Monetary policy remains highly accommodative
in many advanced economies (Figure 1.10, top pan-
els), notwithstanding the end of the second round
of quantitative easing (QE2) in the United States
and rate hikes in a number of advanced economies,
including the euro area. e nancial turmoil has
already aected monetary policymaking. e central
banks of Japan and Switzerland have recently taken
steps to further ease monetary conditions, amid
rising deation pressure on account of appreciating
2
3
Figure 1.4. Prospects for Near-Term Activity
1
2
Growth Tracker
1
Inflation Tracker
Sources: Haver Analytics; and IMF staff estimates.
The Growth Tracker is described in Matheson (2011). Within regions, countries are
listed by economic size.
Figures are based on the official GDP and consumer price index (CPI) data. The
3
The method gauges inflation pressure relative to historical trends. In Japan, inflation
is higher than recent trends but still very low.
authorities have committed to improve the quality of Argentina’s official GDP and CPI, so
as to bring them into compliance with their obligations under the IMF’s Articles of
Agreement. Until the quality of data reporting has improved, IMF staff will also use
alternative measures of GDP growth and inflation for macroeconomic surveillance,
including estimates by: private analysts which have been, on average, significantly lower
than official GDP growth from 2008 onward, and provincial statistical offices and private
analysts, which have shown inflation considerably higher than the official inflation rate
from 2007 onward.
Western Hemisphere
Asia and Pacific
Europe
Africa
Middle East
United States
Brazil
Mexico
Canada
Argentina
Colombia
Venezuela
Peru
Chile
Euro area
Germany
Russia
United Kingdom
France
Italy
Spain
Turkey
Sweden
Greece
Portugal
South Africa
Saudi Arabia
China
Japan
India
Korea
Indonesia
Australia
Thailand
Philippines
Singapore
Above trend and rising
Above trend and moderating
Below trend and moderating
Contracting at a moderating rate
Below trend and rising Contracting at an increasing rate
The IMF staff’s Growth Tracker points to moderating growth in the very near term,
while the Inflation Tracker suggests still elevated price pressure in several emerging
market economies. This reflects both high commodity prices and rising core inflation.
Core falling and headline low Core rising and headline low
Core falling and headline high Core rising and headline high
Western Hemisphere
Asia and Pacific
Europe
Africa
United States
Brazil
Mexico
Canada
Argentina
Colombia
Venezuela
Peru
Chile
China
Japan
India
Korea
Indonesia
Australia
Malaysia
Thailand
Philippines
Singapore
Euro Area
Germany
Russia
United Kingdom
France
Italy
Spain
Turkey
Sweden
Greece
Portugal
South Africa
2
Jul.
10
Aug.
2008
Jan.
09
Jul.
09
Jan.
10
Jan.
11
Jul.
11
Jul.
10
Aug.
2008
Jan.
09
Jul.
09
Jan.
10
Jan.
11
Jul.
11