Sercurity market assignment THE FINANCIAL CONDITION AND PROJECT IN THE NEAR FUTURE OF VIN GROUP
Bạn đang xem bản rút gọn của tài liệu. Xem và tải ngay bản đầy đủ của tài liệu tại đây (183.29 KB, 11 trang )
BANKING ACADEMY
SERCURITY MARKET ASSIGNMENT
THE FINANCIAL CONDITION AND PROJECT IN THE NEAR
FUTURE OF VIN GROUP
Lecturer:
Mrs. Trần Xuân Anh
Student :
Trần Hữu Minh
Đỗ Hương Giang
Bùi Thị Thùy Dung
Nguyễn Thị Quỳnh Ngân
Cao Thanh Xuân
Class:
K18CLC B
Contents
1.Introduction of Vin Group.
The force runner of Vin Group was Technocom - a producing instant noodles company,
was held in 1993 in Ukraine . At the beginning of 2000, Technocom came back to
Vietnam, focused on investing in travel and real estate with 2 trademarks: Vincom and
Vinpearl. January 2012, Vincom Joint Stock company and Vinpearl Joint Stock company
has merged, formally known as Vin Group- Joint Stock Company. The charted capital of
Vin Group is 26.377.079.540.000 VND and the volume of listed share is 2.637.707.954
shares in 2017.
Vin Group are now concentrating in 7 field: Real estate, Traveling- Entertainment, Retail,
Medical, Education, Agriculture and Industrial. Wishing to bring to the market products
and services of international standard and new experience of modern life, in any field,
Vin Group also proves the pioneering role change in consuming trend.
Vin Group has done wonders to honor the Vietnamese brand and deserved to be one of
the leading private economic groups in Vietnam.
2. Vin Group’s performances analysis
Balance sheet
TOTAL
ASSETS
Current
Assets
2017
2016
2015
214,855,098
180,450,850
145,554,358
100,528,907
87,583,802
67,699,620
9,833,332
6,938,465
Cash and
8,610,504
Cash Equivalents
Short
financial
investment
Income
term
203,016
494,157
11,142,980
2017
2016
2015
Short
term
GROSS
SALE 90,423,675
57,670,387
34,054,969
Account
28,978,153
18,254,656
13,848,128
REVENUES
Receivables
Deduction revenues
69,100
56,044 28,027,418
7,003
Inventories
48,615,074
49,782,781
Net Sales
90,354,575 57,614,344 34,047,966
Other
Current
14,122,160
9,218,876
7,742,629
Assets
Cost of goods sold
62,854,039 40,184,633 22,338,934
Long-term
92,867,048
77,854,738
Gross profit 114,326,191
27,500,536
17,429,711
11,709,033
Assets
Financialterm
income
1,646,395 5,861,557 1,931,520
Long
Account
478,499 4,070,187
465,5075,389,034
254,324
Financial Expenses
3,282,075
Receivable
Of which: Interest 3,647,094 4,308,067 2,721,940
Fixed
assets 35,646,902
26,878,731
19,837,151
Expenses
Real
Profit orEstate
loss from
join 10,801
19,824 16,827,664
39,228
17,372,962
17,362,127
Investment
venture companies
Long-term
Selling Expenses
8,605,680
6,672,816
2,957,826
45,417,393
33,991,567
18,115,293
incomplete assets
General term
and admin 7,375,304 5,526,090 3,922,773
Long
expenses
Finacial
6,528,162
3,347,545
9,597,558
Investments
Net
Profit
from 9,106,561 5,723,151 3,517,107
Operating
activities
Other
long
8,882,273
10,821,571
13,222,748
termOther
assetsincomes
503,636
688,480
283,039
Goodwill
Other Expenses0
694,992
618,872 0 948,045
0
(before 2015)
Other profits
-191,356 69,608
-665,006
TOTAL
214,855,098 180,450,850 145,554,358
EQUITY
Profit or lost from join 0
0
0
venture
companies
Liabilities
162,548,919 135,184,455 107,969,433
(before 2015)
Short
term
124,896,668 97,627,931
64,900,384
Liabilities
Long
Liabilities
Owners
term
37,652,251
37,556,524
43,069,048
52,306,179
45,266,395
37,584,925
statement
2017
2016
2015
Total profit before tax 8,915,205 5,792,759 2,852,101
Corporate Income Tax
3,475,385 2,279,691 1,350,626
Expenses
Current
Corporate
3,784,542 2,534,169
Income Tax Expenses
1,424,643
Deferred
Income
-309,156
Taxes Expenses
-74,017
-254,478
Profit after Corporate
4,247,289 2,439,511
Income Tax
1,215,775
Benefits of Minitory
1,192,530 1,073,557 285,701
shareholders
Earnings per share
0
0
0
Related ratio
DAR
DER
ROA
ROE
Current ratio
Quick ratio
EPS
2017
75.66
310.76
1.98
8.12
80.49
41.57
1.61
2016
74.91
298.64
1.35
5.39
89.71
38.72
1.18
2015
74.18
287.27
0.84
3.23
104.31
61.13
0.68
2.1. Vin Group’s performances and analysis
The balance sheet and income statement of Vin Group gave us an overview of VIC’s
financial performances from 2015 to 2017.
Firstly, DAR ratio of Vin group increased slightly from 74.18 in 2015 to 74.91 in 2016
and then reached 75.66 in 2017. It showed that the main source of this firm’s capital was
from debt and it tends to increase slightly throughout three years. In addition, the
company also had a large DER ratio to show that the company is now operating largely
debt-based. A high debt / equity ratio generally means that a company has been
aggressive financing its growth with debt. Normally, a company with a high DER ratio
has a high amount of debt related to their available equity will not likely to instill much
confidence from the creditors that the company can repay the loan. On the other hand, a
company which has a low DER ratio poses less risk to the creditors and appear to have a
reasonable ability to repay the loans. On the contrary, aggressive leveraging practices are
often associated with high levels of risk and the company with a lot of debt is used to
finance increased operations could potentially generate more earnings than it would have
without this outside financing. If this were to increase earnings by a greater amount than
the debt cost (interest), then the shareholders benefit as more earnings are being spread
among the same number of shareholders. Hence, this is quite normal since Vin Group is
not a commodity trading company, but it mainly takes place in the investment field. On
the other hand, look at the increase in total assets (increase 19% from 2016 to 2017), it
can be seen that Vin Group has successfully asserted its position as well as its value.
The ability of returning on your investment should also be concerned before making final
decision. ROA provides investors with information about the returns generated by the
amount of investment (or amount of assets). Return on assets (ROA) is an indicator of
how profitable a company is relative to its total assets and gives a manager, investor, or
analyst an idea as to how efficient a company's management is at using its assets to
generate earnings. In basic terms, ROA tells you what earnings were generated
from invested capital (assets). This is why when using ROA as a comparative measure, it
is best to compare it against a company's previous ROA numbers or against a similar
company's ROA. It can be seen that the index has continuously grew from 2015 to 2017.
In the latest figures, 1 dollar of your investment can be bring back 1.98 dollar, while in
2016, investors could only receive 1.35 dollar from 1 dollar invested. Another ratio
should be concerned is ROE ( Return on equity). This is the most important ratio for
shareholders, which measures the profitability of each shareholder. The higher the ROE
get, the more effective it is for the company to use equity capital, which means that the
company can balance its equity with its borrowings to exploit its competitive advantage,
capital mobilization process and scale expansion efficiently. The higher the ROE is, the
more attractive the stock. This index is an accurate measure of how much a return is
made and how much accrued interest it generates. Specifically, in 2017, with 1 share of
capital invested by Vin Group shareholders, it will be able to generate 8.12 dollar , about
1.5 times compared to 2016 and 2.5 times higher than that of 2015. With these figures,
this company are using the investment effectively from the shareholders.
In term of the firm’s main source to repay its loans as well as its liquidity, this can be
showed through current ratio and quick ratio. The current ratio is a liquidity ratio that
measures a company's ability to pay short-term and long-term obligations. To gauge this
ability, the current ratio considers the current total assets of a company (both liquid and
illiquid) related to company’s current total liabilities. The current ratio is mainly used to
give an idea of a company's ability to pay back its liabilities (debt and accounts payable)
with its assets (cash, marketable securities, inventory, accounts receivable). As such,
current ratio can be used to make a rough estimate of a company’s financial health. The
current ratio can give a sense of the efficiency of a company's operating cycle or its
ability to turn its product into cash. In balance sheet, with 1 dollar invested in Vin Group,
it will be able to be paid at 0.849 dong, which means that the return rate with current
asset is 80.49%. In addition, with 1 dollar from investor, the company will be able to pay
back 0.41 dollar cash or cash equivalents instantly. This is not a good result for Vin
Group because if the ratio is less than 100%, the company will not be able to fulfill its
debt repayment obligations on time, so in spite of the fact that Vin Group is a big
company, the activities of Vin Group are now not fulfilled or excellent. However, this
figure is not much lower than in the previous years as well as quite high index compared
to other companies, so this does not prove that the company is in financial trouble or
about to be bankrupt.
Finally, in the field of investing, we can see that the real estate sector with a total
investment of 17,372,962 in 2017 is playing the most important part and thus, had an
increase from 2016 and 2015. The company also has a high Long-term incomplete
figures and points out that Vin group has many investment projects, possibly large real
estate. This figure is really trustworthy because Vin Group has been holding a lot of
investment projects so far, as well as owning many buildings, commercial centers, real
estate, etc. which have been completed or incomplete nationwide.
2.2 Vin Group’s stock market statistic and analysis
•
•
•
•
•
•
•
•
•
23/03/2018
109.5
Tăng 1.5 (1.4%)
Khối lượng
Giá tham chiếu
Giá trần
Giá sàn
Giá mở cửa
Giá cao nhất
Giá thấp nhất
GD ròng NĐTNN
Room NN còn lại
Đơn vị giá: 1000 VNĐ
3,455,080
108
115.5
100.5
105.6
111.2
105.5
1,207,100
18.32 (%)
(*) EPS cơ bản (nghìn đồng):
1.61
Trading history
Date
23/03/2018
Ope
Change (+ -/ n
%)
Pric
e
+1.5 (+1.39%)
22/03/20180 (0%)
21/03/2018
+3.8 (+3.65%)
20/03/2018-0.2 (-0.19%)
19/03/2018
16/03/2018
+4.7 (+4.71%)
+0.2 (+0.20%)
15/03/2018-3.0 (-2.93%)
Clos
Highes Lowes e
Averag Adjuste Trading
t price t price Pric e Price d Price Volume
e
105.6 111.2
105.5
109.5 108.25
109.5
3,455,080
109
108
108
109.30
108
2,262,170
104.9 108.6
104.5
108
107.17
108
3,520,200
103
103
104.2 104.38
104.2
1,045,660
100.2 105
100.2
104.4 103.62
104.4
1,201,010
99.4
99.4
99.7
99.90
99.7
3,090,070
99.5
99.5
100.62
110.7
105.5
101
102.9 102.9
In 2017, VIC stock is one of the most outstanding stocks for creating the effect of
recovery on the common stock market in Vietnam. VIC has been surprised by the sharp
rise in prices since the beginning of 2017.
In 2018, VIC stock is expected to continue to make a strong move in its direction as well
as business performance. Under the partial valuation method, ACBS valuates VIC at
VND86,000/share by the end of 2018.
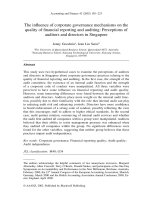
This table above shows the changes of stock selling on the market of VIC for the last 7
days from March 15th to March 23th. In spite of the fact that there was no changes on
March, 22nd , the index seemed to grow on March, 23 rd with 1.5 percentages.
Specifically, the opening price on 22rd which was the highest opening price for the last 7
days went down from 109 to 105.6 on 23th, while the closing price increased from 108 to
109.5 to be the best closing price that Vin Group’s stock could reach during the past
week. In addition. the highest price that this company’s stock gained on 22nd was 110.7
and then increased to 111.2 on 23 rd . Meanwhile, the lowest price on 22 nd was 108 that
decreased 2.5 on the next day. In general, the average price in last 2 days fell from 109.30
on 22nd to 108.25 on 23rd . However, the adjusted price tends to increase constantly during
the past week when it only reached 99.7 initially on 16 th and rose to 109.5 on 23rd . In the
same week, the trading volume on the stock market of VIC showed the constantly
fluctuations. At the beginning, it kept falling for 2 days to 1,045,660 on 20 th and it grew
dramatically to reach a peak on 21st of 3,520,200, then dropped gradually to 2,262,170 on
22nd before jumping sharply to 3,455,080 on the last day of the week.
To sum up, the market statistic of VIC are showing positive signs of recovery despite of
the gloom of Viet Nam’s stock market.
3.Project
3.1.Urban railway.
The first project that Vingroup tend to do in the future to mobilize and utilize capital is
that investing in URBAN RAILWAY. They plan to invest $4.4 billion on this project in
Hanoi. On June 25th, 2017, Vingroup has signed a Memorandum of Understanding
(MoU) with Hanoi authorities to perform this project. Accordingly, the project that
Vingroup plans to deploy is the first urban railway in Vietnam is built entirely by private
capital; in specifically, they will develop parts of five railway route in the capital,
including segments connecting Noi Bai International Airport to the Nam Thang Long and
Phu Dien areas.
This project will bring a lot of opportunity to mobilize capital because urban railway is
expected to be the popular vehicle that the resident will volunteer to choose using this
kind of transport. The first reason is the status of traffic in Hanoi. Most of Hanoi citizens
feel uncomfortable when in traffic cause they are tired of standing for an hour in the
street everyday to wait for traffic jam. There are so many vehicles in the city on the rush
hour that it takes a lot of time to move on the street. Therefore, if they have another
choice for urban railway, they can get rid of worrying about being stuck in the traffic,
instead they can buy a ticket to go by metro of the railway, and there will have no traffic
jam anymore.
The next reason why people will choose is that the public transport in Hanoi is very
awful. We have to admit that, the amount of people on a bus in the rush hour is as much
as about five times more than normal, this will lead to huddling condition in this bus. In
this condition, social evils can happen like hook on the bus. Besides, hustling in this
public transport also cause unexpected accidents. So that, if urban railway can be put into
use, the number of people traveling by bus can be reduced, and as a result, social evils or
accidents can be minimized.
In conclusion, Vingroup’s urban railway project is the ideal project that can bring a lot of
capital to the company, therefore, investing in Vingroup is a good idea to the investors
earn profit in the future.
3.2.Vinfast
The second project that Vingroup tend to do in the future to mobilize and utilize capital is
that investing to car manufacturing in Viet Nam. The country’s largest real-estate
company Vingroup plans to invest up to $3.5 billion to set up a manufacturing and
research and development complex, aiming to roll out the first car in 24 months. The
Hanoi-based developer will break ground on the $1 billion to $1.5 billion first phase of
the plant, with a plan to make sedans, sport utility vehicles and electric cars in the future.
Vingroup want to create an affordable and high-quality car for Vietnamese. Vingroup has
signed a memorandum of understanding with a major investment bank regarding a
potential loan for as much as $800 million, though it plans to fund most of the project
itself, she said. Vietnam’s ambitions are similar to efforts by companies in China and
Malaysia, which have also tried to create cheaper, local brands to woo consumers in a
region where foreign brands including Toyota Motor Corp. and Volkswagen AG have had
years of dominance. Vingroup will face the same challenges as Chinese automakers,
which have struggled to win over buyers in the world’s biggest vehicle market.
Chinese companies such as Geely, BYD, Beijing Auto and Chery have been trying for
years to create a domestic car brand. Sales of cars bearing Chinese nameplates accounted
for 43.5 percent of the total sales during January to July, according to the China
Association of Automobile Manufacturers. Toyota is Vietnam’s biggest car seller with a
23 percent market share in July, according to the Vietnam Automobile Manufacturers’
Association. Ford Motor Co. had 12 percent.
VINFAST’s automobile complex, to be located in the northern port city of Haiphong,
will initially produce sedans and SUVs. Vingroup plans to eventually expand to mini and
electric cars and targets production of up to 500.000 vehicles per year by 2025. The
facility will include an e-scooter plant, which is expected to produce its first model in 12
months.
This project will brings a lot of opportunity to mobilize capital because electric cars will
be blossom in future cars market in the world. A wide range of Developed countries such
as Japan, USA, Canada, UK, France, Germany, etc. are converting from automobiles
using natural materials such as gasoline and diesel to electric motors in order to protect
the environment and also make use of renewable fuel. The European Union (EU) has also
set a targeting to "kill" gasoline-fueled cars by 2030 – 2050.
Moreover, Vietnam is emerging as the world's leading potential consumer market with a
low car ownership ratio of just 23 vehicles per 1.000 people, compared with Thailand's
204 / 1.000 and around 400 / 1.000 in developed countries. However, compared with the
average Vietnamese income, cars are always a luxury item beyond reach. The car dream
of Vietnamese people has been formed many years ago but no one really reaped the
results. Vingroup Group willing to make a brand of Vietnamese cars, high quality, cheap
price closer to consumers in Vietnam. Vietnam's automobile industry is expected to be
able to compete with South East Asian countries with a leading brand.
In short, although Vin Group does not have an outstanding success in 2017 but this
company financial condition still show the positive believe in the future with many
projects that have a good ability to generate investment.