Impact of the ‘Healthy Youngsters, Healthy Dads’ program on physical activity and other health behaviours: A randomised controlled trial involving fathers and their preschool-aged
Bạn đang xem bản rút gọn của tài liệu. Xem và tải ngay bản đầy đủ của tài liệu tại đây (1.53 MB, 16 trang )
(2022) 22:1166
Morgan et al. BMC Public Health
/>
Open Access
RESEARCH
Impact of the ‘Healthy Youngsters, Healthy
Dads’ program on physical activity and other
health behaviours: a randomised controlled
trial involving fathers and their preschool‑aged
children
Philip J. Morgan1,2,3*, Jacqueline A. Grounds1,2,3, Lee M. Ashton1,2,3,4, Clare E. Collins4,5, Alyce T. Barnes1,2,3,
Emma R. Pollock1,2,3, Stevie‑Lee Kennedy1,2,3, Anna T. Rayward1,2,3, Kristen L. Saunders1,2,3, Ryan J. Drew2,6 and
Myles D. Young2,7
Abstract
Background: Targeting fathers may be a key strategy to increase physical activity among their preschool-aged chil‑
dren, but limited research exists in this area. The primary study aim was to examine the impact of a lifestyle program
for fathers and their preschool-aged children on child physical activity levels.
Methods: A total of 125 fathers (aged: 38 ± 5.4 years, BMI: 28.1 ± 4.9 kg/m2) and 125 preschool-aged children (aged:
3.9 ± 0.8 years, BMI z-score: 0.3 ± 0.9, 39.2% girls) recruited from Newcastle, Australia, NSW were randomised to (i)
the Healthy Youngsters, Healthy Dads (HYHD) program, or (ii) wait-list control group. The program included two
fathers-only workshops (2 h each) and eight father-child weekly educational and practical sessions (75 min each), plus
home-based activities targeting family physical activity and nutrition. Assessments took place at baseline, 10-weeks
(post-intervention) and 9-months follow-up. The primary outcome was the children’s mean steps/day at 10-weeks.
Secondary outcomes included: co-physical activity, fathers’ physical activity levels and parenting practices for physi‑
cal activity and screen time behaviours, children’s fundamental movement skill (FMS) proficiency, plus accelerometer
based light physical activity (LPA) and moderate-to-vigorous physical activity (MVPA), screen time and adiposity for
fathers and children. Process measures included; attendance, satisfaction, fidelity and retention. Linear mixed models
estimated the treatment effect at all time-points for all outcomes.
Results: Intention-to-treat analyses revealed a significant group-by-time effect for steps per day at 10-weeks (+ 1417,
95%CI: 449, 2384) and 9-months follow-up (+ 1480, 95%CI: 493, 2467) in intervention children compared to control.
There were also favourable group-by-time effects for numerous secondary outcomes including fathers’ physical activ‑
ity levels, children’s FMS proficiency, and several parenting constructs. No effects were observed for both fathers’ and
*Correspondence:
1
School of Education, College of Human and Social Futures, University
of Newcastle, Callaghan, NSW 2308, Australia
Full list of author information is available at the end of the article
© The Author(s) 2022. Open Access This article is licensed under a Creative Commons Attribution 4.0 International License, which
permits use, sharing, adaptation, distribution and reproduction in any medium or format, as long as you give appropriate credit to the
original author(s) and the source, provide a link to the Creative Commons licence, and indicate if changes were made. The images or
other third party material in this article are included in the article’s Creative Commons licence, unless indicated otherwise in a credit line
to the material. If material is not included in the article’s Creative Commons licence and your intended use is not permitted by statutory
regulation or exceeds the permitted use, you will need to obtain permission directly from the copyright holder. To view a copy of this
licence, visit http://creativecommons.org/licenses/by/4.0/. The Creative Commons Public Domain Dedication waiver (http://creativeco
mmons.org/publicdomain/zero/1.0/) applies to the data made available in this article, unless otherwise stated in a credit line to the data.
Morgan et al. BMC Public Health
(2022) 22:1166
Page 2 of 16
children’s accelerometer based LPA or MVPA, co-physical activity, screen-time and adiposity measures. Process evalua‑
tion data revealed very high levels of satisfaction, attendance, retention, and intervention fidelity.
Conclusion: Engaging fathers in a lifestyle program is a promising strategy to increase physical activity among
preschool-aged children. Additional benefits to fathers’ physical activity levels, children’s FMS proficiency and parent‑
ing practices further support the importance of engaging fathers to improve family health outcomes.
Trial Registration: Australian New Zealand Clinical Trials Registry: ACTRN12619000105145. Registered 24/01/2019.
Keywords: Physical Activity, Fathers, Preschool-aged children, Parenting, Intervention
Background
Early childhood is a critical time to establish healthy
lifestyle behaviour patterns and reduce the risk of later
obesity in children [1]. It is a period of rapid physical and cognitive development where children’s habits
are formed and the family’s lifestyle habits are open to
change [2]. Engagement in physical activity and healthy
eating habits in early life is associated with favourable
health outcomes, such as improvement to adiposity [3],
bone and skeletal health [4], cardio-metabolic health [3,
4], motor skill development [4, 5], psychosocial health
[3] and cognitive development [5, 6]. This can result in
sustained benefits as lifestyle behaviours developed in
early life can persist throughout the life course [7, 8].
Despite this, global estimates suggest that 40 million
children under the age of 5 years had overweight or
obesity in 2016 [9, 10]. This is likely due to increased
engagement in obesity-promoting behaviours, such as
physical inactivity [11, 12] and energy-dense, nutrientpoor (EDNP) food consumption [13], which are now
commonplace in early childhood (0–5 years of age). In
Australia, only 17% of preschool-aged children meet
physical activity and screen-time guidelines [11], less
than 1% meet the recommended vegetable intake [14]
and EDNP foods account for around one third of total
energy intake [13].
In response, numerous heathy lifestyle programs
have targeted preschool-aged children. A recent metaanalysis of 34 interventions in children aged 0–5 years
found a small but significant positive effect for objectively assessed moderate to vigorous physical activity (MVPA), with a mean difference of 2.9 min per
day (95%CI: 1.5, 4.2) [15]. However, only 21% of the
included interventions were delivered in community/
home-based settings and only 32% involved parents.
This is a concern as parents’ beliefs, behaviours, and
parenting practices have a critical impact on children’s
physical activity and other lifestyle behaviours [16, 17].
As such, the review put forth a key recommendation
for practitioners and policymakers to focus on changing parent practices to affect change in children’s physical activity levels [15].
A criticism of family-based interventions has been
the lack of engagement of fathers. Specifically, fathers
accounted for just 6% of participating parents from a
review of 213 family-based programs that target children’s’ lifestyle behaviours [18]. Despite this, fathers’ play
an integral role in promoting health behaviours, especially healthy eating practices [19] and physical activity
[20, 21]. A systematic review of 23 studies found fathers’
eating habits to be strongly associated with a child’s
dietary intake [19]. This is supported by another review
which showed the interactions at mealtimes between
fathers’ and children to positively influence children’s
long-term eating behaviour [22]. In addition, fathers’ are
often more likely to initiate co-participation in physical
activity with their children [23, 24] and take part in physical play (e.g., play wrestling) compared with mothers.
This physical play often begins in early childhood and the
vigorous and stimulating nature of this playstyle can help
to improve children’s strength and physical fitness [25].
Furthermore, due to fathers’ increased opportunities and
reinforcement to practice sports skills throughout life,
they tend to provide a better model of sports skill performance [26–28]. Co-participation in physical activity
is a core context for fathers to bond with their children
and can lead to a multitude of benefits for children. This
includes benefits to physical health, quality of the fatherchild relationship and children’s’ social-emotional wellbeing [29, 30].
Given the reported holistic benefits of father-child cophysical activity in early life and the importance of engaging parent’s in their children’s healthy lifestyle behaviours,
we developed ‘Healthy Youngsters, Healthy Dads’
(HYHD), the first lifestyle program internationally, that
specifically targets fathers and preschool-aged children to
improve their physical activity levels. In adhering to the
first phase of the Australian Sax Institute’s Translational
Research Framework [31], we undertook a feasibility
trial of HYHD and demonstrated excellent recruitment,
attendance, acceptability, retention, program administration, and promising preliminary intervention outcomes
in 24 father/preschool-child dyads [32]. The next phase of
the Translational Research Framework is to test the efficacy of the program. Therefore, the primary aim of this
Morgan et al. BMC Public Health
(2022) 22:1166
randomised controlled trial (RCT) was to test the efficacy
of the HYHD program on physical activity (steps/day) of
preschool-aged children at the end of the intervention
(10-weeks post-baseline). We hypothesised that intervention children would demonstrate significantly greater
increases in physical activity at post-intervention (10weeks) compared to children in the control group. The
secondary aim was to test the impact on various secondary outcomes including: (i) days/week participating in cophysical activity, (ii) fathers’ physical activity levels, (iii)
fathers’ physical activity and screen time parenting practices, (iv) children’s fundamental movement skill (FMS)
proficiency (v) fathers’ and children’s screen-time, (vi)
fathers’ and children’s accelerometer based MVPA and
(vii) fathers’ and children’s weight status and body composition. The third aim was to test if any impact was sustained at long-term follow-up (9 months post-baseline).
The final aim was to assess acceptability of the program
through process evaluation (attendance, satisfaction,
fidelity and retention). Diet, social-emotional wellbeing
and additional parenting outcomes were also collected
but will be reported elsewhere.
Methods
Study design
The ‘Healthy Youngsters, Healthy Dads’ (HYHD) program was a parallel-group, two-arm Randomised Controlled Trial (RCT) conducted at the University of
Newcastle, Australia. In January 2019, family units
(fathers and their preschool-aged child) were randomised
in a 1:1 ratio to either (i) the HYHD intervention (treatment), or (ii) a waitlist control group. The study received
institutional ethics approval (H-2017–0381) and was prospectively registered with the Australian New Zealand
Clinical Trials Registry (ACTRN12619000105145). Written informed consent was obtained from all fathers prior
to enrolment as well as child assent. The conduct of the
study aligned with the CONSORT Statement [33].
Participants
Between 27th November 2018 to 1
8th January 2019 families were recruited from the Newcastle region in New
South Wales, Australia. The primary recruitment strategies included; a University media release, which featured
in several local news outlets (e.g., television, radio and
newspaper), distribution of flyers to local early childcare centres, social media posts (Facebook, Instagram
and Twitter) and emails to participants of previous University programs. Eligibility criteria for the HYHD program included: were a biological father, step-father, or
male guardian of a child aged 3–5 years, lived with their
child at least 50% of the week, were able to attend all
assessments, indicated availability for program sessions
Page 3 of 16
and able to pass a pre-exercise screening questionnaire
for physical activity. Fathers who indicated pre-existing
health conditions were required to obtain a doctor’s
clearance prior to being accepted to the program. Children were eligible for the program if they were of preschool age (3–5 years) and not attending primary school
(Kindergarten – Year 6) in the year of the trial. Only one
child per participating father could take part in the program [32]. Eligible fathers and children were invited to
attend baseline assessments at the University of Newcastle, NSW Australia.
The HYHD itervention
The 8-week HYHD program supported fathers to optimise their parenting practices in relation to physical
activity and nutrition for their preschool-aged children.
The components and content were informed by both
quantitative and extensive formative qualitative research
targeting fathers to improve children’s physical activity
and nutrition [25, 34–37]. Core constructs from social
cognitive (e.g., self-efficacy, goals, social support) and
self-determination (e.g., autonomy, competence, relatedness) theories were incorporated to illicit behaviour
change. Also, a full description of intervention components with associated behaviour change techniques and
targeted theoretical mediators is provided in Supplementary Table 1 (Additional File 1). Briefly, the intervention comprised three main components; (i) fathers-only
workshops, (ii) weekly group sessions for fathers and
children and (iii) an Activity Handbook containing
weekly home tasks. Both the fathers-only workshops and
weekly HYHD sessions were delivered at the University
of Newcastle. Four qualified teachers in Physical Education with prior experience in delivering family programs
were recruited via email to be facilitators of the HYHD
program. Facilitators’ attended training at the University of Newcastle (delivered by PJM). Participants were
offered one of three Saturday morning timeslots, delivered by two facilitators. Some facilitators delivered more
than one session each week.
(i) Fathers-only workshops: Two × 2-h Thursday evening workshops were delivered face-to-face at the
University of Newcastle. The first workshop took
place a few days before the first session with the
children and the second workshop a few days after
this. During the workshops, facilitators presented
evidenced-based strategies fathers could employ to:
i) improve their own lifestyle (physical activity and
diet) behaviours, and ii) enhance their parenting
practices to improve their children’s physical activity, dietary habits, social-emotional well-being and
sports skills. The main topics included: optimising
health in the early years, the unique and powerful
Morgan et al. BMC Public Health
(2022) 22:1166
influence of fathers, SMART goal settings, fundamental movement skills and positive parenting
strategies for healthy physical activity, nutrition
and screen-time behaviours.
(ii) Father-child sessions: Eight × 75-min, weekly group
sessions, delivered face-to-face at the University of
Newcastle in three separate groups with 20 families per group on Saturdays. Each session was comprised of two components in which fathers and
children participated together: (i) a 20-min educational session which alternated weekly topics on
physical activity and healthy eating. The weekly
themes were: rough and tumble play, vegetables,
physical activity, fruit, screens, water and sport
skills. As an engagement strategy, each theme was
linked to one of several, program animal characters
for example, Charlie Chimpanzee (rough and tumble play), and Reg Rhino (Vegetables). (ii) A 55-min
practical session including: rough and tumble play
(e.g., sock wrestle), FMS practise (e.g., catching,
kicking, throwing games) and health-related fitness
(e.g. fitness circuits, shuttle carries). To increase
family support, mothers and non-enrolled siblings
were invited to attend session five and to engage
with program resources (including recordings of
the fathers-only workshop content) at home and
participate in any home-based activities from the
Activity Handbook.
( iii) Home program: families were encouraged to complete weekly tasks as presented in an Activity
Handbook with a choice of activities for fathers
and children to complete at home between sessions
(approx. 15-min time commitment per week).
The activities included: goal setting, FMS practise, physical activity tracking, fathers-only tasks
to reinforce positive parenting practise and home
challenges matching each session theme (e.g., make
a vegetable creature). Families received a Yamax
SW200 pedometer to assist with physical activity monitoring. To provide motivation, children
earned a weekly animal character sticker if they
completed designated home tasks with their father,
and a bonus sticker (e.g., banana, basketball) for
completing more than one activity.
Measures
Assessments were held in January (baseline), March
(10 weeks, post-intervention) and October (9 months,
post-baseline) 2019 at the University of Newcastle, Australia. The primary outcome of the study was the child’s
physical activity levels, measured using the average
daily step count of seven consecutive days of pedometry
Page 4 of 16
(YAMAX SW200 pedometers; Corporation, Kumamoto
City, Japan) at 10-weeks. This measure has been validated
in preschool-aged children [38, 39] and adults [40]. Participants were asked to wear the pedometer during all
waking hours (except when it could get wet or damaged)
and to record steps on a log sheet for seven consecutive
days. Children were provided with stickers as a motivation to wear their monitors. Daily step count averages
were considered a valid recording day and included in the
final analysis, if the children had worn the pedometer in
the correct position, had completed at least 3 weekdays
and 1 weekend day of pedometry, and had reported steps
correctly (e.g., reported actual step counts rather than
numbers rounded to nearest 1000). Specifically, only one
control participant at 10-weeks failed to meet the criteria by not reporting a weekend day, while one intervention participant at 9-months wore the pedometer in an
incorrect position and another intervention participant
at 9-months incorrectly rounded steps to the nearest
thousand. Participants recorded any additional physical
activity undertaken, including the duration and intensity, when not wearing the pedometer (e.g., swimming).
This was converted to steps using a standardised formula,
based on guidelines for children (e.g., 10 min of moderate-to-vigorous intensity physical activity = 1,200 steps)
[41]. These additional steps were added to the pedometer step count for an adjusted secondary analysis. Postintervention assessments were completed in the week
after the final session. A detailed description of all other
secondary outcomes are provided in Table 1.
Demographic information included participant age
and fathers’ self-reported employment status, education level, country of birth, ethnicity and marital status.
Socioeconomic status was determined using the Australian postal area index of relative socioeconomic advantage
and disadvantage [55]. Although assessors were blinded
at baseline, this was not achieved for all assessments at
follow-up (e.g., participants occasionally wore program
shirts to the assessments).
Sample size
The sample size was based on the primary outcome of
the child’s physical activity measured using pedometers.
Sixty children in each group was calculated to give the
study 80% power to detect a 1,500-step-per-day difference in physical activity change at post-intervention
(p < 0.05), assuming an attrition rate of 15%. A sample
size of 120 children was required, based on a predicted
change score standard deviation of 2700 steps/day. These
values were derived from step-count change among children who participated in the Healthy Youngsters, Healthy
Dads feasibility study [32]. The study was not powered
a-priori to detect changes in the secondary outcomes.
Morgan et al. BMC Public Health
(2022) 22:1166
Page 5 of 16
Table 1 Secondary outcomes measured in ‘Healthy Youngsters, Healthy Dads’ study
Measure
Description
Fathers and children
Physical activity (accelerometer – LPA and MVPA) subgroup
of 50 Fathers and children
• For every sequential block of 12 families that complete assessments, 5 were randomly
allocated at baseline assessments to complete this measure
• One week of wrist-worn accelerometry using wGT3X-BT ActiGraph accelerometers (Acti‑
graph, Pensicola, FL, USA) were used to assess light physical activity (LPA) and moderateto-vigorous physical activity (MVPA) as average minutes per day. Data were downloaded
and analysed using ActiLife version 6.13.4 (Actigraph, Pensacola, FL, USA)
Cut points and minimum wear-time:
• Preschool-aged children: Johansson [42] = sedentary ≤ 89 vertical counts (Y) and ≤ 221
vector magnitude (VM) counts per 5 s and ≥ 440 Y counts and ≥ 730 VM counts per 5 s for
high-intensity physical activity. Minimum wear-time of 3 days, 7 h/day [43]
• Fathers: Montoye et al. [44] = VM count cut-points; < 2,860 counts/min (sedentary);
2,860–3,940 counts/min (light); and ≥ 3,941counts/min (moderate-to-vigorous (MVPA).
Minimum wear time of 4 days/ 7 h [43]
Father-child co-physical activity
• 2-items adapted from the Youth Media Campaign Longitudinal Survey [45]
• Fathers reported on days per week they were physically active with their child one-onone and with one or more family member
Weight
• Measured in light clothing, without shoes on a digital scale to 0.01 kg (model CH-150kp,
A&D Mercury Pty Ltd, Australia)
• Weight was recorded at least twice until two measures fell within a range of 0.1 kg, aver‑
aged for the analysis
Height
• Measured using the stretch stature method on an electronic stadiometer to 0.1 cm
(model BSM370, Biospace, USA)
• Height was recorded at least twice until two measures fell within a range of 0.3 cm, aver‑
aged for the analysis
BMI
• Calculated using the standard formula, weight (kg)/height in m2
• Children’s BMI-z scores were calculated using age- and sex-adjusted standardized scores
(z-scores) based upon the UK reference data [46] and LMS methods [47]
• International Obesity Task Force cut points were used to determine overweight or
obesity [48]
Body composition
• InBody720 bioelectrical impendence analyser, a multi-frequency bioimpedance device
(Biospace Co., Ltd, Seoul, Korea) [49]
Fathers only
Physical Activity (Steps/day)
• One week of pedometry using Yamax SW200 pedometers (Yamax Corporation, Kuma‑
moto City, Japan). Validated in adults [40]
• Asked to wear all waking hours (except when it could get wet or damaged) and to
record steps on a log sheet for seven consecutive days
• Daily step count averages were included in the final analysis if they had completed at
least 4 days (3 weekdays and 1 weekend day) of pedometry
Self-reported Moderate-to-vigorous physical activity (MVPA) • Average weekly MVPA measured using modified version of the Godin Leisure Time
Exercise Questionnaire [50]
• Participants reported average weekly bouts of moderate and vigorous physical activity
and average bout length [51]. Values in each category were multiplied and summed to
give an overall measure of weekly MVPA
Physical Activity Role Modelling
• Explicit role modelling scale (5-items) from the Activity Support Scale [52]
• Internal consistency coefficients has been found to be acceptable for the role model‑
ling subscale among Caucasian parents (α = 0.88) [52]. In the current sample, the internal
consistency was: α = 0.85
Screen time
• Adapted version of the Adolescent Sedentary Activity Questionnaire [53]
• Fathers reported the total time they spent sitting using screens (of any kind) for anything
outside of work on each day in the previous week
• This adapted measure has shown good sensitivity to change in previous behaviour
change research [36]
Screen time parenting practices
• Assessed with two questionnaires created for the purpose of the study
• 1. Screens other than TV represents use of devices other than TV in different contexts
(e.g., at a social event, at a restaurant) (total of 7-items). Internal consistency for the cur‑
rent sample was: α = 0.71
• 2. Screens as reward is a single item questionnaire asking fathers if they offered screen
based entertainment as a reward for good behaviour
Morgan et al. BMC Public Health
(2022) 22:1166
Page 6 of 16
Table 1 (continued)
Measure
Description
Children only
Object Control Fundamental Movement Skill Competency
• Assessed with seven object control skills described in the validated Test of Gross Motor
Development (kick, catch, two-handed and one-handed strike, dribble and overhand and
underhand throw [TGMD-3]) [54])
• After watching two live demonstrations, children were filmed performing each skill
twice and received a score of 0 or 1 for the presence or absence of various performance
criteria (e.g., ball is caught by hands only)
• Combined scores for both attempts across all skills represented the overall object
control score
Screen time (Mother proxy)
• Adapted version of the Adolescent Sedentary Activity Questionnaire [53]
• Mother reported the total time their child spent sitting using screens (of any kind) on
each day in the previous week
• This adapted measure has shown good sensitivity to change in previous behaviour
change research [36]
Process measures
Attendance
• Attendance rate at Fathers-only workshops
• Attendance rate across all eight sessions for fathers and children
Program satisfaction
• Process questionnaire developed to determine overall perceptions of program by
fathers
• Questions were focused on program structure and timing, quality of facilitators, quality
of program, quality of program resources (e.g., Activity Handbook), impact of program on
behaviour and satisfaction levels
• A 5-point Likert scales from 1 (strongly disagree or poor) to 5 (strongly agree or excel‑
lent) was used
Fidelity
• Process questionnaire developed for the study to determine overall perceptions of
facilitators
• Completed by program facilitators
• Questions focused on delivery of content for all sessions (e.g., There was sufficient time to
get through all the content) and perceptions of enjoyment from father and child (e.g., The
youngsters enjoyed the practical session)
• A 5-point Likert scale from 1 (strongly disagree) to 5 (strongly agree) was used
• Number and % of practical sessions with all required content delivered. Facilitators were
asked to indicate any sessions where they were unable to deliver as intended (e.g., “If you
were unable to complete any rough and tumble activities, please tick the activities you missed
below”)
We did not conduct multiplicity adjustments for these
secondary outcomes as they were intended to complement the primary outcome data and provide preliminary
insights for definitive hypothesis testing in future studies
[56]. In this exploratory context, p values < 0.05 for secondary outcomes were interpreted as suggestive, rather
than significant effects.
Randomisation
The randomisation allocation sequences were generated
by a statistician using a computer-based random number
producing algorithm. Randomisation was stratified by
i) a proxy self-reported (father-reported) child physical
activity level (above or below median) at baseline assessment [57] and ii) physical activity measurement condition (pedometer only, or pedometer plus accelerometer)
to split the sub-sample of participants with accelerometer measured MVPA across the two groups. To note;
budgetary constraints meant accelerometer assessments of MVPA were completed on a small sub-sample.
After baseline assessments were completed and the
data required for stratification was available, all families
were randomised after completing baseline assessments.
Details of the group assignment were emailed to the
family using a standardised template. Complete separation was achieved between the statistician who generated the randomisation sequence, those who concealed
allocation and from those involved in implementation of
assignments.
Statistical analysis
All data analyses were conducted using SPSS 26 (IBM
Corp., Armonk: NY). All variables were checked for
accuracy, missing values and meeting the assumption of
normality. Data are presented as mean (SD) for continuous variables and as counts (percentages) for categorical
variables. Baseline characteristics for each group were
assessed using independent t-tests for continuous variables and chi-squared (χ2) tests for categorical variables.
Linear mixed models were used to assess all outcomes
Morgan et al. BMC Public Health
(2022) 22:1166
for the impact of group (treatment and control), time
(treated as categorical with levels baseline, 10 weeks,
and 9 months) and the group‐by‐time interaction. Linear
mixed models utilise a custom hypothesis test, ensuring adjustment for baseline values in analysis. Analyses
included all randomised participants in line with the
intention-to-treat principle. Missing data, assumed to
be missing at random (MAR), were statistically modelled
using a likelihood-based analysis that included all available data. Age, socioeconomic status and sex (child participants only) were examined as covariates to determine
whether they contributed significantly to the models. If a
covariate was significant, two‐way interactions with time
and treatment were also examined and all significant
terms were added to the final model. To deal with outliers, standardised values (z scores) were created. Variables
which had standardised scores above 3.29 were truncated to a value 1 unit greater than the next lowest value
for that variable [58]. Effect sizes were calculated using
Cohen d (d = M1-M2/σ pooled). Two sensitivity analyses
were also conducted:
1. Completers’ analyses for participants who completed
all measures at the three assessment time points
(baseline, 10 weeks and 9 months).
2.Per‐protocol analyses of HYHD intervention participants who complied well with the assigned treatment
compared with control group. ‘Per-protocol’ was
defined prior to commencing the trial in the clinical trials registry (ACTRN12619000105145) as those
that attended at least 75% of the sessions and completed at least 75% of the home-based tasks (measured by completing an average of 4.5/6 home tasks in
the Activity Handbook each week).
Results
Participant flow
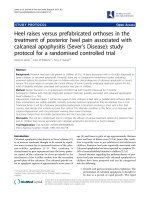
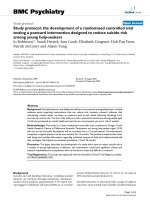
Figure 1 illustrates the flow of participants through the
trial. A total of 181 fathers were assessed for eligibility. In
total, 125 fathers and their children completed baseline
assessments and were randomised by family unit. Overall, 88% of the dyads were retained at 10 weeks post baseline assessments (n = 110) and 87% at 9 months follow-up
(n = 109). Follow-up data were obtained for the primary
outcome (pedometer steps in children) from 82% of children at 10 weeks post baseline assessments (n = 103) and
78% at 9 months (n = 97). Fathers and children who did
not return for follow-up assessments were not significantly different to those who returned for most demographic variables or baseline study outcomes (p > 0.05).
The only exception was a greater reported baseline
screen time use among fathers who returned versus those
Page 7 of 16
who did not return at 9-months (p < 0.001). For the accelerometer based sub-sample for LPA and MVPA, fathers
were required to reach at least 10 h of valid wear time on
at least 4 days per week, while children were required to
reach at least 7 h of valid wear time on at least 3 days per
week. At baseline, this threshold was met by 43 fathers
(86%) and 42 children (84%). At 10-weeks 46 of the 50
families provided accelerometer data and of these 37
fathers (80%) and 39 children (85%) met the wear-time
requirements. At 9-months 42 of the 50 families provided
accelerometer data and of these 33 fathers (79%) and 35
children (83%) met the wear-time requirements.
Baseline data
The baseline characteristics of the fathers and children
are presented in Table 2. Fathers’ mean (SD) age was
38.0 years (5.4) and mean BMI was 28.1 (4.9). Overall,
33% of the fathers were living with obesity (BMI ≥ 30 kg/
m2). The mean (SD) age of children was 3.9 (0.5) years,
61% were boys and mean BMI z-score was 0.32 (0.89),
with 26% of the sample at risk of becoming overweight.
The average daily step counts at baseline were 8263
(2913) and 8837 (2653) for fathers and their children
respectively.
Primary outcome
As outlined in Table 3, children’s mean physical activity levels significantly increased by 1895 steps/day in
the HYHD group at 10 weeks (post-intervention), compared with 478 steps/day in the control group (difference
between groups = 1417 steps/day, 95% CI: 449 to 2384,
d = 0.5). The significant effect was sustained at 9-months
(difference between groups = 1480 steps/day, 95% CI:
493 to 2467, d = 0.6). In addition, results were consistent with those produced in both the completers and perprotocol analyses (see Supplementary Tables 2 and 3 in
Additional File 1).
Secondary outcomes
There were significant intervention effects for fathers’
physical activity levels at 10-weeks (post –intervention), with an increase of 850 steps/day, compared with
-177 steps/day in the control group (difference between
groups = 1027 steps/day, 95% CI: 157 to 1897, d = 0.4).
Outcomes for adjusted pedometer step counts (step
counts increased to include equivalent steps for documented activity completed without wearing the pedometer e.g., swimming) were consistent with those of
unadjusted steps for fathers and children. Significant and
sustained intervention effects (all p < 0.05) were also identified for the physical activity role modelling (10-weeks:
d = 0.58, 9-months: d = 0.54) and fathers’ screen time
Morgan et al. BMC Public Health
(2022) 22:1166
Page 8 of 16
Fig. 1 Participant flow through the trial and analysed for primary outcome data (child steps/day)
parenting practices for: screens as a reward (10-weeks:
d = 0.49, 9-months: d = 0.46).
A large group-by-time effect was detected for children’s
object control FMS competence at post-intervention (difference = 4.5 points, 95% CI: 2.5 to 6.5, d = 0.8), which
was maintained at 9 months (difference = 2.7 points, 95%
CI: 0.6 to 4.8, d = 0.5). There were no significant groupby-time effects at any time point for children or fathers’
LPA (accelerometer sub-sample), MVPA (accelerometer
sub-sample) weight-related outcomes or screen-time,
fathers’ self-reported MVPA and father-child co-physical activity. Findings were consistent with those in the
completers and per-protocol analyses (Supplementary
Tables 2 and 3 in Additional File 1).
Process evaluation
On average, attendance across the eight sessions
for the fathers and children was 86%, while average
attendance for the two fathers-only workshops was
96%. Detailed process scores are provided in Table 4.
Briefly, fathers considered the timing and structure
of the program to be appropriate and overall quality
of the program, resources and facilitators to be high.
On a scale of 1 (poor) to 5 (excellent), fathers reported
Morgan et al. BMC Public Health
(2022) 22:1166
Page 9 of 16
Table 2 Demographic characteristics of study participants
Child
Age (y) (n = 125)
Control (n = 64)
HYHD (n = 61)
Total (n = 125)
Mean
SD
Mean
SD
Mean
SD
3.9
0.5
4.0
0.5
3.9
0.5
Weight (kg) (n = 124)
17.2
2.3
17.7
2.4
17.5
2.4
Height (cm) (n = 124)
103.3
6.3
104.0
5.5
103.6
5.9
6.7
Body fat mass (%) (n = 121)
17.6
5.7
17.8
7.7
17.7
Body Mass Index (kg/m2) (n = 124)
16.1
1.1
16.3
1.4
16.2
1.3
Body Mass Index z-score (n = 124)
0.2
0.8
0.4
1.0
0.3
0.9
Physical activity (steps per day) (n = 114)
9595.9
2596.6
8051.6
2499.2
8837.3
2653.7
n
%
n
%
n
%
42
65.6%
34
55.7%
76
60.8%
Sex
Male
Body Mass Index z-score category a (n = 124)
Healthy weight (-2.0 to 1.0)
50
79.4%
41
67.2%
91
73.3%
Risk of overweight (> 1.0)
13
20.6%
19
31.1%
32
25.8%
0.0%
1
1.6%
1
0.8%
Obesity (> 3.0)
0
Fathers
Control (n = 64)
Mean
SD
Mean
SD
Mean
SD
Age (y) (n = 125)
38.4
4.9
37.6
5.9
38.0
5.4
HYHD (n = 61)
Total (n = 125)
Weight (kg) (n = 125)
90.9
17.3
90.9
19.5
90.9
18.3
Height (cm) (n = 125)
179.5
7.5
179.6
7.3
179.6
7.4
8.3
Body fat mass (%) (n = 124)
23.1
8.5
22.3
8.3
22.7
Body Mass Index (kg/m2) (n = 125)
28.2
4.8
28.1
5.1
28.1
4.9
Physical activity (steps per day) (n = 117)
8160.2
2906.3
8368.2
2906.3
8263.3
2913.8
n
%
n
%
n
%
59
92.2%
56
91.8%
115
92.0%
57
89.1%
55
90.2%
112
89.6%
Education level (n = 125)
Post-school qualifications
Employment status (n = 125)
Full-time
Currently attending an education institution (n = 125)
Full-time or Part time
6
9.4%
5
8.2%
11
8.8%
Not a student
58
90.6%
56
91.8%
114
91.2%
Aboriginal or Torres Strait Islander (n = 125)
3
4.7%
1
1.6%
4
3.2%
Born in Australia (n = 125)
56
87.5%
53
86.9%
109
87.2%
Relationship status (n = 125)
Single
0
0.0%
2
3.3%
2
1.6%
Married/defacto
63
98.4%
59
96.7%
122
97.6%
Separated
1
1.6%
0
0.0%
1
0.8%
Body Mass Index category (n = 124)
Underweight (< 18.5 kg/m2)
1
1.6%
0
0.0%
1
0.8%
Healthy weight (18.5 to 24.9 kg/m2)
15
23.8%
16
26.2%
31
25.0%
Overweight (25 to 29.9 kg/m2)
29
46.0%
22
36.1%
51
41.1%
Obesity (≥ 30 kg/m2)
19
30.2%
22
36.1%
41
33.1%
Socio-economic status b (n = 125)
1–2 (lowest)
1
1.6%
1
1.6%
2
1.6%
3–4
16
25.0%
18
29.5%
34
27.2%
5–6
26
40.6%
22
36.1%
48
38.4%
7–8
16
25.0%
18
29.5%
34
27.2%
9–10 (highest)
5
7.8%
2
3.3%
7
5.6%
a
BMI-z calculated using the LMS method (World Health Organization growth reference centiles) [59]. bSocio-economic status by population decile for SEIFA Index of
Relative Socio-economic Advantage and Disadvantage[60]
Morgan et al. BMC Public Health
(2022) 22:1166
Page 10 of 16
Table 3 Changes in primary and secondary outcomes for study participants (intention-to-treat)
Outcome
Group
Baseline
10 weeks change from baseline
(Mean, 95% CI)
9 months change from baseline
(Mean, 95% CI)
Mean (SE)
Within groupa
Mean
difference
between
groupsb
p-value
[Cohen’s d]
Within groupc
Mean
difference
between
groupsb
p-value
[Cohen’s d]
Intervention
8043 (342)
+ 1895 (1202,
2588)
+ 1417 (449,
2384)
.004 [0.53]
+ 1996 (1281,
2712)
+ 1480 (493,
2467)
.003 [0.55]
Control
9596 (339)
+ 478 (-197,
1154)
Intervention
8368 (379)
+ 850 (229,
1470)
+ 633 (-254,
1520)
.161 [0.26]
Control
8160 (377)
-177 (-788, 433)
Intervention
10,625 (498)
+ 406 (-571,
1385)
+ 1904 (306,
3503)
0.020 [0.44]
Control
12,095 (492)
-1093 (-2045,
-141)
Intervention
10,104 (479)
+ 217 (-676,
1109)
+ 1046 (-230,
2322)
0.108 [0.30]
Control
9824 (477)
-823 (-1702, 56)
-6 (-28, 16)
0.602 [-0.16]
-4 (-38, 30)
0.823 [-0.07]
+ 2 (-17, 21)
0.823 [0.07]
+ 6 (-20, 33)
0.630 [0.14]
+ 57 (-17, 130)
.132 [0.27]
+ 2.7 (0.6, 4.8)
.011 [0.46]
+ 0.2 (-0.5, 0.9)
.665 [0.08]
Primary Outcome
Steps/day
Children e, h
+ 516 (-164,
1198)
Secondary Outcomes
Steps/day
Father e
+ 1027 (157,
1897)
.021 [0.43]
+ 737 (97,
1376)
+ 104 (-511,
718)
Adjusted steps/dayi
Children e,h
Fathers e
+ 1500 (135,
2865)
0.032 [0.40]
+ 1122 (-28,
2271)
-783 (-1894,
329)
+ 1040 (-212,
2292)
0.103 [0.29]
+ 371 (-548,
1290)
-675 (-1560,
210)
LPA (accelerometer sub-sample) (mins/d)
Children
(n = 43)j
Intervention
249 (7)
-4 (-20, 11)
Control
246 (7)
-2 (-17, 13)
Fathers (n = 45)k Intervention
Control
174 (10)
-54 (-78, -31)
186 (10)
-44 (-66. -22)
-3 (-24, 19)
0.798 [-0.07]
+ 3 (-13, 20)
+ 9 (-6, 24)
-10 (-43, 22)
0.516 [-0.19]
-9 (-35, 16)
-5 (-28, 17)
MVPA (accelerometer sub-sample) (mins/d)
Children
(n = 43)j
Intervention
104 (6)
+ 5 (-8, 18)
Control
108 (6)
+ 9 (-3, 22)
Fathers (n = 45)k Intervention
Control
70 (10)
+ 51 (14, 89)
90 (11)
+ 40 (6, 75)
-4 (-22, 14)
0.636 [-0.15]
+ 22 (8, 36)
+ 20 (7, 32)
+ 11 (-40, 62)
0.665 [0.13]
+ 1 (-19, 21)
-5 (-23, 12)
Self-reported MVPA (mins/wk)
Fathers e
Intervention
140 (26)
+ 61 (17, 105)
Control
174 (25)
+ 1.0 (-43, 44)
+ 60 (-1, 122)
.055 [0.35]
+ 34 (-20, 85)
-24 (-76, 28)
Children’s FMS competence (TGMD)
Object control
score d, f, h
Intervention
8.9 (0.6)
+ 4.7 (3.3, 6.2)
Control
10.6 (0.6)
+ 0.3 (-1.1, 1.7)
+ 4.5 (2.5, 6.5)
.000 [0.79]
+ 7.9 (6.4, 9.3)
+ 5.1 (3.7, 6.6)
Co-physical activity (days/wk)
1-on-1
Family (other
children or
family)
Intervention
1.6 (0.2)
+ 0.9 (0.4, 1.3)
Control
1.3 (0.2)
+ 0.5 (-0.0, 1.0)
Intervention
2.5 (0.2)
+ 0.3 (-0.2, 0.8)
Control
2.3 (0.2)
+ 0.1 (-0.4, 0.5)
+ 0.4 (-0.3, 1.1)
.252 [0.21]
+ 0.4 (-0.1, 0.9)
+ 0.2 (-0.3, 0.7)
+ 0.2 (-0.4, 0.9)
.470 [0.13]
+ 0.03 (-0.4, 0.5) + 0.05 (-0.6, 0.7) .879 [0.03]
-0.02 (-0.5, 0.5)
Fathers’ role modelling
Physical Activity Intervention
Control
2.7 (0.1)
+ 0.4 (0.2, 0.5)
2.7 (0.1)
+ 0.1 (-0.0, 0.2)
+ 0.3 (0.1, 0.5)
.001 [0.58]
+ 0.3 (0.2, 0.5)
+ 0.0 (-0.1, 0.2)
+ 0.3 (0.1, 0.5)
.003 [0.54]
Morgan et al. BMC Public Health
(2022) 22:1166
Page 11 of 16
Table 3 (continued)
Outcome
Group
Baseline
10 weeks change from baseline
(Mean, 95% CI)
9 months change from baseline
(Mean, 95% CI)
Mean (SE)
Within groupa
Mean
difference
between
groupsb
p-value
[Cohen’s d]
-0.3 (-0.6, -0.1)
.007 [0.49]
Within groupc
Mean
difference
between
groupsb
p-value
[Cohen’s d]
-0.6 (-0.8, -0.4)
-0.3 (-0.6, -0.1)
.011 [0.46]
-0.1 (-0.3, 0.1)
.208 [0.23]
3.9 (-11.4, 19.3)
.614 [0.09]
-6.3 (-25.1, 12.5)
.509 [0.12]
-0.11 (-0.24,
0.18)
.092 [0.30]
-0.1 (-0.4, 0.2)
.548 [0.10]
-1.4 (-3.7, 0.9)
.232 [0.22]
-0.2 (-1.0, 0.7)
.687 [0.07]
Screen time parenting practices
Fathers’ screen
as reward e, f
Intervention
2.4 (0.1)
-0.6 (-0.7, -0.4)
Control
2.3 (0.1)
-0.3 (-0.4, -0.1)
1.6 (0.7)
-0.4 (-0.5, -0.2)
1.6 (0.1)
-0.1 (-0.2, 0.0)
Intervention
87.5 (6.5)
-15.9 (-26.8,
-5.1)
Control
100.6 (6.5)
-15.8 (-26.8,
-4.9)
Intervention
124.1 (6.7)
-25.2 (-38.1,
-12.4)
Control
108.0 (6.6)
-8.6 (-21.5, 4.3)
0.41 (0.11)
-0.01 (-0.09,
0.09)
0.24 (0.11)
+ 0.00 (-0.09,
0.09)
Fathers’ screens Intervention
other than TV f, g Control
-0.3 (-0.5, -0.1)
-0.2 (-0.4, -0.1)
.010 [0.47]
-0.2 (-0.4, -0.1)
-0.1 (-0.3, -0.0)
Screen time (average mins/day)
Children e
(mother proxy)
Fathers e
-0.1 (-15.5, 15.3)
.989 [0.20]
-6.4 (-17.1, 4.4)
-10.3 (-21.3, 0.7)
-16.6 (-34.8, 1.5)
.073 [0.32]
-12.9 (-25.9, 0.3)
-6.6 (-19.9, 6.9)
Weight status
Children (BMI-z) Intervention
Control
Fathers (BMI)
Intervention
28.0 (0.6)
-0.3 (-0.5, -0.2)
Control
28.1 (0.6)
-0.1 (-0.3, 0.0)
-0.01 (-0.14,
0.12)
.892 [0.03]
+ 0.02 (-0.08,
0.11)
+ 0.13 (0.03,
0.22)
-0.2 (-0.4, 0.0)
.061 [0.35]
+ 0.0 (-0.2, 0.3)
+ 0.1 (-0.1, 0.4)
Fat mass %
Children d
Fathers
Intervention
17.8 (0.9)
-0.3 (-2.0, 1.4)
Control
17.5 (0.8)
-0.8 (-2.4, 0.9)
Intervention
22.3 (1.1)
-0.8 (-1.8, 0.2)
Control
23.2 (1.06)
+ 0.2 (-0.8, 1.2)
+ 0.5 (-1.9, 2.8)
.695 [0.07]
-1.0 (-2.7, 0.6)
+ 0.4 (-1.3, 2.0)
-1.0 (-2.4, 0.5)
.184 [0.24]
+ 0.8 (0.2, 1.4)
+ 1.0 (0.4, 1.6)
Bold denotes a significant difference. BMI body mass index, MVPA moderate-to-vigorous physical activity, CPM counts per minute, TGMD Test of Gross Motor
Development, FMS fundamental movement skills, Co-PA co-physical activity. a10 week value minus baseline; bWithin-group difference (intervention) minus withingroup difference (control); c9 month value minus baseline; dAdjusted for child’s age; eTruncated to account for outliers [58] (> 3.29 SD truncated to next highest value
plus 1) fAdjusted for fathers’ age; gAdjusted for SES; hAdjusted for child’s sex. iAdjusted to include additional activity completed without wearing pedometer (e.g.,
swimming)
j
Minimum wear-time of 3 days, 7 h/day. kMinimum wear-time of 4 days, 10 h/day
a mean (SD) overall program satisfaction score of 4.8
(0.4). Fathers’ mean (SD) satisfaction with the facilitators was 4.9 (0.3).
Detailed fidelity findings are presented in Supplementary Table 4 (Additional File 1). Briefly, on a scale
of 1 (strongly disagree) to 5 (strongly agree), facilitators believed there was sufficient time to deliver all
content in the dads only workshops (mean 5, SD 0.0)
and that fathers were highly engaged in the workshop (mean 5, SD 0.0). On average across the practical sessions involving fathers and children, facilitators
delivered 95% of all the required rough and tumble
activities, 93% of all the fundamental movement skills
activities and 90% of all the fitness activities.
Discussion
To our knowledge, HYHD is the first lifestyle program
internationally that targets fathers and preschool aged
children and only one of a few lifestyle programs targeting fathers [34–36]. Compared with the control group,
HYHD increased the children’s average daily step count
at the primary endpoint (10-weeks) by an additional
1417 steps. This impact was sustained at 9 months
with a between-group difference of 1480 steps per day.
We also identified significant intervention effects for
numerous secondary outcomes including fathers’ physical activity levels, children’s FMS proficiency, and several parenting constructs. There were no significant
differences observed between groups at any time-point
for fathers’ self-reported MVPA or fathers’ and children’s
Morgan et al. BMC Public Health
(2022) 22:1166
Page 12 of 16
Table 4 Process findings as reported by Fathers (n = 55)
Construct
Questions askeda
Mean (SD)
Program structure and timing
The timing of the program (Saturday morning) was convenient
4.5 (0.7)
I felt there was value in having ‘family week’ where mothers/partners and siblings were
invited
4.7 (0.7)
Were approachable and warm
4.9 (0.3)
Were a credible source of information
4.8 (0.4)
Had a high level of knowledge
4.8 (0.4)
Had good communication styles (clear, engaging)
4.8 (0.5)
Were enthusiastic and motivating
4.9 (0.3)
Displayed good rapport with youngsters
4.9 (0.3)
Motivated me to apply the knowledge and principles presented in the program
4.7 (0.5)
Quality of facilitators
Quality of program
Impact of program on behaviour
Overall rating of f acilitatorsb
4.9 (0.3)
The practical activities were appropriate for myself and my youngster
4.6 (0.6)
The practical activities were appropriate for my fitness levels
4.5 (0.6)
The information presented at the Dad’s only workshops were relevant to my life
4.3 (0.7)
The Dad’s only workshops were a worthwhile commitment
4.4 (0.6)
The Dad’s only workshops added value to the rest of the program
4.4 (0.6)
My youngster improved their sport skills as a result of participating in the HYHD program
4.4 (0.7)
Resources (home-based Activity Handbook) The Weekly home tasks checklist was easy to complete
Satisfaction
a
b
4.0 (0.6)
The Weekly home tasks checklist helped me stay on track
4.0 (0.8)
The activities in the Weekly Home Challenges were easy to complete
4.2 (0.6)
The activities in the Weekly Sport Skills Practice were easy to complete
3.7 (0.9)
The Weekly animal character stickers motivated my youngster to complete the weekly
home tasks
4.3 (0.9)
The ‘bonus stickers’ were an additional motivator and encouraged my youngster and I to do
additional activities
3.9 (1.0)
The ’bonus stickers’ were an additional motivator and encouraged my youngster and I to
wear the pedometer once a week
3.8 (1.0)
The (dads and youngster) sessions were enjoyable
4.7 (0.4)
My youngster enjoyed participating in the sessions
4.4 (0.7)
I would recommend the program to my friends
4.5 (0.4)
The Dad’s only workshops were enjoyable
4.2 (0.7)
My youngster enjoyed completing the Weekly Home Challenges
4.4 (0.6)
I enjoyed completing the Weekly Home Challenges with my youngster
4.4 (0.7)
My youngster enjoyed completing the Weekly Sport Skills Practice
4.0 (0.9)
I enjoyed completing the Weekly Sport Skills Practice with my youngster
4.2 (0.7)
My youngster enjoyed collecting the Weekly animal character stickers
4.8 (0.5)
Overall program satisfactionb
4.8 (0.8)
1 = strongly disagree; 2 = disagree; 3 = neutral; 4 = agree; 5 = strongly agree
1 = poor; 2 = fair; 3 = average; 4 = good; 5 = excellent
accelerometer based LPA or MVPA, co-physical activity,
screen time and adiposity measures. Process evaluation
data revealed very high levels of satisfaction, attendance
and retention and the program was delivered as intended
with high fidelity findings reported by facilitators.
The children’s physical activity results are promising
given the paucity of successful physical activity interventions targeting preschool-aged children [15]. The sustained increase of approximately 1500 steps per day in
intervention children compared with control at 9 months
is particularly encouraging, especially as our sample
had low baseline values of physical activity. One study
developed a regression equation which estimated 13,874
daily steps in preschool-aged children to be comparable with the accumulation of 60 min of MVPA [61]. As
such, our baseline value of 8837 steps in the HYHD sample falls substantially below this estimation. Our moderate strength effect size of d = 0.6 at 9 months appears
Morgan et al. BMC Public Health
(2022) 22:1166
to be greater when compared to the standardised mean
effect size from comparable meta-analyses. Specifically,
a meta-analysis of three physical activity interventions in
centre-based childcare settings (children aged 0–6 years)
demonstrated a standardised mean difference of 0.07 for
interventions greater than 6-months and with objective
outcome measures (pedometer steps or accelerometer
determined MVPA) [62]. Another meta-analysis of 15
physical activity interventions for preschoolers had an
effect size of g = 0.44 for general physical activity levels,
assessed with objective and self-report measures (accelerometers, heart rate monitors, pedometers, direct observation, and parent report). However, effect sizes were
much smaller in this meta-analysis when results were
stratified by studies > 12 weeks (Hedges g = 0.18) and in
home based settings (Hedges g = 0.28) [63]. A possible
explanation for the positive effects in HYHD is due to the
program’s adherence to the five key recommendations as
reported from a review of family-based physical activity programs [64]. These included: 1) including children
as agents of change, 2) ensuring sociocultural tailoring
of program, 3) providing education to increase knowledge, 4) targeting social and psychological outcomes and
5) combining goal setting and reinforcement techniques
[64]. Furthermore, by engaging fathers, the HYHD program capitalised on the father-child ‘activation relationship’ which is primarily developed through physical play
[65]. Ultimately, this relationship can heighten the bond
between fathers and children, leading to a range of holistic benefits to children [25, 65].
Our substantive and sustained improvements in
FMS proficiency may have contributed to the children’s physical activity intervention effects. Mastery in
FMS is associated with higher levels of physical activity participation in preschool children [66]. Our FMS
improvement in object control score (mean difference of 4.5 points), which was largely maintained at
9 months (mean difference of 2.7 points) is greater than
has been observed in other programs for preschool
children, with a recent meta-analysis detecting a standardised mean difference of 1.06 (95%CI: 0.46, 1.66) on
object control skills [67]. This is likely due to the oneto-one support from fathers at the HYHD sessions and
at home, which maximises contact time to learn these
skills. Furthermore, as fathers often provide a better
model of sports skill performance [21], children can
learn and mirror the correct technique to optimise proficiency of these skills.
For the paternal physical activity outcomes, we identified significant intervention effects at 10-weeks (+ 1027
steps/day) which were no longer significant at 9 months
(+ 633 steps/day 95%CI: -254, 1520). The slight increase
in steps among the control group (+ 104 steps/day) at
Page 13 of 16
9 months may have attenuated the overall effect. Despite
this, additional strategies may be required for fathers to
maintain these effects long term. Overall, our positive
findings are comparable with those observed in the two
previous interventions that targeted fathers [34–36].
Additionally, the effect size for steps in our study (d = 0.5)
and other trials targeting fathers [34–36] are larger than
reported in most physical activity interventions targeting
men in general [68, 69]. This could be attributed to the
targeted reciprocal reinforcement (e.g., father and children encourage each other be active), valued outcomes
(e.g., enhancing the father-child relationship in addition
to health improvements), and co-physical activity among
the father and child programs.
Our findings suggest that children may have increased
overall steps rather than higher intensity physical activity
due to no intervention effects observed at any time-point
for accelerometer-determined MVPA in a sub-sample of
children (n = 43). This aligns with the focus of the program which was to improve overall physical activity
rather than promoting more vigorous physical activity.
Despite accelerometers being gold standard, budgetary
constraints warranted the use of pedometers as the primary outcome and only measure LPA and MVPA using
accelerometers in a small sub-sample. As such we were
not powered to detect changes in accelerometer based
LPA or MVPA.
The acceptability of HYHD was established through
very high levels of attendance (86% for fathers and
children), retention (78% at 9 months) and satisfaction
(mean overall program satisfaction score of 4.8 out of
5). Our high attendance and retention rates are similar to other programs that targeted the father-child in
the community (“Healthy Dads, Healthy Kids” Community randomized control trial: attendance
= 71%,
retention = 81% [34]) and parent-preschool-aged child
(“MEND 2–4”: attendance = 82%, retention = 86% [70]).
Our high attendance and retention rates may be due to
high participant satisfaction with overall quality of the
program, resources and facilitators. Overall, our high
acceptability shows that fathers and children are willing to engage with behaviour change interventions that
are specifically targeted to suit their unique preferences
and values. This provides further evidence of the potential for socio-culturally targeted interventions to engage
fathers in health research and improve family health
outcomes [71].
Strengths of our study include: successful targeting
and recruitment of fathers and their preschool-aged
children, a randomised controlled design, intentionto-treat analyses, objective physical activity data, follow-up assessments 9 months after baseline and high
retention. Limitations include potential reporting bias
Morgan et al. BMC Public Health
(2022) 22:1166
from self-report measures and skewed participation
towards more active and socioeconomically advantaged fathers and children. Also, a wait-list control
group was used rather than an attention-placebo control group. Therefore, the study was unable to determine whether the HYHD program increased children’s
daily steps above what may have been observed by
increasing father-child interactions in other contexts.
However, due to the scarcity of physical activity interventions targeting fathers and their preschool-aged
children in the literature, the authors believe the decision to use a wait-list control was justified. In addition, the statistical and ethical complexities associated
with designing and implementing attention-placebo
controls for behavioural medicine trials [72] provide
additional justification for this approach. The physical
activity assessment (pedometer steps/day) may have
been somewhat affected by reactivity, as intervention
participants also used a pedometer as part of the intervention. However, we ensured that any weeks where
participants documented their steps for assessment
purposes did not overlap with the action intervention period. There is contradicting evidence regarding
validity of pedometers with preschool children [38, 39,
61, 73, 74]. However, the feasibility of this measure has
been established in this age group [32] and correlation
studies have shown moderate associations with direct
observations and accelerometry [61, 75]. Specifically,
previous research has established convergent validity
of the Yamax SW-200 pedometer (r = 0.73) when compared MTI 7164 ActiGraph accelerometer [13].
Conclusion
This was the first physical activity program internationally targeting fathers to become healthy lifestyle
role models for their preschool-aged children, and vice
versa. The sustained improvements in physical activity
among the children supported the study hypotheses.
In addition, improvements in secondary outcomes further support engaging fathers to improve family health
outcomes. Further research is needed to confirm the
effectiveness and scalability of the program when
delivered in community settings by trained facilitators
to a more diverse range of families.
Abbreviations
HYHD: Healthy Youngsters, Healthy Dads,; FMS: Fundamental Movement Skills,;
MVPA: Moderate-to-Vigorous Physical Activity; LPA: Light Physical Activity;
MPA: Moderate Physical Activity; VPA: Vigorous Physical Activity; BMI: Body
Mass Index; RCT: Randomised Controlled Trial; ITT: Intention to Treat; CI: Con‑
fidence Intervals; CONSORT: Consolidated Standards of Reporting Trials; CPM:
Counts per minute; TGMD: Test of Gross Motor Development; LMS: Least Mean
Square; SEIFA: Socio-Economic Indexes for Areas.
Page 14 of 16
Supplementary Information
The online version contains supplementary material available at https://doi.
org/10.1186/s12889-022-13424-1.
Additional file 1: Supplementary Table 1. Description of intervention
components in the ‘Healthy Youngsters, Healthy Dads’ program. Supplementary Table 2. Changes in primary and secondary outcomes for study
participants (per-protocol). Supplementary Table 3. Changes in primary
and secondary outcomes for study participants (completers). Supplementary Table 4. Facilitator reflections and fidelity findings.
Acknowledgements
The authors would like to thank all of the fathers and preschoolers who
contributed to the study. We would also like to thank undergraduate students
from the University of Newcastle, Yive Yang, Shannon Cook, Prince Atorkey,
Mitchell Eslick, Wei Cong Lim, Bronte Williamson, Briana Barclay, Samantha
Stewart, Josephine Burgess, Chung Jia Yi, Dom Baker, Chole Law, Fong Fu, Jess
Lyn Lim, Jiaqi Kow, Tiffani Jones, and Sheridan Free, for their valued assistance
to the study during data collection. Finally, we would like to thank the
Research Assistants: Rosslyn O’Connor (data collection & input), Lauren Hogg
(data collection & input), Georgia Douglas (data collection), Ryan Drew (data
collection & analysis), Cath Nankervis (data collection), Briana Barclay (data col‑
lection & input), Yive Yang (data collection), Chris Tyrie (data collection), Mac
Daly (data collection).
Authors’ contributions
CRediT Author statement contributions: P.J.M: Conceptualization, Methodology,
Resources, Writing—Review & Editing, Supervision, Project administration,
Funding acquisition. J.A.G: Conceptualization, Methodology, Formal analysis,
Investigation, Resources, Data Curation, Writing Original Draft, Review &
editing, and Project administration. L.M.A: Writing—Original Draft and Formal
analysis. C.E.C: Conceptualization, Methodology, Resources, Writing—Review
& Editing. A.T.B: Conceptualization, Methodology, Resources, Writing—Review
& Editing. E.R.P: Conceptualization, Methodology, Investigation, Resources,
Writing—Review & Editing. S.L.K: Conceptualization, Data Curation, Writing—
Review & Editing, Project administration. A.T.R: Data Curation, Formal analysis
and Writing – Review & Editing. K.L.S: Conceptualization, Methodology,
Investigation, Data Curation, Writing—Review & Editing, Project administra‑
tion, Funding acquisition. RJD: Investigation, Data Curation & Writing—Review
& Editing. M.D.Y: Conceptualization, methodology, investigation, writing
– review & editing, supervision, funding acquisition. The author(s) read and
approved the final manuscript.
Funding
Research reported in this manuscript was supported by Greater Charitable
Foundation (G1700650), Rotary Club Newcastle and Hunter Medical Research
Institute (G1800342). C.E.C. is supported by an Australian National Health
and Medical Research Council Senior Research Fellowship (G1500349) and
a University of Newcastle, Faculty of Health and Medicine, Gladys M. Brawn
Senior Research Fellowship (10.32576). The funding bodies had no role in the
design and conduct of the study; collection, management, analysis, and inter‑
pretation of the data; preparation, review, or approval of the manuscript; and
decision to submit the manuscript for publication. No competing financial
interests exist.
Availability of data and materials
The de-identified data are available from PJM upon reasonable request.
Declarations
Ethics approval and consent to participate
The study received ethics approval from University of Newcastle, Human
Research Ethics Committee (H-2017–0381). Written informed consent was
obtained from all fathers prior to enrolment as well as child assent. All proce‑
dures, including the informed consent process, were conducted in accord‑
ance with the ethical standards of the responsible committee on human
experimentation (institutional and national) and with the Helsinki Declaration
of 1975, as revised in 2008.
Morgan et al. BMC Public Health
(2022) 22:1166
Consent for publication
Not applicable.
Competing interests
The authors have no conflict of interest to report.
Author details
1
School of Education, College of Human and Social Futures, University
of Newcastle, Callaghan, NSW 2308, Australia. 2 Active Living Research Pro‑
gram, Hunter Medical Research Institute, New Lambton Heights, NSW 2305,
Australia. 3 Centre for Active Living and Learning, College of Human and Social
Futures, University of Newcastle, Callaghan, NSW 2308, Australia. 4 College
of Health, Medicine and Wellbeing, School of Health Sciences, University
of Newcastle, Callaghan, NSW 2308, Australia. 5 Food and Nutrition Research
Program, Hunter Medical Research Institute, New Lambton Heights, NSW
2305, Australia. 6 College of Engineering, Science and Environment, School
of Environmental and Life Sciences, University of Newcastle, Ourimbah, NSW
2258, Australia. 7 College of Engineering, Science and Environment, School
of Psychological Sciences, University of Newcastle, Callaghan, NSW 2308,
Australia.
Received: 27 October 2021 Accepted: 6 April 2022
References
1. Report of the commission on ending childhood obesity [https://apps.
who.int/iris/bitstream/handle/10665/204176/9789241510066_eng.pdf?
sequence=1]
2. Guidelines on physical activity, sedentary behaviour and sleep for
children under 5 years of age [https://apps.who.int/iris/bitstream/handle/
10665/311664/9789241550536-eng.pdf?sequence=1&isAllowed=y]
3. Timmons BW, LeBlanc AG, Carson V, Connor Gorber S, Dillman C, Jans‑
sen I, Kho ME, Spence JC, Stearns JA, Tremblay MS. Systematic review
of physical activity and health in the early years (aged 0–4 years). Appl
Physiol Nutr Metab. 2012;37(4):773–92.
4. Carson V, Lee E-Y, Hewitt L, Jennings C, Hunter S, Kuzik N, Stearns JA,
Unrau SP, Poitras VJ, Gray C. Systematic review of the relationships
between physical activity and health indicators in the early years (0–4
years). BMC Public Health. 2017;17(5):854.
5. Veldman SL, Paw MJCA, Altenburg TM. Physical activity and prospective
associations with indicators of health and development in children aged< 5
years: a systematic review. Int J Behav Nutr Phys Act. 2021;18(1):1–11.
6. Carson V, Hunter S, Kuzik N, Wiebe SA, Spence JC, Friedman A, Tremblay
MS, Slater L, Hinkley T. Systematic review of physical activity and cogni‑
tive development in early childhood. J Sci Med Sport. 2016;19(7):573–8.
7. Tammelin R, Yang X, Leskinen E, Kankaanpaa A, Hirvensalo M, Tammelin
T, Raitakari O. Tracking of physical activity from early childhood through
youth into adulthood. Med Sci Sports Exerc. 2014;46(5):955–62.
8. Jones RA, Hinkley T, Okely AD, Salmon J. Tracking physical activity and
sedentary behavior in childhood: a systematic review. Am J Prev Med.
2013;44(6):651–8.
9. Fanzo J, Hawkes C, Udomkesmalee E, Afshin A, Allemandi L, Assery O, Baker
P, Battersby J, Bhutta Z, Chen K: 2018 Global Nutrition Report. In. UK; 2019.
10. Noncommunicable diseases: Childhood overweight and obesity [https://
www.who.int/news-room/q-a-detail/noncommunicable-diseases-child
hood-overweight-and-obesity]
11. Insufficient physical activity [https://www.aihw.gov.au/reports/risk-facto
rs/insuffi cient-physical-activity/contents/insuffi cient-physical-activity]
12. Hnatiuk JA, Salmon J, Hinkley T, Okely AD, Trost S. A review of preschool
children’s physical activity and sedentary time using objective measures.
Am J Prev Med. 2014;47(4):487–97.
13. Australian Health Survey: Nutrition First Results—Foods and Nutrients,
2011–12ABS cat. no. 4364.0.55.007 [https://www.abs.gov.au/statistics/
health/health-conditions-and-risks/australian-health-survey-nutrition-
first-results-foods-and-nutrients/latest-release]
14. Nutrition across the life stages [https://www.aihw.gov.au/reports/food-
nutrition/nutrition-across-the-life-stages/data]
Page 15 of 16
15. Hnatiuk J, Brown H, Downing K, Hinkley T, Salmon J, Hesketh K. Interven‑
tions to increase physical activity in children 0–5 years old: a systematic
review, meta-analysis and realist synthesis. Obes Rev. 2019;20(1):75–87.
16. Ash T, Agaronov A, Aftosmes-Tobio A, Davison KK. Family-based child‑
hood obesity prevention interventions: a systematic review and quantita‑
tive content analysis. Int J Behav Nutr Phys Act. 2017;14(1):113.
17. Vollmer RL, Adamsons K, Gorin A, Foster JS, Mobley AR. Investigating
the relationship of body mass index, diet quality, and physical activity
level between fathers and their preschool-aged children. J Acad Nutr
Diet. 2015;115(6):919–26.
18. Morgan PJ, Young MD, Lloyd AB, Wang ML, Eather N, Miller A, et al. Involve‑
ment of fathers in pediatric obesity treatment and prevention trials: a
systematic review. Pediatrics. 2017;139:e20162635.
19. Litchford A, Roskos MRS, Wengreen H. Influence of fathers on the feed‑
ing practices and behaviors of children: A systematic review. Appetite.
2020;147:104558.
20. Vollmer RL, Adamsons K, Foster JS, Mobley AR. Association of fathers’
feeding practices and feeding style on preschool age children’s
diet quality, eating behavior and body mass index. Appetite.
2015;89:274–81.
21. Morgan PJ, Young MD. The influence of fathers on children’s physical
activity and dietary behaviors: Insights, recommendations and future
directions. Curr Obes Rep. 2017;6(3):324–33.
22. Rahill S, Kennedy A, Kearney J. A review of the influence of fathers
on children’s eating behaviours and dietary intake. Appetite.
2020;147:104540.
23. Zahra J, Sebire SJ, Jago R. “He’s probably more Mr. sport than me”–a
qualitative exploration of mothers’ perceptions of fathers’ role in their
children’s physical activity. BMC pediatrics. 2015;15(1):1–9.
24. Beets MW, Cardinal BJ, Alderman BL. Parental social support and the
physical activity-related behaviors of youth: a review. Health Educ Behav.
2010;37(5):621–44.
25. Philip J, Morgan MDY, Emma R, Pollock. The Role of Fathers in Optimizing
Children’s Physical Activity. In: Timothy A, Brusseau SJF, Lubans David R,
editors. The Routledge Handbook of Youth Physical Activity edn. New
York: Routledge; 2020. p. 19.
26. Hallal PC, Andersen LB, Bull FC, Guthold R, Haskell W, Ekelund U. Group
LPASW: Global physical activity levels: surveillance progress, pitfalls, and
prospects. The lancet. 2012;380(9838):247–57.
27. Trost SG, Pate RR, Sallis JF, Freedson PS, Taylor WC, Dowda M, Sirard J. Age
and gender differences in objectively measured physical activity in youth.
Med Sci Sports Exerc. 2002;34(2):350–5.
28. Telford RM, Telford RD, Olive LS, Cochrane T, Davey R. Why are girls less
physically active than boys? Findings from the LOOK longitudinal study.
PLoS ONE. 2016;11(3):e0150041.
29. Young MD, Lubans DR, Barnes AT, Eather N, Pollock ER, Morgan PJ. Impact of
a father–daughter physical activity program on girls’ social–emotional wellbeing: A randomized controlled trial. J Consult Clin Psychol. 2019;87(3):294.
30. Neshteruk CD, Jones DJ, Skinner A, Ammerman A, Tate DF, Ward DS.
Understanding the Role of Fathers in Children’s Physical Activity: A Quali‑
tative Study. J Phys Act Health. 2020;17(5):540–7.
31. Translational Research Framework: Testing innovation in policy, programs
and service delivery [https://www.saxinstitute.org.au/wp-content/uploa
ds/Translational-Research-Framework.pdf ]
32. Morgan PJ, Collins CE, Barnes AT, Pollock ER, Kennedy S-L, Drew RJ,
Saunders KL, Grounds JA, Rayward AT, Young MD. Engaging Fathers
to Improve Physical Activity and Nutrition in Themselves and in Their
Preschool-Aged Children: The “Healthy Youngsters, Healthy Dads” Feasibil‑
ity Trial. J Phys Act Health. 2021;18(2):175–84.
33. Schulz KF, Altman DG, Moher D. CONSORT 2010 statement: updated
guidelines for reporting parallel group randomized trials. Ann Intern Med.
2010;152(11):726–32.
34. Morgan PJ, Collins CE, Plotnikoff RC, Callister R, Burrows T, Fletcher R,
Okely AD, Young MD, Miller A, Lloyd AB. The ‘Healthy Dads, Healthy Kids’
community randomized controlled trial: A community-based healthy
lifestyle program for fathers and their children. Prev Med. 2014;61:90–9.
35. Morgan PJ, Lubans DR, Callister R, Okely AD, Burrows TL, Fletcher R, Collins
CE. The ‘Healthy Dads, Healthy Kids’ randomized controlled trial: efficacy
of a healthy lifestyle program for overweight fathers and their children.
Int J Obes. 2011;35(3):436–47.
Morgan et al. BMC Public Health
(2022) 22:1166
36. Morgan PJ, Young MD, Barnes AT, Eather N, Pollock ER, Lubans DR. Engag‑
ing fathers to increase physical activity in girls: the “dads and daughters
exercising and empowered”(DADEE) randomized controlled trial. Ann
Behav Med. 2019;53(1):39–52.
37. Morgan PJ, Young MD, Smith JJ, Lubans DR. Targeted health behavior
interventions promoting physical activity: a conceptual model. Exerc
Sport Sci Rev. 2016;44(2):71–80.
38. Louie L, Chan L. The use of pedometry to evaluate the physical activity
levels among preschool children in Hong Kong. Early Child Dev Care.
2003;173(1):97–107.
39. Oliver M, Schofield GM, Kolt GS, Schluter PJ. Pedometer accuracy in
physical activity assessment of preschool children. J Sci Med Sport.
2007;10(5):303–10.
40. Silcott NA, Bassett DR Jr, Thompson DL, Fitzhugh EC, Steeves JA. Evaluation
of the Omron HJ-720ITC pedometer under free-living conditions. Med Sci
Sports Exerc. 2011;43(9):1791–7.
41. Tudor-Locke C, Craig CL, Beets MW, Belton S, Cardon GM, Duncan S, Hatano
Y, Lubans DR, Olds TS, Raustorp A. How many steps/day are enough? for
children and adolescents. Int J Behav Nutr Phys Act. 2011;8(1):1–14.
42. Johansson E, Ekelund U, Nero H, Marcus C, Hagströmer M. Calibration and
cross-validation of a wrist-worn A ctigraph in young preschoolers. Pediatr
Obes. 2015;10(1):1–6.
43. Troiano RP, Berrigan D, Dodd KW, Masse LC, Tilert T, McDowell M. Physical
activity in the United States measured by accelerometer. Med Sci Sports
Exerc. 2008;40(1):181.
44. Montoye AH, Clevenger KA, Pfeiffer KA, Nelson MB, Bock JM, Imboden MT,
Kaminsky LA. Development of cut-points for determining activity intensity
from a wrist-worn ActiGraph accelerometer in free-living adults. J Sports Sci.
2020;38(22):2569–78.
45. Lee SM, Nihiser A, Strouse D, Das B, Michael S, Huhman M. Correlates of
children and parents being physically active together. J Phys Act Health.
2010;7(6):776–83.
46. Cole TJ, Freeman JV, Preece MA. Body mass index reference curves for the
UK, 1990. Arch Dis Child. 1995;73(1):25–9.
47. Onis Md. Onyango AW, Borghi E, Siyam A, Nishida C, Siekmann J: Develop‑
ment of a WHO growth reference for school-aged children and adolescents.
Bull World Health Organ. 2007;85:660–7.
48. Cole TJ, Bellizzi MC, Flegal KM, Dietz WH. Establishing a standard definition
for child overweight and obesity worldwide: international survey. BMJ.
2000;320(7244):1240.
49. Fujii K, Ishizaki A, Ogawa A, Asami T, Kwon H, Tanaka A, Sekiya N, Hironaka
S. Validity of using multi-frequency bioelectrical impedance analysis
to measure skeletal muscle mass in preschool children. J Phys Ther Sci.
2017;29(5):863–8.
50. Godin G, Shephard R. A simple method to assess exercise behavior in the
community. Can J Appl Sport Sci. 1985;10(3):141–6.
51. Plotnikoff RC, Taylor LM, Wilson PM, Courneya KS, Sigal RJ, Birkett N, Raine
K, Svenson LW. Factors associated with physical activity in Canadian adults
with diabetes. Med Sci Sports Exerc. 2006;38(8):1526–34.
52. Davison KK, Li K, Baskin ML, Cox T, Affuso O. Measuring parental support
for children’s physical activity in white and African American parents:
the Activity Support Scale for Multiple Groups (ACTS-MG). Prev Med.
2011;52(1):39–43.
53. Hardy LL, Booth ML, Okely AD. The reliability of the adolescent sedentary
activity questionnaire (ASAQ). Prev Med. 2007;45(1):71–4.
54. Webster EK, Ulrich DA. Evaluation of the psychometric properties of the Test
of Gross Motor Development—third edition. J Motor Learning and Dev.
2017;5(1):45–58.
55. Statistics ABo: Census of population and housing: Socio‐economic indexes
for areas (SEIFA). Australian Bureau of Statistics 2011.
56. Bender R, Lange S. Adjusting for multiple testing—when and how? J Clin
Epidemiol. 2001;54(4):343–9.
57. Janz KF, Broffitt B, Levy SM. Validation evidence for the Netherlands physical
activity questionnaire for young children: the Iowa bone development
study. Res Q Exerc Sport. 2005;76(3):363–9.
58. Tabachnic BGFL. Using Multivariate Statistic. 3rd ed. Boston, MA: Allyn &
Bacon; 2001.
59. de Onis M, Onyango AW, Borghi E, Siyam A, Nishida C, Siekmann J. Develop‑
ment of a WHO growth reference for school-aged children and adolescents.
Bull World Health Organ. 2007;85(9):660–7.
Page 16 of 16
60. Australian Bureau Of Statistics. Socio-Economic Indexes for Areas (SEIFA).
Canberra: Australian Bureau of Statistics; 2011.
61. Cardon G, De Bourdeaudhuij I. Comparison of pedometer and accelerom‑
eter measures of physical activity in preschool children. Pediatr Exerc Sci.
2007;19(2):205–14.
62. Finch M, Jones J, Yoong S, Wiggers J, Wolfenden L. Effectiveness of centrebased childcare interventions in increasing child physical activity: a system‑
atic review and meta-analysis for policymakers and practitioners. Obes Rev.
2016;17(5):412–28.
63. Gordon ES, Tucker P, Burke SM, Carron AV. Effectiveness of physical activ‑
ity interventions for preschoolers: a meta-analysis. Res Q Exerc Sport.
2013;84(3):287–94.
64. Brown H, Atkin A, Panter J, Wong G, Chinapaw MJ, Van Sluijs E. Family-based
interventions to increase physical activity in children: a systematic review,
meta-analysis and realist synthesis. Obes Rev. 2016;17(4):345–60.
65. Paquette D. Theorizing the father-child relationship: Mechanisms and
developmental outcomes. Hum Dev. 2004;47(4):193–219.
66. Cliff DP, Okely AD, Smith LM, McKeen K. Relationships between fundamen‑
tal movement skills and objectively measured physical activity in preschool
children. Pediatr Exerc Sci. 2009;21(4):436–49.
67. Van Capelle A, Broderick CR, van Doorn N, Ward RE, Parmenter BJ. Interven‑
tions to improve fundamental motor skills in pre-school aged children: A
systematic review and meta-analysis. J Sci Med Sport. 2017;20(7):658–66.
68. Bottorff JL, Seaton CL, Johnson ST, Caperchione CM, Oliffe JL, More K, JafferHirji H, Tillotson SM. An updated review of interventions that include pro‑
motion of physical activity for adult men. Sports Med. 2015;45(6):775–800.
69. George ES, Kolt GS, Duncan MJ, Caperchione CM, Mummery WK, Van‑
delanotte C, Taylor P, Noakes M. A review of the effectiveness of physical
activity interventions for adult males. Sports Med. 2012;42(4):281–300.
70. Skouteris H, Hill B, McCabe M, Swinburn B, Busija L. A parent-based inter‑
vention to promote healthy eating and active behaviours in pre-school
children: Evaluation of the MEND 2–4 randomized controlled trial. Pediatr
Obes. 2016;11(1):4–10.
71. Young MD, Morgan PJ. Paternal physical activity: an important target
to improve the health of fathers and their children. Am J Lifestyle Med.
2017;11(3):212–5.
72. Pagoto S, McDermott MM, Reed G, Greenland P, Mazor KM, Ockene JK,
Whited M, Schneider K, Appelhans B, Leung K. Can attention control condi‑
tions have detrimental effects in behavioral medicine randomized trials?
Psychosom Med. 2013;75(2):137.
73. McKee DP, Boreham CA, Murphy MH, Nevill AM. Validation of the Digi‑
walker™ pedometer for measuring physical activity in young children.
Pediatr Exerc Sci. 2005;17(4):345–52.
74. Oliver M, Schofield GM, Kolt GS. Physical activity in preschoolers. Sports
Med. 2007;37(12):1045–70.
75. Nishikido N, Kashiwazaki H. SUZUKI T: Preschool children’s daily
activities: direct observation, pedometry or questionnaire. J Hum Ergol.
1982;11(2):214–8.
Publisher’s Note
Springer Nature remains neutral with regard to jurisdictional claims in pub‑
lished maps and institutional affiliations.
Ready to submit your research ? Choose BMC and benefit from:
• fast, convenient online submission
• thorough peer review by experienced researchers in your field
• rapid publication on acceptance
• support for research data, including large and complex data types
• gold Open Access which fosters wider collaboration and increased citations
• maximum visibility for your research: over 100M website views per year
At BMC, research is always in progress.
Learn more biomedcentral.com/submissions