reference curves of birth weight length and head circumference for gestational ages in yogyakarta indonesia
Bạn đang xem bản rút gọn của tài liệu. Xem và tải ngay bản đầy đủ của tài liệu tại đây (3.34 MB, 14 trang )
Haksari et al. BMC Pediatrics (2016) 16:188
DOI 10.1186/s12887-016-0728-1
RESEARCH ARTICLE
Open Access
Reference curves of birth weight, length,
and head circumference for gestational
ages in Yogyakarta, Indonesia
Ekawaty L. Haksari1*, Harrie N. Lafeber2, Mohammad Hakimi3, Endy P. Pawirohartono1 and Lennarth Nyström4
Abstract
Background: The birth weight reference curve to estimate the newborns at risk in need of assessment and
monitoring has been established. The previous reference curves from Indonesia, approximately 8 years ago, were
based on the data collected from teaching hospitals only with limited gestational ages. The aims of the study were
to update the reference curves for birth weight, supine length and head circumference for Indonesia, and to
compare birth weight curves of boys and girls, first child and later children, and the ones in the previous studies.
Methods: Data were extracted from the Maternal-Perinatal database between 1998–2007. Only live singletons with
recorded gestational ages of 26 to 42 weeks and the exact time of admission to the neonatal facilities delivered or
referred within 24 h of age to Sardjito Hospital, five district hospitals and five health centers in Yogyakarta Special
Territory were included. Newborns with severely ill conditions, congenital anomaly and chromosomal abnormality
were excluded. Smoothening of the curves was accomplished using a third-order polynomial equation.
Results: Our study included 54,599 singleton live births. Growth curves were constructed for boys (53.3%) and girls
(46.7%) for birth weight, supine length, and head circumference. At term, mean birth weight for each gestational
age of boys was significantly higher than that of girls. While mean birth weight for each gestational age of firstborn-children, on the other hand was significantly lower than that of later-born-children. The mean birth weight
was lower than that of Lubchenco’s study. Compared with the previous Indonesian study by Alisyahbana, no
differences were observed for the aterm infants, but lower mean birth weight was observed in preterm infants.
Conclusions: Updated neonatal reference curves for birth weight, supine length and head circumference are
important to classify high risk newborns in specific area and to identify newborns requiring attention.
Keywords: Reference curve, Birth weight, Supine length, Head circumference, Sex, First-later-born children, Preterm term
Background
Size at birth reflects fetal growth and health as well as
provides important information on the newborns infant. Many studies have been carried out to construct a
theoretical birth weight curve for gestational age [1, 2].
The birth size curve was used as a reference to facilitate
prediction of growth, estimate the risk for small gestational age (SGA), and to identify newborns at risk that
require assessment and monitoring during the neonatal
period [3–7].
* Correspondence:
1
Department of Child Health, Faculty of Medicine, Gadjah Mada University,
Sardjito General Hospital, Jl. Kesehatan No. 1, Yogyakarta 55284, Indonesia
Full list of author information is available at the end of the article
The prevalence of high risk newborns depends on the
birth curve used [8]. Therefore, a perinatal growth chart
that is versatile enough to serve as an international reference and at the same time simple to understand, to reproduce, and to use is needed [9]. However, data
suggests that reference curves from other populations
may not be representative, thus it is important to develop region-and population-specific reference curves
[10–16]. Consequently, gender-specific population-based
reference curves are expected to improve the clinical assessment of growth in newborns and evaluation of interventions [17]. In addition, update of the reference curves
every 10–15 year is necessary to adjust the curves for
changes in the population over time [18–23]. Hence,
© The Author(s). 2016 Open Access This article is distributed under the terms of the Creative Commons Attribution 4.0
International License ( which permits unrestricted use, distribution, and
reproduction in any medium, provided you give appropriate credit to the original author(s) and the source, provide a link to
the Creative Commons license, and indicate if changes were made. The Creative Commons Public Domain Dedication waiver
( applies to the data made available in this article, unless otherwise stated.
Haksari et al. BMC Pediatrics (2016) 16:188
fetal growth may be assessed in longitudinal studies,
clinically or through ultrasound scans. Nevertheless,
birth weight and estimated intrauterine fetal weight are
not always comparable especially at earlier periods of
gestation. Thus, the birth weight data should not be used
to calculate intrauterine growth rate [24].
Today clinicians in most developing countries are
using the Lubchenco’s reference curve for newborns
[1, 25]. However, most neonatology centers in developed countries in Europe use the Niklasson’s curve
[19]. Indonesian clinicians, on the other hand, have
emphasized the importance of establishing national
reference curves. Alisyahbana’s study developed reference curves for 5844 newborns with 34–44 weeks
based on data from 14 teaching hospitals in Indonesia
from July 1,1990 to June 30,1991 [26]. The result
showed that the mean birth weight of Lubchenco’s
newborns was significantly different than that from
Alisyahbana’s, therefore the Lubchenco’s curve cannot
be used as reference curve for Indonesian newborns.
In 1992 the Maternal-Perinatal (MP) team was established in Yogyakarta with the aim of conducting MP audits and creating an MP database in the district hospitals
including data collection on birth weight, supine length
and head circumference of newborns. The aims of this
study were to update the reference curves for birth
weight, supine length and head circumference for
Yogyakarta, Indonesia and to compare birth weight
curves of boys and girls, first child and later children,
and the ones in the previous studies.
Methods
Study population and study period
The study was conducted in Yogyakarta Special Territory (YST) whose population is made up of various
ethnics in Indonesia. Nevertheless it has not represented the population of Indonesia as a whole. YST
consist of five districts. Each district is served by a
district hospital and a couple of health centers, of
which only one was equipped for deliveries, and the
referral hospital Sardjito. During the study period
January 1, 1998 to December 31, 2007 all deliveries at
Sardjito Hospital, the five district hospitals, and the
five health centers equipped for deliveries were recorded. Approximately, 80% of the newborns in YST
were delivered by trained health personnel, 65% of
whom were delivered in Sardjito Hospital, five district
hospitals and five health centers; the remaining 35%
was delivered in private hospitals, maternity clinics,
midwife clinics or at home by midwives [27].
Our study population consisted of all newborns delivered at Sardjito Hospital, five district hospitals, five
health centers and those referred from other health facilities within 24 h of birth.
Page 2 of 14
Lubchenco [1, 25], Niklasson [19], and Alisyahbana
[26] presented birth weight using gestational age
curves for singleton, live born, and healthy newborns.
The study population of Lubchenco was collected
from Colorado General Hospital, Niklassons from the
Swedish Medical Birth Register and it covers the
whole Sweden, and Alisyahbana from 14 teaching
hospitals in Indonesia (Table 1).
Maternal-Perinatal database
The study was conducted by MP team based on MP
database. The MP database in the district hospitals is
part of MP audit, which is a district-based audit of maternal and perinatal mortality. The MP audit was introduced in Indonesia as a tool for continuous surveillance
of the maternal-perinatal mortality and quality assurance
of the obstetric and perinatal services into the domain of
district health system [28, 29].
The MP database was run in every district hospital by
filling in the MP form daily. The data were validated
monthly by the local team before they were sent to the
MP center at the beginning of the next month and were
computerized by a trained secretary. The data generation
process from data collection, field editing, data form
submission to the data center, and to data entry were
continuously monitored to identify errors and logical
inconsistencies.
In Indonesia, primary health care services are conducted in health centers. The district hospitals are secondary health facilities that provide referral services in
that area. Tertiary health facilities are made available at
teaching hospitals, which are usually found in the capital
of a province. However, for provinces without a teaching
hospital, the services are provided by the provincial hospital, a government hospital in the capital of the
province.
The forms from the five district hospitals in YST were
submitted to the MP center at Sardjito Hospital until
2001, meanwhile the MP team in the center checked
and entered the data. However, from 2002 onwards all
facilities were checked and they entered the data by
themselves. Therefore the 1998–2001 data were available
in the MP center while the 2002–2007 data were available in the health facilities. Unfortunately, an earthquake struck the area in May 2006 and damaged the soft
copy in computers, thus causing most of the data to be
re-entered from the MP forms.
The MP database contained information from the
mother’s delivery to the neonatal period for each individual in the maternity and newborns facilities in YST. The
newborns were followed up until they were discharged
from the facilities. Trained health personnel filled in the
MP forms. They contained information on identity,
Haksari et al. BMC Pediatrics (2016) 16:188
Page 3 of 14
Table 1 A comparison of the present study with the previous studies
Reference
Study area
Study
population
Study
period
Sample
size
Subjects
Analysis
All/live
births
All/
GA
Singleton (weeks)
Method
Congenital
anomalies
included
Gender Mean Percentiles
± SD by GA
by GA
Live
All
24–42
LMP
No
Yes
No
Yes
Lubchenco
[1, 25]
US (Denver, Colorado
Colorado)
General Hospital
1948–61
7827
Niklasson
[19]
Sweden
Medical birth
registration
1977–81
475,588 Live
Singleton 28–42
LMP &
USG
No
Yes
Yes
No
Kramer [18]
Canada,
except
Toronto
Provinces
1994–96
676,605 All
Singleton 22–43
USG
Yes
Yes
Yes
Yes
Alisyahbana
[26]
Indonesia
14 teaching
hospitals
1990–91
5844
Live
Singleton 34-44 LMP No
Yes
No
Yes
Ulrich M [12] Denmark
(Odense)
Residents
1978
906
Live
Singleton 25–43
USG &
Dubowitz
No
Yes
Yes
No
Matthai [24]
India
(Velore)
Christian hospital 1991–94
(n = 13,217)
11,641
Live
Singleton 37–41
Clinical
&USG
No
(normal)
Yes
No
Yes (only
10, 50, 90)
Fok [20]
Hongkong
Chinese origin
(n = 104,258)
1998–2001 10,339
Live
Singleton 24–43
(USG &
Ballard)
No
Yes
Yes
Yes
Visser [21]
The
Netherland
The Netherlands 2001
Perinatal Registry
(n = 183,000)
Singleton 25
Yes
onwards
LMP &USG
Yes
Yes
Yes
Present
study
Indonesia
Sardjito, 5 district 1998–2007 54,599
(Yogyakarta) hospitals, & 5
health centers
(n = 59,609)
Singleton 26–42
No
(Dubowitz)
Yes
Yes
Yes
176,000 Live &
intrapartum
death
Live
characteristics of the mothers, their pregnancy and delivery, and the newborns.
Table 2 Basic characteristics of the study population (n = 54,599)
Characteristic
Category
No
%
Health facility
Sardjito hospital
13,726
25.1
District hospitals
30,574
56.0
Health centers
10,299
18.9
Boys
29,112
53.3
Girls
25,487
46.7
First (1st child)
26,189
48.0
Inclusion and exclusion criteria
Only live singletons with recorded gestational ages between 26 to 42 weeks and the exact time of admission to
the neonatal facility were included in the study; meanwhile
those with severely ill conditions (severe asphyxia, severe
cardio-respiratory distress, etc.), major congenital anomaly, and those admitted >24 h of age were excluded.
Assessment of gestational age
In most developing countries, women especially in rural
areas are unaware of the exact date of their last menstrual
period (LMP). Thus, they could not calculate the expected
date of delivery using the first date of the last menstrual
period. Dubowitz [30] developed a clinical assessment of
gestational age for newborns. A scoring system for gestational age, based on 10 neurologic and 11 external criteria. The correlation coefficient for the total score
against gestation was 0.93. The error of prediction of a
single score was 1.02 weeks and of the average of two
independent assessments was 0.7 weeks. The method
gives consistent results within the first 5 days and is
Gender
Birth order
Later (≥2
Admitted to neonatal
ward
Education of mother
(years)
Age of mother (years)
Number of registered
infants
nd
28,410
52.0
Born in the hospital/health
centre
child)
45,414
83.2
Referred <24 h
9,185
16.8
≤5
1,803
3.8
6–12
40,196
82.7
≥13
6,576
13.5
≤19
1,770
3.3
20–34
43,737
81.0
≥35
8,456
15.7
Birth weight
54,599
100
Length
52,261
95.7
Head circumference
48,109
88.1
Haksari et al. BMC Pediatrics (2016) 16:188
Page 4 of 14
equally reliable in the first 24 h of life. The scoring system is more objective and reproducible than trying to
guess the gestational age on the presence or absence of
individual signs. In the study, gestational age was based
on clinical assessment of gestational age according to
Dubowitz score and was verified by the mother’s last
normal menstrual period in completed weeks.
Measurements
Birth weight, supine length, and head circumference
were measured immediately after delivery. All infants
were weighed to the nearest 10 g on a balance scale
(readjusted using standardized weight as part of routine
care). The length was measured using a measuring board
with supports for the head and feet to the nearest cm.
Table 3 Birth weight for boys and girls by gestational age in weeks
GA
(w)
No of
cases
Mean
(g)
SD
26
55
768.1
27
39
28
50
29
30
Birth weight Percentiles (g)
P3
P5
P10
P25
P50
P75
P90
P95
P97
170.2
500
500
506
600
750
900
1000
1060
1103
866.6
152.8
520
600
700
750
850
1000
1100
1100
1100
968.7
152.9
600
600
800
900
1000
1050
1100
1168
1289
52
1057
157.0
600
750
900
1000
1085
1130
1235
1331
1412
70
1246
202.3
820
950
1000
1100
1205
1400
1547
1623
1667
31
89
1409
282.3
1050
1063
1100
1200
1380
1525
1700
2025
2318
32
223
1705
377.4
1172
1200
1300
1450
1650
1900
2192
2500
2600
33
258
1750
442.7
1200
1200
1250
1400
1700
2000
2219
2562
2837
34
473
1917
407.1
1200
1350
1400
1650
1900
2200
2400
2600
2939
35
541
2035
378.5
1350
1400
1552
1800
2000
2250
2400
2595
2787
36
868
2382
430.7
1650
1750
1900
2100
2350
2550
3000
3216
3400
37
1576
2643
427.1
1800
1999
2150
2450
2600
2900
3200
3400
3500
38
3799
2862
404.8
2100
2200
2400
2600
2800
3100
3400
3550
3700
39
6915
3069
382.3
2310
2496
2600
2850
3050
3300
3500
3700
3800
40
8755
3184
410.5
2414
2540
2700
2950
3180
3400
3700
3900
4000
41
3812
3358
445.0
2500
2600
2800
3100
3400
3650
3900
4000
4200
42
1537
3295
463.5
2500
2600
2800
3000
3250
3500
3950
4182
4300
26
48
680.8
134.8
500
500
500
600
650
767
900
967
991
27
41
844.3
156.2
600
609
700
770
800
900
1040
1100
1396
28
59
945.3
119.2
600
700
800
900
1000
1000
1100
1100
1166
29
42
1023
109.6
765
800
900
994
1000
1100
1141
1193
1271
30
49
1151
230.2
675
760
850
1000
1100
1300
1500
1575
1665
31
74
1374
294.1
825
975
1100
1200
1340
1500
1725
2050
2200
32
171
1711
441.3
1100
1150
1200
1400
1600
1900
2480
2608
2700
33
211
1692
406.2
1200
1200
1250
1400
1600
1850
2200
2520
2800
34
392
1862
386.5
1200
1250
1400
1568
1875
2100
2300
2400
2500
35
515
2046
386.3
1400
1500
1600
1800
2000
2250
2400
2600
2890
36
812
2335
436.8
1500
1700
1823
2100
2300
2500
2900
3200
3300
37
1384
2589
397.0
1800
1925
2145
2400
2500
2800
3100
3300
3400
38
3318
2800
375.1
2100
2200
2400
2600
2800
3000
3250
3450
3600
39
6065
2997
371.3
2300
2400
2600
2750
3000
3200
3450
3600
3700
40
7607
3099
393.6
2400
2500
2600
2850
3100
3350
3560
3750
3900
41
3254
3259
447.4
2400
2500
2700
3000
3300
3550
3800
4000
4050
42
1445
3208
447.3
2400
2500
2700
2900
3200
3500
3800
4000
4200
Boys
Girls
GA Gestational Age; SD Standard Deviation; P Percentiles; g gram; w week
Haksari et al. BMC Pediatrics (2016) 16:188
Page 5 of 14
The head circumference was recorded using a measuring
tape to the nearest cm. Training and standardization in
anthropometric measurements of weight, length, head
circumference, and clinical assessment of gestational age
by Dubowitz score were carried out in December 1997.
All measurements were examined by trained nurses.
Data analysis
Data analysis was performed using SPSS version 19.
Tables and graphs presented means and standard deviations (SDs) and the 3th, 5th, 10th, 25th, 50th (median),
75th, 90th, 95th, 97th percentiles by gestational age relevant for clinicians in classifying newborns under their
Table 4 Length supine of boys and girls by gestational age in weeks
GA
(w)
No of
cases
Mean
(cm)
SD
26
54
33.6
27
37
28
50
29
30
Lenght Supine Percentiles (cm)
P3
P5
P10
P25
P50
P75
P90
P95
P97
2.73
25
28
31
32
34
35
36
36
37
33.9
3.88
24
24
25
33
35
36
37
37
40
35.9
2.94
25
30
35
35
36
37
38
40
43
50
37.7
3.18
29
35
35
36
38
39
40
43
45
67
39.4
3.01
31
35
36
37
40
41
43
44
44
31
89
41.3
2.02
37
37
39
40
41
42
44
45
45
32
223
42.6
2.27
40
40
40
41
43
44
45
47
47
33
258
42.1
2.89
36
37
38
41
42
44
46
47
48
34
413
43.4
3.08
37
38
40
42
44
46
47
48
49
35
475
44.0
3.19
38
38
40
42
44
46
48
48
49
36
868
45.9
2.01
42
43
44
45
46
47
49
49
50
37
1470
47.0
2.04
43
43
45
46
47
48
49
50
50
38
3778
47.8
1.86
44
45
46
47
48
49
50
50
51
39
6754
48.4
1.74
45
46
47
48
49
50
50
51
51
40
8168
48.8
1.80
45
46
47
48
49
50
51
51
52
41
3584
49.1
2.04
46
46
47
48
49
50
51
52
52
42
1527
49.1
1.76
46
46
47
48
49
50
51
52
52
26
43
34.1
2.91
26
28
30
33
34
36
37
39
40
27
37
34.8
2.51
25
31
32
34
35
36
38
39
40
28
59
35.9
2.07
33
33
34
35
36
37
40
40
42
29
41
37.7
2.84
30
31
35
36
37
40
42
43
43
30
49
38.8
2.86
34
34
35
36
40
41
42
43
44
31
74
41.3
2.08
38
38
39
40
41
42
45
45
47
32
171
42.9
2.16
40
40
41
41
43
44
46
47
47
33
210
41.9
2.45
37
38
39
40
42
43
45
46
47
34
351
43.1
3.25
37
37
39
41
43
45
47
48
48
35
457
44.0
2.85
38
39
41
42
44
46
48
48
49
36
812
45.7
2.20
41
42
43
45
46
47
48
49
50
37
1304
46.7
1.96
43
43
44
46
47
48
49
50
50
38
3299
47.4
1.78
44
45
45
46
47
49
50
50
51
39
5933
48.0
1.70
45
45
46
47
48
49
50
50
51
40
7074
48.4
1.79
45
46
46
47
48
49
50
51
51
41
3043
48.7
2.04
45
46
47
48
49
50
51
51
52
42
1439
48.8
1.70
45
46
47
48
49
50
51
52
52
Boys
Girls
GA Gestational Age; SD Standard Deviation; P Percentiles; cm centimeter; w week
Haksari et al. BMC Pediatrics (2016) 16:188
Page 6 of 14
care and to researchers as well as public policy makers
in comparison to geographic differences and temporal
trends in birth weight for gestational ages in population. All analyses were performed separately for boys
and girls. Distribution of birth weight, supine length,
head circumference at the corrected gestational ages
was smoothened by a third degree polynomial function.
Curves were produced using Microsoft Excel 2010.
Difference in mean birth weight between boys and
girls, as well as first and later-born for each gestational
age was analyzed using Student’s t-test. In the birth
order of children, the term “first” refers to the 1st child,
Table 5 Head circumference of boys’ and girls’ by gestational age in weeks
GA
(w)
No of
cases
Mean
(cm)
SD
26
50
26.7
27
33
28
42
29
30
Head Circumferences Percentiles (cm)
P3
P5
P10
P25
P50
P75
P90
P95
P97
2.79
22
22
23
24
26
30
30
30
30
25.9
2.48
23
23
23
24
25
28
30
31
31
27.8
3.19
23
23
24
25
27
30
33
33
33
35
29.0
2.83
24
25
26
27
28
32
33
33
33
63
28.6
1.89
25
25
26
27
29
30
31
31
31
31
89
29.2
1.80
25
26
27
28
29
31
31
32
32
32
223
31.3
1.40
27
28
30
31
32
32
32
33
33
33
256
30.4
1.86
26
27
28
30
31
32
32
33
34
34
398
31.0
1.42
28
29
29
30
31
32
33
34
34
35
465
31.2
1.19
29
29
30
31
31
32
33
33
34
36
868
32.6
1.09
30
31
32
32
33
34
34
34
34
37
669
32.7
1.18
30
30
31
32
33
34
34
34
35
38
3534
33.3
0.871
32
32
32
33
34
34
34
35
35
39
6296
33.7
0.778
32
32
33
34
34
34
35
35
35
40
7871
33.9
0.751
32
32
33
34
34
34
35
35
35
41
3463
34.2
0.763
32
33
34
34
34
35
35
36
36
42
1289
34.1
0.809
32
33
33
34
34
35
35
36
36
26
36
26.6
2.81
22
22
23
24
26
30
30
30
30
27
31
27.0
2.53
23
24
24
25
26
30
30
30
30
28
46
27.4
3.16
22
23
24
25
27
30
32
33
33
29
31
29.5
2.36
25
26
26
28
30
31
33
33
33
30
41
28.4
2.30
23
23
24
27
29
30
31
31
31
31
74
29.3
1.75
25
26
27
28
30
31
31
32
32
32
171
31.1
1.53
27
28
29
30
32
32
33
33
33
33
207
30.3
1.75
27
27
28
29
30
32
32
33
33
34
342
30.8
1.32
28
28
29
30
31
32
32
33
33
35
452
31.2
1.32
28
29
30
31
31
32
33
33
34
36
812
32.4
1.23
30
30
31
32
32
33
34
34
34
37
608
32.7
1.26
30
30
31
32
33
34
34
34
35
38
3088
33.2
0.848
31
32
32
33
34
34
34
34
35
39
5544
33.6
0.774
32
32
33
34
34
34
35
35
35
40
6817
33.8
0.752
32
32
33
34
34
34
35
35
35
41
2964
34.1
0.778
32
33
33
34
34
35
35
35
36
42
1201
34.0
0.835
32
32
33
34
34
35
35
35
36
Boys
Girls
GA Gestational Age; SD Standard Deviation; P Percentiles; cm centimeter; w week
Haksari et al. BMC Pediatrics (2016) 16:188
Page 7 of 14
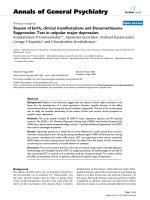
Fig. 1 a Smoothened percentiles for boys’ birth weight by gestational age. b. Smoothened mean and standard deviations for boys’ birth weight
by gestational age
and “later” refers to second child and so on. The weightlength ratio was calculated according to Rohrer’s
Ponderal index (PI); 100 x weight in grams/length [3] in
centimeters and was classified by tertiles into 3 groups;
low, average, or high [31]. The PI was then calculated
and classified into low, average and high.
Results
From January 1998 to December 2007 there were 59,609
births. Most of the infants (83.2%) were born in Sardjito
Hospital, five district hospitals, and five health centers,
whereas the others (16.8%) were born in other hospitals,
health centers, midwife clinics, at home, and were admitted to the study setting before 24 h. In this study there
were 54,599 subjects in total. Mean birth weight was 2,964
g and there was no difference in birth weight over time.
Sardjito Hospital, the five district hospitals, and the
five health centers in YST contributed with 25%, 56%
and 19% of the newborns respectively. First child constituted 26,189 (48.0%) and later child was 28,410 (52.0%).
The numbers of eligible infants for birth weight, length
and head circumference were 54,599, 52,261 and 48,109
respectively (53.3% boys and 46.7% girls) (Table 2).
Mean ± SD, percentiles 3, 5, 10, 25, 50, 75, 90, 95, 97 of
birth weight, length, and head circumferences for boys
and girls were presented in Tables 3, 4, 5. Smoothed
curves of birth weight, length, and head circumference
for boys and girls were presented in Figs. 1, 2, 3, 4, 5, 6.
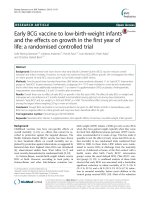
Fig. 2 a Smoothened percentiles for girls’ birth weight by gestational age. b. Smoothened mean and standard deviations for girls’ birth weight
by gestational age
Haksari et al. BMC Pediatrics (2016) 16:188
Page 8 of 14
Fig. 3 a Smoothened percentiles for boys’ length by gestational age. b. Smoothened mean and standard deviations for boys’ length by gestational age
At term (37–42 weeks gestational age) mean birth
weight for each gestational age was significantly higher
for boys than for girls (Table 6, Fig. 7) and for later born
than for first born (Table 7, Fig. 8).
For gestational age ≥39 weeks there was a striking
similarity in mean birth weight among Lubchenco’s,
Alisyahbana’s, and our study. The mean birth weight
for gestational age ≤38 weeks was lower in our study
than that in Lubchenco’s. Gestational age 34–37 weeks
presented the highest mean birth weight in Alisyahbana’s
but the lowest in our study (Table 8, Fig. 9).
Tertiles of PI of our study were low (<2.5), average (2.5–
2.8) and high (>2.8). The PI of term boys, girls, first and
later children in our study were classified into average
group. In the preterm, however, it was classified into low
group (Tables 6 and 7). The PI for gestational age was
consequently lower in our study than in Lubchenco’s. The
gestational age ≥39 weeks was higher in our study than it
was in Lubchenco’s and Alisyahbana’s (Table 8).
Discussion
Our study presented girls and boys for birth weight,
length and head circumference based on the local data.
One of the weaknesses of our study was that it did not
have enough low-gestational age infants. Therefore the
application of the curve in low gestational age infant
must be done carefully.
Moreover, comparison of each gestational age showed
higher significance in at term only, but not in preterm. The
result was similar to the study by Fok [20] whereby the
Fig. 4 a Smoothened percentiles for girls’ length by gestational age. b. Smoothened mean and standard deviations for girls’ length by
gestational age
Haksari et al. BMC Pediatrics (2016) 16:188
Page 9 of 14
Fig. 5 a Smoothened percentiles for boys’ head circumference by gestational age. b. Smoothened mean standard deviations for boys’ head
circumference by gestational age
mean birth weight of boys consistently exceeded that of
girls at 36 weeks or more gestational ages. Lubchenco [1]
showed differences of approximately 100 g, significant between boys and girls at 38 to 41 weeks. Skjaerven [16] explained that the effects at 40 weeks in boys were heavier
than those in girls. However, Olsen [32] found that all were
statistically different by age group, and most were considered clinically different enough. This illustrates the necessity to create separate charts for boys and girls.
Skjaerven [16] pointed out that later children at
40 weeks were between 130–150 g heavier than first
children. This was similar to our study which showed
that each gestational age, at term later-born children
were significantly 100–130 g heavier (p < 0.001) than
first-born children. In preterm there was no significant
difference, though. Nevertheless, Alisyahbana reported
that for every gestational age and percentile, later-born
children were heavier than first born-children [27].
We could not compare the mean birth weight for each
gestational age in our study and that in the previous studies by Lubchencho and Alisyahbana, since there was no
information on standard deviation. Thus, the comparison
was based on mean birth weight for sexes combine because no information of separated boys and girls was
found in Alisyahbana’s. Similarly, comparison of our study
and Lubchenco’s showed that for gestational age
≤38 weeks the mean birth weight was lower in our study.
This was probably due to the relatively high number of infants with small for gestational age in our population for
term and preterm, which needed further investigation.
Compared with Alisyahbana’s study, for gestational
age 34–37 weeks the mean birth weight was lower in
Fig. 6 a Smoothened percentiles for girls’ head circumference by gestational age. b. Smoothened mean standard deviations for girls’ head
circumference by gestational age
Haksari et al. BMC Pediatrics (2016) 16:188
Page 10 of 14
Table 6 Mean birth weight, standard deviation, ponderal index, classification for boys and girls by gestational age
p
GA
(w)
Boys
No of cases
Mean (g)
SD
No of cases
Girls
Mean (g)
SD
26
55
768.1
170.2
48
680.8
134.8
27
39
866.6
152.8
41
844.3
28
50
968.7
152.9
59
945.3
29
52
1057
157.0
42
30
70
1246
202.3
49
31
89
1409
282.3
32
223
1705
377.5
33
258
1750
34
473
1917
35
541
36
868
37
38
Boys
Girls
PI
C
PI
C
0.005
2.1
L
1.7
L
156.2
0.52
2.4
L
2.0
L
119.2
0.37
2.2
L
2.1
L
1023
109.6
0.25
2.0
L
1.9
L
1151
230.2
0.019
2.1
L
2.0
L
74
1374
294.1
0.45
2.0
L
1.9
L
171
1711
441.3
0.87
2.2
L
2.2
L
442.7
211
1692
406.2
0.15
2.3
L
2.3
L
407.1
392
1862
386.5
0.043
2.4
L
2.4
L
2035
378.5
515
2046
386.3
0.64
2.4
L
2.4
L
2382
430.7
812
2335
436.8
0.026
2.4
L
2.4
L
1576
2643
427.1
1384
2589
397.0
<0.001
2.5
A
2.5
A
3799
2862
404.8
3318
2800
375.1
<0.001
2.6
A
2.6
A
39
6915
3069
382.3
6065
2997
371.4
<0.001
2.7
A
2.7
A
40
8755
3184
410.5
7607
3099
393.6
<0.001
2.8
A
2.7
A
41
3812
3358
445.0
3254
3259
447.4
<0.001
2.8
A
2.8
A
42
1537
3295
463.5
1445
3208
447.3
<0.001
2.8
A
2.8
A
C Classification; L Low, A Average, H High; GA Gestational Age; SD Standard Deviation; P Percentiles; g gram; w week
our study; which was probably due to the differences
of sample. Our study had more data from health centers, district hospitals, and 1 teaching hospital, whereas
Alisyahbana’s study collected the data from 14 teaching
hospitals with middle and high socio-economic status.
In addition, the numbers of samples in our study were
much higher with updated reference for 26 to 42 weeks
Fig. 7 Mean birth weight for boys’ and girls’ by gestational age
gestational age, meanwhile Alisyahbana’s was only 34–
42 weeks. Unfortunately, we could not compare our
result with Niklasson’s curve [20], since we were not
able to find the data in the Niklasson’s articles.
Tertiles of PI for our study were similar to those of
Morris’s [31] report, which showed <2.6 low, 2.6–2.8
average and >2.8 high. The PI of at term of boys, girls,
Haksari et al. BMC Pediatrics (2016) 16:188
Page 11 of 14
Table 7 Mean birth weight, standard deviation, Ponderal index and classification by birth order and gestational age
GA
(w)
First child
p
Later children
First child
PI
Later children
No of cases
Mean (g)
SD
No of cases
Mean (g)
SD
C
PI
26
48
723.6
173.7
55
730.7
148.8
0.83
2.0
L
1.9
L
C
27
40
832.8
145.3
40
877.5
160.8
0.18
2.2
L
2.3
L
28
60
951.6
139.1
49
961.3
132.2
0.71
2.1
L
2.1
L
29
56
1041
107.7
38
1043
175.3
0.94
2.0
L
2.0
L
30
57
1199
203.6
62
1214
232.6
0.70
2.1
L
2.0
L
31
84
1413
315.6
79
1372
254.2
0.37
2.0
L
2.0
L
32
214
1698
393.4
180
1720
421.0
0.58
2.2
L
2.2
L
33
228
1689
407.1
241
1757
443.7
0.083
2.3
L
2.3
L
34
508
1874
386.2
357
1917
414.8
0.12
2.3
L
2.4
L
35
628
2034
361.9
428
2049
410.4
0.54
2.4
L
2.4
L
36
906
2328
390.9
774
2396
477.6
0.002
2.4
L
2.5
A
37
1525
2569
381.3
1435
2669
440.7
<0.001
2.5
A
2.6
A
38
3510
2783
361.3
3607
2883
414.7
<0.001
2.6
A
2.7
A
39
6159
2983
359.5
6821
3083
389.7
<0.001
2.7
A
2.7
A
40
7527
3075
377.2
8835
3204
418.0
<0.001
2.7
A
2.8
A
41
3289
3246
443.1
3777
3370
445.8
<0.001
2.8
A
2.9
H
42
1350
3199
440.7
1632
3297
466.9
<0.001
2.7
A
2.8
A
C Classification; L Low; A Average; H High; GA Gestational Age; SD Standard Deviation; P Percentiles; g gram; w week
first, and later children in our study was at average.
However, in the preterm it was low.
Lubchenco [26] reported that there was an increasing
weight-length ratio (PI) as gestation progressed; the babies became heavier for length as they approached near
Fig. 8 Mean birth weight for 1st and ≥2nd child by gestational age
full term. Similar to our study, PI was classified into preterm and average in near term (35–36 weeks) and term
(>37 weeks).
Thus, the combination of short and low PI at birth may
well provide a useful classification of the anthropometric
Haksari et al. BMC Pediatrics (2016) 16:188
Page 12 of 14
Table 8 Mean birth weight, Ponderal index, classification in Lubchenco’s, Alisyahbana’s and present study by gestational age
GA (w)
26
Lubchenco
Alisyahbana
No of cases
Present study
No of cases
BW (g)
PI
C
BW (g)
PI
C
No of cases
BW (g)
PI
C
68
1001
2.2
L
103
727
1.9
L
27
72
1065
2.2
L
80
855
2.1
L
28
118
1236
2.2
L
109
956
2.1
L
29
143
1300
2.3
L
94
1042
2.0
L
30
109
1484
2.3
L
119
1207
2.0
L
31
147
1590
2.4
L
163
1393
1.9
L
32
124
1732
2.4
L
394
1708
2.2
L
33
118
1957
2.4
L
34
145
2278
2.5
A
43
2553
2.5
A
469
1724
2.3
L
865
1892
2.3
L
35
188
2483
2.5
A
70
2704
2.6
A
1056
2040
2.4
L
36
202
2753
2.5
A
136
2849
2.4
L
1680
2359
2.5
A
37
372
2800
2.6
A
262
2819
2.5
A
2960
2618
2.5
A
38
636
3025
2.6
A
565
2903
2.5
A
7117
2833
2.6
A
39
1010
3130
2.6
A
1309
3066
2.6
A
12980
3035
2.7
A
40
1164
3226
2.6
A
1710
3146
2.5
A
16362
3145
2.7
A
41
632
3307
2.6
A
962
3205
2.6
A
7066
3312
2.8
A
42
336
3308
2.6
A
446
3228
2.6
A
2982
3253
2.7
A
Total
5584
5503
C Classification; L Low; A Average; H High; GA Gestational Age; PI Ponderal Index; BW Birth Weight; g gram; w week
Fig. 9 Mean birth weight by gestational age according to Lubchenco’s, Alisyahbana’s and present study
54599
Haksari et al. BMC Pediatrics (2016) 16:188
status of the newborns. Infants who were born short with
low PI were at risk of mortality and severe morbidity
during infancy [31]. The low PI of Lubchenco’s was for
gestational age ≤33 weeks, whereas it was for ≤35 weeks
in our study. If we found a short newborns <35 weeks of
gestational age, therefore, he/she would be at high risk for
morbidity and mortality.
Important cut off points for risk assessment of the 3rd
and 97th percentiles, −2 SD or +2 SD were added. We
expect that these curves would be useful for the care of
Indonesian newborns.
Conclusions
Our study separated girls and boys for birth weight,
length and head circumference based on the local data.
At term, mean birth weight of boys was significantly
higher than that of girls, mean birth weight of firstborn children was significantly lower than that of later
born-children; but in preterm, both did not suggest
significant difference.
For gestational age ≥39 weeks there was mean birth
weight similarity to Lubchenco’s, Alisyahbana’s, and our
study. When compared with Lubchenco’s study, the
mean birth weight for gestational age ≤38 weeks was
lower in our study. However, for 34–37 weeks, the
mean birth weight in our study was lower than that in
Alisyahbana’s study.
The PI of term for boys and girls and first and laterborn children was classified into average, whereas that of
preterm was classified into low. The PI for gestational age
≤35 weeks was lower in our study than in Lubchenco’s;
however, for gestational age ≥39 weeks it was higher in
our study than in Lubchenco’s and Alisyahbana’s.
Updated and improved neonatal reference curves for
birth weight, supine length, and head circumference are
important to classify high risk newborns in specific area
and to recognize those requiring attention with regard
to recent condition.
Abbreviations
A: Average; C: Classification; GA: Gestational age; H: High; HC: Head
circumference; L: Low; LMP: Last menstrual period; MP: Maternal-perinatal;
PI: Ponderal index; SD: Standard deviation; SGA: Small for gestational age;
USG: Ultrasonography; YST: Yogyakarta special territory
Acknowledgements
We would like to thank the late Professor Ahmad Surjono and all the
members of MP Audit team of Perinatal Epidemiology team at the Medical
Faculty of Gadjah Mada University and all the members of MP Audit team in
YST, Yogyakarta Municipality, Districts of Bantul, Kulonprogo, Gunung Kidul,
and Sleman. We also thank the physicians, pediatricians, obstetricians,
midwives, nurses, and health workers in Sardjito Hospital, the five district
hospitals and the five health centers in Tegalrejo, Imogiri, Temon, Ponjong,
and Ngemplak. Our gratitude is also addressed to Hans Stenlund, Anneli
Ivarsson, Setya Wandita, Tunjung Wibowo, Althaf, Diah, Hilwi, Wulan, Retno,
Juwariyem, Kusmiyati, Widodo, Ananta, Shianita, Friska, Toni and Agus Herwindo.
Funding
Not applicable.
Page 13 of 14
Availabillity of data and materials
The data and materials are stored at the Department of Child Health,
Neonatology Division, Faculty of Medicine, Universitas Gadjah Mada,
Yogyakarta.
Authors’ contributions
All authors participated in the study design and interpretation of data. ELH
conceptualized and designed the study, coordinated and supervised data
collection, acquisition of data, analysis and interpretation of data, as well as
drafted the article. HNL conceptualized and designed the study, analyzed
and interpreted the data, and conducted a critical review. Md H designed
the data collection instruments, coordinated and supervised the data
collection, acquired the data, and drafted the article. EPP carried out the
initial analysis of the study. LN conceptualized and designed the study,
carried out analysis and interpretation of the data, and drafted the initial
article. All authors read and approved the final manuscript.
Competing interests
The authors have indicated they have no financial relationships relevant to
this article to disclose. This manuscript does not have conflict of interest with
any individual or institution.
Consent for publication
We shall not display the data/photos/videos of the subject of the study.
Ethics approval and consent to participate
This study has been approved by Medical and Health Research Ethics Committee
Faculty of Medicine Universitas Gadjah Mada–Dr. Sardjito General Hospital.
Author details
1
Department of Child Health, Faculty of Medicine, Gadjah Mada University,
Sardjito General Hospital, Jl. Kesehatan No. 1, Yogyakarta 55284, Indonesia.
2
Department of Pediatrics, Vrije Universiteit Medical Center, P.O. Box 7057,
1007 MB Amsterdam, The Netherlands. 3Faculty of Medicine, Gadjah Mada
University/Sardjito General Hospital, Jl. Kesehatan No. 1, Yogyakarta 55284,
Indonesia. 4Public Health and Clinical Medicine, Umeå University, SE-901 87
Umeå, Sweden.
Received: 23 March 2016 Accepted: 8 November 2016
References
1. Lubchenco LO, Hansman C, Dressler M, Boyd E. Intrauterine growth as
estimated from live born birth-weight data at 24 to 42 weeks of gestation.
Pediatrics. 1963;32(5):793–800.
2. Usher R, McLean F. Intrauterine growth of live-born Caucasian infants at sea
level: Standards obtained from measurement in 7 dimensions of infants
born between 25 and 44 weeks of gestation. J Pediatr. 1969;74(6):901–10.
3. Battaglia FC, Lubchenco LO. A practical classification of newborns infants by
weight and gestational age. J Pediatr. 1967;71(2):159–63.
4. Alexander GR, Kogan MD, Himes JH, Mor JM, Goldberg R. Racial differences
in birth weight for gestational age and infant mortality in extremely-low-risk
US populations. Paediatr Perinat Epidemiol. 1999;13(2):205–17.
5. Thureen PJ, Anderson MS, Hay WH. The small for gestational age infant.
NeoReviews. 2001;2(6):e139–49.
6. Lee PA, Chernausek SD, Hokken-Koelega ACS, Czernichow P. for the
International Small for Gestational Age Advisory Board. International small
for gestational age advisory board consensus development conference
statement: Management of short children born small for gestational age,
April 24-October 1, 2001. Pediatrics. 2003;111(6 Pt 1):1253–61.
7. Ferdynus C, Quantin C, Abrahamowicz M, et al. Can birth weight standards
based on healthy populations improve the identification of small-forgestational–age newborns at risk of adverse neonatal outcomes. Pediatrics.
2009;123(2):723–30.
8. Alexander GR, Himes JH, Kaufman RB, Mor J, Kogan M. A United States
national reference for fetal growth. Obstet Gynecol. 1996;87(2):163–8.
9. Dunn PM. A perinatal growth chart for international reference. Acta Paediatr
Scand Suppl. 1985;319:180–7.
10. Munjanja SP, Masona D. Zimbabwean birth weight for gestational
standards. Cent Afr J Med. 1990;36(6):144–7.
Haksari et al. BMC Pediatrics (2016) 16:188
11. Arbuckle TE, Wilkins R, Sherman GJ. Birth weight percentiles by gestational
age in Canada. Obstet Gynecol. 1993;81(1):39–48.
12. Ulrich M, Høst A, Kamper J, Kroun M, Pedersen VF, Søgaard J. Weight,
length, and head circumference standards based on Danish newborns boys
and girls in gestational weeks 25 to 43. Dan Med Bull. 1997;44(4):436–9.
13. Bakketeig LS. Current growth standards, definitions, diagnosis and classification
of fetal growth retardation. Eur J Clin Nutr. 1998;52 Suppl 1:S1–4.
14. Skjaerven R, Gjessing HK, Bakketeig LS. Birth weight by gestational age in
Norway. Acta Obstet Gynecol Scand. 2000;79(6):440–9.
15. Ovali F. Intrauterine growth curves for Turkish infants born between 25 and
42 weeks of gestation. J Trop Pediatr. 2003;49(6):381–3.
16. Kierans WJ, Joseph KS, Luo ZC, Platt R, Wilkins R, Kramer MS. Does one size
fit all?The case for ethnic-specific standards of fetal growth. BMJ Pregnancy
Childbirth. 2008;8:1.
17. Goldenberg RL, Cutter GR, Hoffman HJ, Foster JM, Nelson KG, Hauth JC.
Intrauterine growth retardation: Standards for diagnosis. Am J Obstet
Gynecol. 1989;161(2):271–7.
18. Kramer SM, Platt RW, Wen SW, et al. A new and improved population-based
Canadian reference for birth weight for gestational age. Pediatrics. 2001;
108(2):E35.
19. Niklasson A, Ericson A, Fryer JG, Karlberg J, Lawrence C, Karlberg P. An
update of the Swedish reference standards for weight, length and head
circumference at birth for given gestational age (1977–1981). Acta Paediatr
Scand. 1991;80(8–9):756–62.
20. Fok TF, So H, Wong E, et al. Updated gestational age specific birth weight,
crown-heel length, and head circumference of Chinese newborns. Arch Dis
Child Fetal Neonatal Ed. 2003;883:F229–36.
21. Visser GH, Eylers PH, Elferink-Stinkens PM, Merkus HM, Wit JM. New Dutch
reference curves for birthweight by gestational age. Early Hum Dev. 2009;
85(12):737–44.
22. Dobbins TA, Sullivan EA, Roberts CL, Simpson JM. Australian national birth
weight percentiles by sex and gestational age, 1998–2007. MJA. 2012;197:
291–4.
23. Li Z, Umstad MP, Hilder L, Xu F, Sullivan EA. Australian national birthweight
percentiles by sex and gestational age for twins, 2001–2010. BMC Pediatr.
2015;15:148.
24. Mathai M, Jacob S, Karthikeyan NG. Birthweight standards for South Indian
babies. Indian Pediatr. 1996;33(3):203–9.
25. Lubchenco LO, Hansman C, Boyd E. Intrauterine growth in length and head
circumference as estimated from live births at gestational ages from 26 to
42 weeks. Pediatrics. 1966;37(3):403–8.
26. Alisyahbana A, Chaerulfatah A, Usman A, Sutresnawati S. Anthropometry of
newborns infants born in 14 teaching centers in Indonesia. Paediatr
Indones. 1994;34:62–123.
27. Yogyakarta Health Office. Health profile in Yogyakarta Special Territory. 2003.
(in Indonesian)
28. MOH Republic of Indonesia. Technical guidance of Maternal-Perinatal Audit
at district or municipal. 3rd ed. Jakarta, Indonesia; 2007 (in Indonesian)
29. Supratikto G, Wirth ME, Achadi E, Cohen S, Ronsmans C. A district-based
audit of the causes and circumstances of maternal deaths in South
Kalimantan, Indonesia. Bull WHO. 2002;80(3):228–34.
30. Dubowitz LM, Dubowitz V, Goldberg C. Clinical assessment of gestational
age in the newborns infant. J Pediatr. 1970;77(1):1–10.
31. Morris SS, Victora CG, Barros FC, et al. Length and Ponderal index at birth:
associations with mortality, hospitalizations, development and post-natal
growth in Brazilian infants. Int J Epidemiol. 1998;27(2):242–7.
32. Olsen IE, Groveman SA, Lawson ML, Clark RH, Zemel BS. New intrauterine
growth curves based on United States data. Pediatrics. 2010;125(2):e214–224.
Page 14 of 14
Submit your next manuscript to BioMed Central
and we will help you at every step:
• We accept pre-submission inquiries
• Our selector tool helps you to find the most relevant journal
• We provide round the clock customer support
• Convenient online submission
• Thorough peer review
• Inclusion in PubMed and all major indexing services
• Maximum visibility for your research
Submit your manuscript at
www.biomedcentral.com/submit