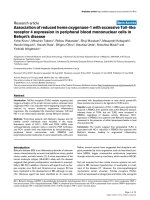
machine learning approach identifies a pattern of gene expression in peripheral blood that can accurately detect ischaemic stroke
Bạn đang xem bản rút gọn của tài liệu. Xem và tải ngay bản đầy đủ của tài liệu tại đây (680.93 KB, 9 trang )
www.nature.com/npjgenmed
ARTICLE
OPEN
Machine-learning approach identifies a pattern of gene
expression in peripheral blood that can accurately detect
ischaemic stroke
Grant C O’Connell1,2, Ashley B Petrone1, Madison B Treadway3, Connie S Tennant1, Noelle Lucke-Wold1, Paul D Chantler4,5
and Taura L Barr6
Early and accurate diagnosis of stroke improves the probability of positive outcome. The objective of this study was to identify a
pattern of gene expression in peripheral blood that could potentially be optimised to expedite the diagnosis of acute ischaemic
stroke (AIS). A discovery cohort was recruited consisting of 39 AIS patients and 24 neurologically asymptomatic controls. Peripheral
blood was sampled at emergency department admission, and genome-wide expression profiling was performed via microarray. A
machine-learning technique known as genetic algorithm k-nearest neighbours (GA/kNN) was then used to identify a pattern of
gene expression that could optimally discriminate between groups. This pattern of expression was then assessed via qRT-PCR in an
independent validation cohort, where it was evaluated for its ability to discriminate between an additional 39 AIS patients and 30
neurologically asymptomatic controls, as well as 20 acute stroke mimics. GA/kNN identified 10 genes (ANTXR2, STK3, PDK4, CD163,
MAL, GRAP, ID3, CTSZ, KIF1B and PLXDC2) whose coordinate pattern of expression was able to identify 98.4% of discovery cohort
subjects correctly (97.4% sensitive, 100% specific). In the validation cohort, the expression levels of the same 10 genes were able to
identify 95.6% of subjects correctly when comparing AIS patients to asymptomatic controls (92.3% sensitive, 100% specific), and
94.9% of subjects correctly when comparing AIS patients with stroke mimics (97.4% sensitive, 90.0% specific). The transcriptional
pattern identified in this study shows strong diagnostic potential, and warrants further evaluation to determine its true clinical
efficacy.
npj Genomic Medicine (2016) 1, 16038; doi:10.1038/npjgenmed.2016.38; published online 30 November 2016
INTRODUCTION
Stroke is currently the leading cause of disability and the fifth
leading cause of death in the United States.1 It is well established
that early and accurate diagnosis improves outcome by increasing
the probability of successful intervention;2,3 however, the diagnostic tools currently available to clinicians for the identification of
stroke have significant limitations.
Although neuroradiological imaging is the gold standard for
diagnosis of stroke,4 it is inaccessible in the field and at the initial
point of contact in emergency departments. Furthermore, such
imaging techniques are often not immediately available in
hospitals without dedicated stroke centres, such as smaller
facilities and those which serve rural areas.5 As a result, crucial
decisions regarding the triage of potential strokes by emergency
department staff and emergency medical technicians are based
on the assessment of overt patient symptoms using stroke
recognition and severity scales such as the Cincinnati pre-hospital
stroke scale (CPSS) and the National Institutes of Health stroke
scale (NIHSS).4 In the hospital setting, the ability to identify stroke
with such assessments is highly inconsistent, with an estimated
sensitivity ranging from 44 to 85%, and specificity ranging from 64
and 98%.6 The sensitivity and specificity of these assessments are
even lower in the pre-hospital setting,7 where the ability to quickly
identify stroke facilitates the transfer of patients to stroke-ready
hospitals, increasing the chances of appropriate treatment and
positive outcome.8 Due to these current limitations, a rapidly
measurable blood-based biomarker panel could be invaluable in
informing pre-hospital and in-hospital decisions early in the acute
phase of care, and could ultimately expedite access to interventional treatment.9
As a result, there has been a substantial push for the
identification of stroke-associated peripheral blood biomarkers.
The earliest stroke biomarker studies focused on the peripheral
blood proteome, and countless protein-based biomarker panels
have been evaluated to date. While a handful of these proteinbased panels have demonstrated a strong ability to differentiate
between stroke patients and healthy controls lacking the presence
of cardiovascular disease (CVD) risk factors, a majority have failed
to achieve specificities and sensitivities approaching 90% when
tested against clinically relevant control groups.9–13 More recently,
the peripheral blood transcriptome has emerged as a potential
source of stroke biomarkers, as preliminary reports have suggested that gene expression in the peripheral immune system is
highly responsive to ischaemic brain injury.14–16 Most notably,
Tang et al. identified a panel of 18 genes whose expression levels
demonstrated the ability to discriminate between acute ischaemic
1
Center for Basic and Translational Stroke Research, Robert C. Byrd Health Sciences Center, West Virginia University, Morgantown, WV, USA; 2Department of Pharmaceutical
Sciences, School of Pharmacy, West Virginia University, Morgantown, WV, USA; 3Department of Biology, Eberly College of Arts and Sciences, West Virginia University,
Morgantown, WV, USA; 4Center for Cardiovascular and Respiratory Sciences, Robert C. Byrd Health Sciences Center, West Virginia University, Morgantown, WV, USA; 5Division of
Exercise Physiology, School of Medicine, West Virginia University, Morgantown, WV, USA and 6CereDx Incorporated, Morgantown, WV, USA.
Correspondence: GC O’Connell () or TL Barr ()
Received 26 April 2016; revised 30 September 2016; accepted 3 October 2016
Published in partnership with the Center of Excellence in Genomic Medicine Research
Machine learning for stroke biomarker discovery
GC O’Connell et al
2
stroke patients (AIS) and healthy controls with 93.5% sensitivity
and 89.5% specificity using combined expression data generated from three blood draws obtained over the first 24 h of
hospitalisation.16,17 While the necessity to obtain multiple blood
samples limited this biomarker panel with regards to acute stroke
triage, this work provided proof of principle that stroke-induced
transcriptional changes in the peripheral immune system could be
used to identify stroke with relatively high levels of accuracy. Thus,
it is plausible that implementation of a robust biomarker discovery
approach could identify transcriptional stroke markers with the
potential to be diagnostically useful during the acute phase
of care.
Analysis of high-dimensional gene expression data using a
pattern-recognition approach known as genetic algorithm k-nearest neighbours (GA/kNN) has been successfully used in a small
number of cancer studies to identify diagnostically relevant
biomarker panels with strong discriminatory ability.18–20 The
GA/kNN approach combines a powerful search heuristic, GA, with
a non-parametric classification method, kNN. In GA/kNN analysis, a
small combination of genes (referred to as a chromosome) is
generated by random selection from the total pool of gene
expression data (Supplementary Figure 1A). The ability of this
randomly generated chromosome to discriminate between
sample classes is then evaluated using kNN. In this evaluation,
each sample is plotted as a vector in a multidimensional feature
space where the coordinates of the vector comprises the
expression levels of the genes of the chromosome. The class of
each sample is then predicted based on the majority class of the
nearest neighbours, or other samples that lie closest in Euclidian
distance within the feature space (Supplementary Figure 1B). The
ability of the chromosome to discriminate between classes is
quantified as a fitness score, or the proportion of samples which
the chromosome is correctly able to classify. A termination cutoff
(minimum proportion of correct classifications) determines the
level of fitness required to pass evaluation. A chromosome which
passes kNN evaluation is labelled as a near-optimal solution and
recorded, while a chromosome which fails undergoes repeated
cycles of mutation and re-evaluation until a near-optimal solution
is reached (Supplementary Figure 1A). This entire search paradigm
is performed multiple times (typically hundreds of thousands) to
generate a heterogeneous pool of near-optimal solutions
(Supplementary Figure 1C). The discriminatory ability of each
gene is then ranked according to the number of times it appears
in the near-optimal solution pool (Supplementary Figure 1D), and
Table 1.
the collective discriminatory ability of the top-ranked genes
can then be tested via kNN in a leave-one-out cross-validation
(Supplementary Figure 1E). This approach has been utilised to
generate biomarker panels capable of optimally discriminating
between cancerous and non-cancerous colon biopsies,20 primary
and metastatic melanoma tumours,18 as well as between B-cell
lymphoma sub-types,19 all with accuracies ranging between 95
and 100%.
While GA/kNN has proven robust in several applications in the
field of cancer, it has yet to be utilised for biomarker discovery in
the realm of cardiovascular disease (CVD). In this study, we applied
the GA/kNN approach to analyse peripheral blood gene expression data generated via microarray to identify transcriptional
patterns which could potentially be optimised for the detection of
AIS in the acute phase of care.
RESULTS
Discovery cohort
In order to identify potential transcriptional biomarkers for the
identification of AIS, we first recruited a discovery cohort
consisting of 39 AIS patients and 24 neurologically asymptomatic
controls. In terms of demographic and clinical characteristics, AIS
patients were older than controls, and displayed a higher
prevalence of CVD risk factors such as hypertension and
dyslipidaemia (Table 1). Furthermore, AIS patients displayed a
more substantial history of cardiac conditions such as myocardial
infarction and atrial fibrillation, and higher proportion of AIS
patients reported as currently taking antihypertensives and
anticoagulants.
Peripheral whole blood was sampled from patients at
emergency department admission, and genome-wide expression
profiling was performed via microarray. Gene expression data
were subjected to GA/kNN analysis, and genes were ranked based
on the ability of their expression levels to discriminate between
AIS patients and controls, according to the number of times they
were selected as part of a near-optimal solution (Figure 1a). The
expression levels of top 50 genes identified by GA/kNN displayed
a strong ability to discriminate between groups using kNN in
leave-one-out cross-validation; a combination of just the top 10
ranking genes (ANTXR2, STK3, PDK4, CD163, MAL, GRAP, ID3, CTSZ,
KIF1B and PLXDC2) were able to classify 98.4% of subjects in the
discovery cohort correctly with a sensitivity of 97.4% and
specificity of 100% (Figure 1b).
Discovery cohort clinical and demographic characteristics
Age (mean ± s.d.)
Female n (%)
NIHSS (mean ± s.d.)
Family history of stroke n (%)
Hypertension n (%)
Dyslipidaemia n (%)
Diabetes n (%)
Previous stroke n (%)
Atrial fibrillation n (%)
Myocardial infarction n (%)
Hypertension medication n (%)
Diabetes medication n (%)
Cholesterol medication n (%)
Anticoagulant or antiplatelet n (%)
rtPA n (%)
Current smoker n (%)
Control (n = 24)
AIS (n = 39)
59.9 ± 9.7
14 (58.3)
0 ± 0.0
4 (16.7)
7 (29.2)
0 (0.00)
2 (8.30)
2 (8.30)
0 (0.00)
0 (0.00)
8 (33.3)
1 (4.20)
5 (20.8)
1 (4.20)
0 (0.00)
2 (8.30)
73.1 ± 14.0
22 (56.4)
5.3 ± 6.4
15 (38.5)
25 (64.1)
18 (46.2)
11 (28.2)
6 (15.4)
6 (15.4)
6 (15.4)
29 (74.4)
7 (17.9)
17 (43.6)
20 (51.3)
9 (23.1)
2 (5.13)
Statistic (df)
t = − 4.40
χ2 = 0.12
t = 5.17
χ2 = 7.02
χ2 = 11.2
χ2 = 15.5
χ2 = 3.58
χ2 = 0.67
χ2 = 4.08
χ2 = 4.08
χ2 = 10.3
χ2 = 2.55
χ2 = 3.39
χ2 = 14.9
χ2 = 6.46
χ2 = 0.26
(61)
(1)
(38)
(1)
(1)
(1)
(1)
(1)
(1)
(1)
(1)
(1)
(1)
(1)
(1)
(1)
P
40.001*
0.731
40.001*
0.008*
0.001*
40.001*
0.058
0.414
0.043*
0.043*
0.001*
0.111
0.066
40.001*
0.011*
0.612
Abbreviations: AIS, acute ischaemic stroke; df, degrees of freedom; NIHSS, National Institutes of Health stroke scale; rtPA, recombinant tissue plasminogen
activator.
*Indicates statistically significant values.
npj Genomic Medicine (2016) 16038
Published in partnership with the Center of Excellence in Genomic Medicine Research
Machine learning for stroke biomarker discovery
GC O’Connell et al
3
1
2
3
4
5
6
7
8
9
10
11
12
13
14
15
16
17
18
19
20
21
22
23
24
25
26
27
28
29
30
31
32
34
35
36
37
38
39
40
41
42
43
44
45
46
47
48
49
50
ANTXR2
STK3
PDK4
CD163
MAL
GRAP
ID3
CTSZ
KIF1B
PLXDC2
CPD
CTSS
CLEC4D
ATP6V0E2L
MARCKS
APRT
CYP1B1
KLRB1
TMEM55A
TAOK1
CSPG2
ICAM2
LEF1
VNN3
CORO1C
MLSTD1
EEF1G
SLC2A14
LAMP2
DOCK8
TNFRSF25
C16ORF30
SRPK1
CLEC4E
C5AR1
DPYD
PASK
SAP30
CCR7
GOLGA8B
ARG1
HSDL2
FLT3LG
BNIP3L
RBP7
CYBRD1
EVL
TCN1
ECHDC2
FLJ10357
RANK
SELECTION COUNT
30000
25000
20000
15000
10000
5000
100.0
98.0
96.0
94.0
92.0
90.0
88.0
86.0
84.0
82.0
80.0
78.0
SENSITIVITY
SPECIFICITY
ACCURACY
1
2
3
4
5
6
7
8
9
10
11
12
13
14
15
16
17
18
19
20
21
22
23
24
25
26
27
28
29
30
31
32
33
34
35
36
37
38
39
40
41
42
43
44
45
46
47
48
49
50
PERCENT (%)
0
NUMBER OF TOP RANKED GENES
GA/kNN SELECTED
RANDOMLY SELECTED (GENOME-WIDE*)
RANDOMLY SELECTED (>|1.7| FOLD DIFFERENCE )
9
10
11
12
13
14
15
16
17
18
19
20
21
22
23
24
25
26
27
28
29
30
31
32
33
34
35
36
37
38
39
40
41
42
43
44
45
46
47
48
49
50
8
6
7
5
4
3
1
95% CI
2
ACCURACY (%)
p=3E-15*, p=2E-13
100
95
90
85
80
75
70
65
60
55
50
45
NUMBER OF GENES
Figure 1. Top 50 genes selected by GA/kNN for identification of AIS. (a) The top 50 peripheral blood transcripts ranked by GA/kNN based on
their ability to discriminate between AIS patients and neurologically asymptomatic controls in the discovery cohort. (b) Combined ability of
the expression levels of top 50 genes selected by GA/kNN to discriminate between AIS patients and neurologically asymptomatic controls in
the discovery cohort using kNN. (c) Ability of the expression levels of the top 50 genes selected by GA/kNN to discriminate between
neurologically asymptomatic controls and AIS patients via kNN compared with the expression levels of genes selected at random. The
accuracy of the top 10 genes selected by GA/kNN was specifically tested against the accuracy of randomly selected genes using single sample
two-way t-test.
In order to evaluate the robustness of our GA/kNN analysis in
terms of its ability to select optimally discriminative genes, we
compared the ability of the expression levels of top 50 genes
selected by GA/kNN to differentiate between stroke patients and
controls to that of genes selected at random. Specifically, we
compared the accuracy of GA/kNN-selected genes to the accuracy
of 50 sets of 50 genes randomly generated from the total pool of
gene expression data, as well as to the accuracy of 50 sets of 50
genes randomly selected from a subpool of genes that displayed
greater than 1.7-fold differential regulation between groups. The
top genes selected by GA/kNN performed significantly better than
genes selected at random genome wide, as well as significantly
better than genes selected at random from those which were
differentially regulated greater than 1.7-fold (Figure 1c). Collectively, the results of this analysis, in combination with the levels of
accuracy observed, suggest that our biomarker discovery strategy
was effective at selecting genes with optimal diagnostic potential
in terms of the subjects of the discovery cohort. Because the use
of genes beyond the top 10 did not appear to improve overall
accuracy (Figure 1b), and displayed diminishing diagnostic
robustness relative to genes selected at random (Figure 1c), we
chose to focus on only the top 10 genes for the remainder of our
analysis.
When comparing the peripheral blood expression levels of the
top 10 genes between AIS patients and controls, the magnitude of
differential expression was modest in terms of fold change in the
case of most genes; however, differences in expression levels
between groups were highly consistent across all subjects, which
was reflected by high levels of statistical significance in parametric
statistical testing (Figure 2a). The combined discriminatory power
of the top 10 genes was evident when their coordinate expression
levels were plotted on a continuum for each individual subject;
the overall pattern of expression was strikingly different between
AIS patients and controls, and it was clear that the overall pattern
of expression was more diagnostically powerful than the
expression levels of any given gene on its own (Figure 2b).
In order to more intuitively explore the relationship between
the pattern of gene expression observed across the top 10 genes
and relevant clinical characteristics, we first used principal
components analysis to describe the expression levels of the top
Published in partnership with the Center of Excellence in Genomic Medicine Research
npj Genomic Medicine (2016) 16038
Machine learning for stroke biomarker discovery
GC O’Connell et al
4
ASYMPTOMATIC CONTROL
ACUTE ISCHAEMIC STROKE
1E-10*
6E-09*
1E-07*
1E-05*
1E-09*
2E-11*
1E-10*
6E-08*
1E-07*
7E-11*
+2.0
1.7
1.3
1.0
0.7
0.3
0.0
0.3
0.7
1.0
1.3
1.7
-2.0
CONTROL
COMPOSITE RNA EXPRESSION (AU)
KIF1B
PLXDC2
ID3
CTSZ
MAL
GRAP
CD163
STK3
PDK4
ANTXR2
KIF1B
PLXDC2
ID3
CTSZ
MAL
GRAP
CD163
STK3
OVERLAY
PDK4
ANTXR2
KIF1B
AIS
PLXDC2
ID3
CTSZ
MAL
GRAP
CD163
STK3
PDK4
p
1.7
1.7
2.1
2.0
-2.0
-1.8
-1.8
1.7
1.7
1.7
HIGH EXPRESSION
+4.5 ASYMPTOMATIC CONTROL
4.0
3.5
3.0
2.5
2.0
1.5
1.0
0.5
0.0
0.5
1.0
1.5
-2.0
ANTXR2
RNA EXPRESSION (Z-TRANSFORMED)
LOW EXPRESSION
FOLD
AIS
GENE
ANTXR2
STK3
PDK4
CD163
MAL
GRAP
ID3
CTSZ
KIF1B
PLXDC2
Figure 2. Differential expression of top-ranked genes within the discovery cohort. (a) Peripheral blood differential expression of the top
10 genes selected by GA/kNN in discovery cohort neurologically asymptomatic controls and AIS patients, with fold changes reported relative
to control. Statistical significance of intergroup differences in gene expression was determined via two-sample two-way t-test, and P-values
were corrected to account for multiple comparisons via Holm's Bonferroni method. (b) Coordinate pattern of peripheral blood expression
across the top 10 genes plotted for individual subjects in both experimental groups. (c) Composite RNA expression levels of the top 10 genes
generated via principal components analysis.
Model: R2=0.848, p=1E-12*
Intercept
Stroke
Hypertension Medication
Anticoagulant/Antiplatelet
Dyslipidemia
Hypertension
Myocardial Infarction
Atrial Fibrillation
Age
Stroke*
B
-1.176
1.874
0.454
-0.358
-0.176
0.012
-0.261
0.175
-0.001
Std Error
0.313
0.151
0.149
0.138
0.154
0.145
0.217
0.243
0.005
p
4E-04 *
1E-13 *
0.004 *
0.012 *
0.259
0.934
0.234
0.475
0.824
R2 Contribution
0.661 (77.9%)
0.055 (6.5%)
0.038 (4.5%)
0.031 (3.6%)
0.029 (3.4%)
0.005 (0.6%)
0.011 (1.3%)
0.019 (2.2%)
Hypertension Medication*
Anticoagulant/Antiplatelet*
Dyslipidemia
Hypertension
Age
Atrial Fibrillation
Myocardial Infarction
Figure 3. Influence of potentially confounding clinical and demographic characteristics on the expression levels of the top 10 genes.
(a) Multiple regression model generated by regressing potentially confounding clinical and demographic characteristics against the
composite RNA expression levels of the top 10 genes selected by GA/kNN in the discovery cohort. (b) Graphical representation of the relative
contribution of each regressor towards the total variance in composite RNA expression explained by the model.
10 genes as single composite RNA expression variable. The
expression levels of the top 10 genes were highly correlated, and a
single principal component was able to describe 70% of the
collective variance in expression (Supplementary Table 1A).
The result component scores (composite RNA expression)
were strongly correlated with the expression levels of each of
the individual candidate gene (Supplementary Table 1B), and
visually appeared to summarise the gene expression pattern well
(Figure 2c).
We first used this composite RNA expression variable to
examine the influence of potentially confounding intergroup
differences in clinical and demographic characteristics on the
expression levels of the top 10 genes. Stroke, age, anticoagulant
status, hypertension, antihypertensive status, dyslipidaemia,
history of myocardial infarction and history of atrial fibrillation
npj Genomic Medicine (2016) 16038
were regressed against the composite RNA expression levels of
the top 10 genes using multiple regression. We then performed
variance decomposition via the Lindeman-Merenda-Gold (LMG)
method to estimate the relative contributions of each regressor to
the total variance in composite RNA expression explained by the
resultant regression model.21 Stroke remained significantly
associated with the composite RNA expression levels of the top
10 genes after accounting for all potentially confounding factors
included in the model (Figure 3a), and was responsible for a
majority of the explained variance (77.9%, Figure 3b). In terms of
potentially confounding factors, both antihypertensive status and
anticoagulant status were significantly associated with the
composite RNA expression levels of the top 10 genes after
accounting for all other regressors (Figure 3a); however, these
associations only accounted for a small amount of the variance in
Published in partnership with the Center of Excellence in Genomic Medicine Research
Machine learning for stroke biomarker discovery
GC O’Connell et al
r=-0.11
p=0.532
STROKE SEVERITY:
MILD (NIHSS<5)
MODERATE (5≤ NIHSS<10)
SEVERE (NIHSS≥10)
1140
1200
1020
1080
900
STROKE SEVERITY (NIHSS)
960
840
780
720
660
600
540
480
360
420
300
180
240
120
0
CONTROL MAX
60
+2.4
2.2
2.0
1.8
1.6
1.4
1.2
1.0
0.8
0.6
0.4
0.2
0.0
0.2
0.4
0.6
-0.8
24
22
18
20
16
12
14
8
10
6
4
CONTROL MAX
COMPOSITE RNA EXPRESSION (AU)
r=0.34
p=0.039*
2
+2.4
2.2
2.0
1.8
1.6
1.4
1.2
1.0
0.8
0.6
0.4
0.2
0.0
0.2
0.4
-0.6
-0.8
0
COMPOSITE RNA EXPRESSION (AU)
5
TIME TO BLOOD DRAW (MINUTES)
Figure 4. Influence of stroke severity and time to draw blood draw on the coordinate expression levels of the top-ranked genes in discovery
cohort AIS patients. (a) Relationship between stroke severity, as assessed by NIHSS, and composite RNA expression levels of the top 10 genes
in discovery cohort AIS patients. (b) Relationship between time from symptom onset to blood draw and composite RNA expression levels of
the top 10 genes in discovery cohort AIS patients, with indication of stroke severity. Strength of correlations was tested via Spearman’s rho.
composite RNA expression explained by the model (6.5% and
4.5%, respectively, Figure 3b). Results of this multiple regression
analysis were supported by the results of a more traditional logistic
regression analysis in which the composite RNA expression levels
of the top 10 genes were identified as the only significant predictor
of stroke when considering the same potentially confounding
covariates (Supplementary Table 2). Taken as a whole, these
findings suggest that the pattern of differential expression
observed across the top 10 genes between groups is highly
associated with stroke independently of the assessed potential
confounding factors. Although these findings do suggest that
antihypertensive status and anticoagulant status may influence the
expression levels of the top 10 genes, the effect of this influence on
expression levels is likely minimal relative to the effect of stroke,
and intergroup differences in these factors were likely not
significant drivers of the selection of these genes by GA/kNN.
We next used this composite RNA expression variable to
examine the potential influence of stroke severity and time to
blood draw on the pattern of gene expression observed across the
top 10 genes. The composite RNA expression levels of the top 10
genes displayed a significant positive association with stroke
severity as assessed by the NIHSS (Figure 4a), suggesting that the
expression levels of the top 10 genes are likely directly responsive
to stroke pathology. We observed a weak nonsignificant negative
relationship between the composite RNA expression levels of the
top 10 genes and the time from symptom onset to blood draw
(Figure 4b). However, this negative relationship was likely driven
by the influence of stroke severity, given that the composite
expression levels of these genes were positively associated with
stroke severity, and patients undergoing more severe strokes
generally presented to the emergency department earlier than
patients undergoing less severe strokes (Figure 4b). Collectively,
these observations suggest that the stroke-induced differential
expression of the top 10 genes may have additional utility for the
stratification of stroke severity, and is relatively temporally stable
during the acute phase of care.
Validation cohort
We then tested the diagnostic ability of gene expression pattern
identified in the discovery cohort in an independent validation
cohort enroled via a second geographically and socioeconomically distinct clinical site (see Materials and methods section).
This validation cohort included an additional 39 AIS patients
along with two different control groups, one consisting of 30
neurologically asymptomatic controls and the other consisting
of 20 acute stroke mimics. Like in the discovery cohort, AIS
patients were older than neurologically asymptomatic controls;
however, AIS patients and asymptomatic controls were better
matched in terms of the prevalence of comorbidities and CVD
risk factors (Table 2). AIS patients were also significantly older
than stroke mimics, however, extremely well matched in terms
of all other clinical and demographic characteristics (Table 2).
Peripheral blood samples were once again obtained from
patients at emergency department admission, and the expression
levels of the top 10 genes identified by GA/kNN in the discovery
cohort were measured via qRT-PCR. The overall pattern of
differential expression between AIS patients and asymptomatic
controls observed across the top 10 genes in the discovery cohort
was also seen when comparing AIS patients and asymptomatic
controls in the validation cohort (Figure 5a). The strong ability of
the top 10 genes to differentiate between stroke patients and
asymptomatic controls in the discovery cohort using kNN was also
recapitulated in the validation cohort; the expression levels of the
top 10 genes used in combination were able to classify 95.6% of
subjects correctly with a sensitivity of 92.3% and a specificity of
100% (Figure 5b).
When comparing AIS patients to stroke mimics, the overall
pattern of differential expression observed across the top 10
genes was identical to that observed when comparing AIS
patients with asymptomatic controls; however, the magnitude of
these expression differences was smaller in the case of several
genes (Figure 5c). Despite this reduction in the magnitude of
differential expression, the expression levels of the top 10 genes
used in combination were still able to accurately discriminate
between AIS patients and stroke mimics, classifying 94.9% of
subjects correctly with a sensitivity of 97.4% and a specificity of
90.0% (Figure 5d). However, it is important to note that it was
evident that all 10 genes were required to achieve high levels of
diagnostic accuracy when comparing AIS patients with stroke
mimics (Figure 5d), whereas similar levels of accuracy could be
achieved with as few as the top four markers when comparing AIS
patients with neurologically asymptomatic controls in both the
discovery cohort (Figure 1b) and the validation cohort (Figure 5b).
Despite this, the collective validation cohort results supported
those of the discovery cohort, and provide further evidence that
the top 10 markers selected by GA/kNN have high potential
performance for identification of AIS.
Published in partnership with the Center of Excellence in Genomic Medicine Research
npj Genomic Medicine (2016) 16038
Machine learning for stroke biomarker discovery
GC O’Connell et al
6
Table 2.
Validation cohort clinical and demographic characteristics
Asymptomatic control versus AIS
Control (n = 30) AIS (n = 39)
Age (mean ± s.d.)
Female n (%)
NIHSS (mean ± s.d.)
Family history of stroke n (%)
Hypertension n (%)
Dyslipidaemia n (%)
Diabetes n (%)
Previous stroke n (%)
Atrial fibrillation n (%)
Myocardial infarction n (%)
Hypertension medication n (%)
Diabetes medication n (%)
Cholesterol medication n (%)
Anticoagulant or antiplatelet n (%)
rtPA n (%)
Current smoker n (%)
51.5 ± 14.3
25 (83.3)
0.0 ± 0.0
16 (53.3)
17 (56.7)
11 (36.7)
2 (6.70)
1 (3.30)
0 (0.00)
0 (0.00)
15 (50.0)
2 (6.70)
7 (23.3)
1 (3.30)
0 (0.00)
1 (3.30)
Statistic (df)
73.1 ± 13.3 t = − 6.41 (67)
25 (64.1)
χ2 = 3.14 (1)
8.6 ± 7.5
t = 7.16 (38)
15 (38.5)
χ2 = 1.52 (1)
32 (82.1)
χ2 = 5.31 (1)
16 (41.0)
χ2 = 0.14 (1)
8 (20.5)
χ2 = 2.62 (1)
7 (17.9)
χ2 = 3.53 (1)
13 (33.3)
χ2 = 12.3 (1)
11 (28.2)
χ2 = 10.0 (1)
27 (69.2)
χ2 = 2.63 (1)
8 (20.5)
χ2 = 2.62 (1)
14 (35.9)
χ2 = 1.26 (1)
23 (59.0)
χ2 = 23.1 (1)
13 (33.3)
χ2 = 12.3 (1)
9 (23.1)
χ2 = 5.33 (1)
Mimic versus AIS
P
40.001*
0.076
40.001*
0.213
0.021*
0.713
0.105
0.061
40.001*
0.002*
0.105
0.105
0.261
40.001*
40.001*
0.021*
Mimic (n = 20) AIS (n = 39)
58.0 ± 17.0
9 (45.0)
4.7 ± 4.9
5 (25.0)
17 (85.0)
13 (65.0)
7 (35.0)
5 (25.0)
3 (15.0)
6 (30.0)
16 (80.0)
6 (30.0)
12 (60.0)
12 (60.0)
0 (0.00)
2 (10.0)
P
Statistic (df)
73.1 ± 13.3 t = − 3.78 (57) 40.001*
25 (64.1)
χ2 = 1.98 (1)
0.159
8.6 ± 7.5 t = − 2.11 (57)
0.041*
2
15 (38.5)
χ = 1.07 (1)
0.301
32 (82.1)
χ2 = 0.08 (1)
0.775
16 (41.0)
χ2 = 3.08 (1)
0.081
8 (20.5)
χ2 = 1.46 (1)
0.226
2
7 (17.9)
χ = 0.52 (1)
0.524
2
13 (33.3)
χ = 2.25 (1)
0.134
11 (28.2)
χ2 = 0.02 (1)
0.885
27 (69.2)
χ2 = 0.78 (1)
0.378
2
8 (20.5)
χ = 0.66 (1)
0.418
2
14 (35.9)
χ = 3.12 (1)
0.078
23 (59.0)
χ2 = 0.01 (1)
0.939
13 (33.3)
χ2 = 8.55 (1)
0.004*
2
9 (23.1)
χ = 1.49 (1)
0.222
HIGH EXPRESSION
10
9
8
7
6
5
4
3
NUMBER OF TOP RANKED GENES
100.0
90.0
80.0
70.0
60.0
50.0
40.0
30.0
20.0
10.0
10
SENSITIVITY
SPECIFICITY
ACCURACY
9
0.020*
3E-06*
2E-06*
1E-05*
0.032*
0.033*
0.038*
1E-05*
3E-05*
3E-04*
8
p
1.2
1.5
1.8
1.8
-1.3
-1.3
-1.5
1.3
1.5
1.5
7
FOLD
6
ACUTE ISCHAEMIC STROKE
2
1
SENSITIVITY
SPECIFICITY
ACCURACY
HIGH EXPRESSION
ANTXR2
STK3
PDK4
CD163
MAL
GRAP
ID3
CTSZ
KIF1B
PLXDC2
LOW EXPRESSION
100.0
95.0
90.0
85.0
80.0
75.0
70.0
65.0
60.0
55.0
5
STROKE MIMIC
0.004*
3E-10*
1E-08*
4E-09*
0.004*
5E-04*
2E-04*
3E-06*
5E-08*
5E-09*
3
GENE
p
1.2
1.5
1.7
1.9
-1.4
-1.4
-1.6
1.3
1.6
1.7
4
LOW EXPRESSION
FOLD
2
ACUTE ISCHAEMIC STROKE
1
ASYMPTOMATIC CONTROL
PERCENT (%)
GENE
ANTXR2
STK3
PDK4
CD163
MAL
GRAP
ID3
CTSZ
KIF1B
PLXDC2
PERCENT (%)
Abbreviations: AIS, acute ischaemic stroke; df, degrees of freedom; NIHSS, National Institutes of Health stroke scale; rtPA, recombinant tissue plasminogen
activator.
*Indicates statistically significant values.
NUMBER OF TOP RANKED GENES
Figure 5. Differential expression and discriminatory ability of top-ranked genes within the validation cohort. (a) Peripheral blood differential
expression of the top 10 genes between validation cohort neurologically asymptomatic controls and AIS patients. (b) Combined ability of the
expression levels of the top 10 genes to discriminate between neurologically asymptomatic controls and AIS patients. (c) Peripheral blood
differential expression of the top 10 genes between acute stroke mimics and AIS patients. (d) Combined ability of the expression levels of the
top 10 genes to discriminate between acute stroke mimics and AIS patients. All gene expression values are reported as fold change relative to
control. Statistical significance of intergroup differences in gene expression was determined via two-sample two-way t-test, and P-values were
corrected to account for multiple comparisons via Holm's Bonferroni method.
DISCUSSION
The primary objective of this study was to apply the GA/kNN
approach to identify a pattern of gene expression in peripheral
blood that could potentially be optimised to identify AIS in the
acute phase of care. The 10 transcriptional markers identified by
GA/kNN in our analysis proved robust in their combined ability to
differentiate between AIS patients and controls in both the
discovery cohort and the independent validation cohort; not only
npj Genomic Medicine (2016) 16038
did these markers display levels of diagnostic accuracy that exceed
those reported in a majority of previous stroke biomarker studies,
they also demonstrated characteristics that suggest they have the
potential to be clinically useful. Besides having diagnostic utility,
some of the markers identified in this study may represent viable
therapeutic targets in the context of stroke immunopathology.
With regards to the countless number of peripheral blood
biomarker explorations that have been performed to date, to our
Published in partnership with the Center of Excellence in Genomic Medicine Research
Machine learning for stroke biomarker discovery
GC O’Connell et al
7
knowledge, only one prior investigation has reported similar levels
of diagnostic accuracy to those which we observed in this study in
terms discriminating between stroke patients and clinically
relevant control populations. Dambinova et al.22 recently reported
that plasma levels of brain-derived NR2 peptide, a degradation
product of N-methyl-D-aspartate receptor cleavage, could be used
to differentiate between stroke patients and a combination of
acute stroke mimics and neurologically asymptomatic controls
with 92% sensitivity and 96% specificity.22 However, a majority of
blood samples in this prior study were obtained between 24 and
72 h post-symptom onset, and it is currently unknown whether
NR2 peptide would exhibit an equivalent level of diagnostic
performance early in the acute phase of care. The 10-marker panel
identified in our analysis was tested earlier in the progression of
pathology, and thus exhibits an obvious advantage in that they
has the potential to provide actionable diagnostic information at
an early enough time point to influence critical triage decisions
that has an impact on outcome.
The 10-marker panel identified in our analysis displayed several
favourable characteristics that could make it well suited for
identification of ischaemic stroke in the acute care setting. Most
notably, the pattern of differential expression we observed
between AIS patients and controls appeared to be relatively
temporally stable. This is of clinical relevance from the standpoint
that it is well established that acute stroke patients tend to arrive
to the emergency department in two waves, the first within 4 h
from symptom onset (typically patients with more severe overt
symptoms), and the second more than 8 h from symptom onset
(typically patients with milder symptoms).23 For this reason, a
potential diagnostic for identification of acute stroke needs to be
diagnostically robust across a wide time window with regards to
the progression of stroke pathology. Another diagnostically
beneficial characteristic we observed was that the strokeassociated pattern of expression across these 10 markers was
positively correlated with the NIHSS. Thus, these markers may
have utility in stratifying injury severity, information that is
commonly considered when making decisions regarding the
prescription of interventional treatment.4 These characteristics,
along with the fact that we observed levels of sensitivity and
specificity, which well exceed those achievable via the tools
currently available to clinicians for the identification of stroke
during acute triage, suggest that the 10-marker panel identified in
our analysis has legitimate potential for future clinical
implementation.
Besides having diagnostic utility, some of the markers identified
in this study may represent potential therapeutic targets in the
context of stroke immunopathology. Perhaps, the most interesting
of these markers from this standpoint is CD163. It is well
established that stroke induces a state of peripheral adaptive
immune suppression characterised by a limited capacity of
lymphoid cells to respond to antigen.24,25 This suppressed
adaptive immune state leaves patients highly susceptible to
post-stroke infection,26 which is the leading cause of death in the
post-acute phase of care.27 CD163 encodes for a protein known as
cluster of differentiation 163 (CD163), a membrane-bound
scavenger receptor for extracellular haemoglobin, which is
predominantly expressed on immune populations of myeloid
lineage.28,29 Mature CD163 is known to undergo ectodomain
shedding to generate a soluble truncated peptide (sCD163), which
has been shown in multiple studies to directly interact with
lymphocytes and inhibit antigen-mediated activation.30–32 Interestingly, we observed elevated RNA expression levels of CD163 in
the peripheral blood of AIS patients; it is possible that CD163
expression is increased in the innate peripheral immune system
in response to stroke-induced increases in circulating free
haemoglobin,33 subsequently driving an increase in levels of
circulating sCD163, which act to suppress lymphocyte activation.
In support of this hypothesis, unpublished preliminary data from
our laboratory suggest that plasma levels of sCD163 are elevated
in AIS patients during the acute phase of care, and are positively
correlated with RNA expression levels of CD163 in whole blood.
Ongoing work in our laboratory is aimed at characterising
the relationship between peripheral-blood sCD163 levels and
stroke-induced adaptive immune dysfunction, as CD163 may be
therapeutically targetable as a means of rescuing adaptive
immune responsiveness following stroke.
In addition to CD163, the markers identified in this study
included several other genes that may be pathologically relevant
within the context of the stroke-induced peripheral immune
response. We observed downregulated expression levels of MAL
and GRAP in the peripheral blood of AIS patients; both genes
encode proteins that are critically involved in T-cell receptor
activation and signal transduction.34,35 Furthermore, AIS patients
exhibited elevated expression levels of STK3, a gene encoding a
seine threonine kinase involved in pro-apoptotic signal transduction36,37 and suppression of lymphocyte proliferation.38 Taken
as a whole, the differential regulation we observed across these
genes is consistent with suppressed adaptive immune state
induced in response to stroke, and may be mechanistically
involved in blunting the responsiveness of the adaptive immune
system following ischaemic brain injury. Conversely, two of the
markers identified as being upregulated in the peripheral blood of
AIS patients in this study, KIF1B and ANTXR2, may be mechanistically involved in the innate immune response to ischaemic
insult. It is well established that stroke induces robust recruitment
of myeloid-derived innate immune populations such as neutrophils and monocytes from the peripheral blood into the brain
parenchyma;39,40 both genes encode proteins that have been
shown to have a role in cellular adhesion and migration,41–44 and
thus may be mechanistically involved in this process.
Collectively, the findings reported here are exciting; however, it
is important to note that this study was not without limitations.
Perhaps, most notably was the fact that AIS patients and
neurologically asymptomatic controls in our discovery cohort
were not well matched with regards to several clinical and
demographic characteristics; thus, intergroup differences in these
factors had the potential to confound the selection of strokespecific genes in our GA/kNN analysis. To account for this possible
limitation, we utilised a relatively high termination cutoff for
optimal solution selection; under these conditions, a confounding
factor would have to be almost ubiquitously present in one group,
and nearly ubiquitously absent in the other, for it to influence the
selection of candidate genes. The results of our multiple
regression analysis suggest that this strategy was largely successful; however, they did infer that medication status may influence
the expression of the candidate genes. Despite this, the 10
candidate genes were still able to demonstrate high levels of
diagnostic accuracy when discriminating between groups that
were better matched in terms of these factors in the validation
cohort.
Taken as a whole, the results of this preliminary study
demonstrate that a highly accurate RNA-based companion
diagnostic for AIS is plausible using a relatively small number of
markers, and also highlight the potential power of machinelearning approaches for biomarker discovery in the realm of CVD.
The 10 transcriptional biomarkers identified in this study displayed
levels of diagnostic performance that well exceed those reported
in a majority of previous stroke biomarker investigations, as well as
several characteristics that suggest that they may have true
clinical utility for identification of ischaemic stroke during the
acute phase of care. Furthermore, future exploration of these
markers may reveal novel mechanisms that underlie the
peripheral immune response to stroke, and lead to novel
therapeutic targets in the context of stroke-induced immunopathology. Owing to the robust results of this preliminary analysis,
Published in partnership with the Center of Excellence in Genomic Medicine Research
npj Genomic Medicine (2016) 16038
Machine learning for stroke biomarker discovery
GC O’Connell et al
8
the 10 transcriptional biomarkers identified in this study warrant
further evaluation to determine their true clinical efficacy.
MATERIALS AND METHODS
Discovery cohort patients
Acute ischaemic stroke patients and neurologically asymptomatic controls
were recruited at Suburban Hospital, Bethesda, MD, USA, which serves an
upper-class metro area bordering Washington DC. AIS cases were of mixed
aetiology, and diagnosis was confirmed using magnetic resonance
imaging according to the established criteria for diagnosis of acute
ischaemic cerebrovascular syndrome.45 The median time from symptom
onset to blood draw was 5.3 h, as determined by the time the patient was
last known to be free of AIS symptoms. In the case of patients who
received thrombolytic therapy, blood samples were collected before the
administration of recombinant tissue plasminogen activator. Injury severity
was determined according to NIHSS at the time of blood draw. Control
subjects were deemed neurologically normal by a trained neurologist at
the time of enrolment. Demographic information was collected from either
the subject or significant other by a trained clinician. All procedures were
approved by the institutional review boards of the National Institute of
Neurological Disorders/National Institute on Aging at the National
Institutes of Health and Suburban Hospital. Written informed consent
was obtained from all subjects or their authorised representatives before
any study procedures.
for stroke upon imaging according to the established acute ischaemic
cerebrovascular syndrome diagnostic criteria,45 were identified as acute
stroke mimics. Discharge diagnoses of stroke mimics included cases
of seizures, complex migraines and other conditions, which induce
neurological symptoms such as hypertensive encephalopathy. The median
time from symptom onset to blood draw was 4.6 h and all blood was
sampled before the administration of recombinant tissue plasminogen
activator. Assessment of injury severity, screening of neurologically
asymptomatic controls and collection of demographic information were
performed in an identical manner. All procedures were approved by the
institutional review boards of West Virginia University and Ruby Memorial
Hospital. Written informed consent was obtained from all subjects or their
authorised representatives before study procedures.
Quantitative reverse transcription PCR
Complementary DNA was generated from purified RNA using the Applied
Biosystems high-capacity reverse transcription kit. For qPCR, target
sequences were amplified from 10 ng of complementary DNA input using
sequence-specific primers (Supplementary Table 3) and detected via SYBR
green (PowerSYBR, Thermo Fisher, Waltham, MA, USA) on the RotorGeneQ
(Qiagen). Raw amplification plots were background-corrected and CT
values were generated via the RotorGeneQ software package. All reactions
were performed in triplicate. Transcripts of B2M, PPIB and ACTB were
amplified as references, and normalisation was performed using the
NORMAgene data-driven normalisation algorithm.46
Blood collection and RNA extraction
Statistical analysis
Peripheral whole-blood samples were collected via PAXgene RNA tubes
(Qiagen, Valencia, CA, USA) and stored at − 80 °C until RNA extraction. Total
RNA was extracted via the PreAnalytiX PAXgene blood RNA Kit (Qiagen)
and automated using the QIAcube System (Qiagen). Quantity and purity of
isolated RNA was determined via spectrophotometry (NanoDrop, Thermo
Scientific, Waltham, MA, USA). Quality of RNA was confirmed by chip
capillary electrophoresis (Agilent 2100 Bioanalyzer, Agilent Technologies,
Santa Clara, CA, USA).
Parametric statistical analysis was performed using SPSS (IBM, Chicago, IL,
USA) in combination with R 2.14 via the SPSS R integration plug-in. χ2-tests
were used for comparison of dichotomous variables, whereas Student's
t-tests were used for comparison of continuous variables. Spearman’s rho
was used to assess the strength of correlational relationships. For multiple
regression analysis, variance decomposition was performed using the
relaimpo R package.21 Penalised logistic regression was performed using
the logistf R package.47 The level of significance was established at 0.05 for
all parametric statistical testing. In the cases of multiple comparisons,
P-values were adjusted using Holm’s Bonferonni method.48
RNA amplification and microarray
RNA was amplified and biotinylated using the TotalPrep RNA Amplification
Kit (Applied Biosystems, Grand Island, NY, USA). Samples were hybridised
to HumanRef-8 expression bead chips (Illumina, San Diego, CA, USA)
containing 25,000 unique probes and scanned using the Illumina
BeadStation. Raw probe intensities were background-subtracted,
quantile-normalised and then summarised at the gene level using Illumina
GenomeStudio. Sample labelling, hybridisation and scanning were
performed per standard Illumina protocols. Raw data are assessable
through the National Center for Biotechnology Information Gene
Expression Omnibus via accession number GSE16561.
ACKNOWLEDGEMENTS
The authors would foremost like to thank the subjects and their families, as this work
was truly made possible by their selfless contribution. The authors also thank the
stroke team Ruby Memorial Hospital and the NIH stroke team at Suburban Hospital
for supporting this research effort. Work was partially funded via a Robert Wood
Johnson Foundation Nurse Faculty Scholar award to TLB (70319) and a National
Institutes of Health CoBRE sub-award to TLB (P20 GM109098).
CONTRIBUTIONS
GA/kNN analysis
Normalised microarray data were filtered based on absolute fold difference
between stroke and control; genes exhibiting a greater than 1.7 absolute
fold difference in expression between AIS and control were retained for
analysis. Filtered gene expression data were z-transformed and GA/kNN
analysis was performed using C source code developed by Li et al.20
compiled in Linux Mint. Two thousand near-optimal solutions were
collected per sample using five nearest neighbours, majority rule, a
chromosome length of five and a termination cutoff of 0.97. Leave-one-out
cross-validation was performed using the top 50 ranked genes. The top 50
genes were tested against random gene combinations, which were
selected using the R sample() function (R 2.14, R Project for Statistical
Computing).
Work was conceptualised by GCO and TLB. Procedures for collection of clinical
samples and recruitment of human subjects were overseen by TLB and PDC.
Recruitment of subjects and collection of samples were performed by GCO, ABP, NLW and CST. Experiments were designed by GCO and performed by GCO and MBT.
Data were analysed by GCO. Manuscript was written by GCO with contributions from
TLB, ABP, NL-W, CST and PDC.
COMPETING INTERESTS
GCO and TLB have a patent pending re: genomic patterns of expression for stroke
diagnosis. TLB serves as chief scientific officer for CereDx Incorporated, a biotech firm
which develops diagnostics for brain injury. The remaining authors declare no
conflict of interest.
Validation cohort patients
AIS patients, acute stroke mimics and neurologically asymptomatic
controls were recruited at Ruby Memorial Hospital, Morgantown, WV,
USA, which serves an impoverished rural region of West Virginia that
displays some of the highest CVD rates in the nation.1 As with the
discovery cohort, AIS cases were of mixed aetiology, and diagnosis was
confirmed via neuroradiological imaging. Patients admitted to the
emergency department as suspected strokes based on the overt
presentation of stroke-like symptoms, but receiving a negative diagnosis
npj Genomic Medicine (2016) 16038
REFERENCES
1. Go A. S. et al. Heart disease and stroke statistics-2013 update: a report from the
American Heart Association. Circulation 2013; 127: e6-e245.
2. Lees, K. R. et al. Time to treatment with intravenous alteplase and outcome in
stroke: an updated pooled analysis of ECASS, ATLANTIS, NINDS, and
EPITHET trials. Lancet 375, 1695–1703 (2010).
3. Marler, J. R. et al. Early stroke treatment associated with better outcome: the
NINDS rt-PA stroke study. Neurology 55, 1649–1655 (2000).
Published in partnership with the Center of Excellence in Genomic Medicine Research
Machine learning for stroke biomarker discovery
GC O’Connell et al
9
4. Jauch, E. C. et al. Guidelines for the early management of patients with acute
ischemic stroke: a guideline for healthcare professionals from the American Heart
Association/American Stroke Association. Stroke 44, 870–947 (2013).
5. Goldstein, L. B., Hey, L. A. & Laney, R. North Carolina stroke prevention and
treatment facilities survey. Statewide availability of programs and services. Stroke
31, 66–70 (2000).
6. Purrucker, J. C. et al. Comparison of stroke recognition and stroke severity scores
for stroke detection in a single cohort. J. Neurol. Neurosurg. Psychiatry 86,
1021–1028 (2015).
7. Harbison, J. et al. Diagnostic accuracy of stroke referrals from primary care,
emergency room physicians, and ambulance staff using the face arm speech test.
Stroke 34, 71–76 (2003).
8. Xian, Y. et al. Association between stroke center hospitalization for acute ischemic
stroke and mortality. JAMA 305, 373–380 (2011).
9. Saenger, A. K. & Christenson, R. H. Stroke biomarkers: progress and challenges for
diagnosis, prognosis, differentiation, and treatment. Clin. Chem. 56, 21–33 (2010).
10. Jickling, G. C. & Sharp, F. R. Blood biomarkers of ischemic stroke. Neurotherapeutics 8, 349–360 (2011).
11. Kernagis, D. N. & Laskowitz, D. T. Evolving role of biomarkers in acute cerebrovascular disease. Ann. Neurol. 71, 289–303 (2012).
12. Whiteley, W., Tseng, M.-C. & Sandercock, P. Blood biomarkers in the diagnosis of
ischemic stroke: a systematic review. Stroke 39, 2902–2909 (2008).
13. Rothstein, L. & Jickling, G. C. Ischemic stroke biomarkers in blood. Biomark. Med.
7, 37–47 (2013).
14. Barr, T. L. et al. Genomic biomarkers and cellular pathways of ischemic stroke by
RNA gene expression profiling. Neurology 75, 1009–1014 (2010).
15. Moore, D. F. et al. Using peripheral blood mononuclear cells to determine a gene
expression profile of acute ischemic stroke: a pilot investigation. Circulation 111,
212–221 (2005).
16. Tang, Y. et al. Gene expression in blood changes rapidly in neutrophils and
monocytes after ischemic stroke in humans: a microarray study. J. Cereb. Blood
Flow Metab. 26, 1089–1102 (2006).
17. Stamova, B. et al. Gene expression profiling of blood for the prediction of
ischemic stroke. Stroke 41, 2171–2177 (2010).
18. Li, Y., Krahn, J. M., Flake, G. P., Umbach, D. M. & Li, L. Toward predicting metastatic
progression of melanoma based on gene expression data. Pigment Cell Melanoma Res. 28, 453–463 (2015).
19. Li, L., Weinberg, C. R., Darden, T. A. & Pedersen, L. G. Gene selection for sample
classification based on gene expression data: study of sensitivity to choice of
parameters of the GA/KNN method. Bioinformatics 17, 1131–1142 (2001).
20. Li, L., Darden, T. A., Weinberg, C. R., Levine, A. J. & Pedersen, L. G. Gene assessment and sample classification for gene expression data using a genetic algorithm/k-nearest neighbor method. Comb. Chem. High Throughput Screen 4,
727–739 (2001).
21. Grömping, U. Relative importance for linear regression in R: the package
relaimpo. J. Stat. Softw. 17, 139–147 (2006).
22. Dambinova, S. A. et al. Diagnostic potential of the NMDA receptor peptide assay
for acute ischemic stroke. PLoS ONE 7, 1–7 (2012).
23. Kleindorfer, D. O. et al. Emergency department arrival times after acute ischemic
stroke during the 1990s. Neurocrit. Care 7, 31–35 (2007).
24. Meisel, C., Schwab, J. M., Prass, K., Meisel, A. & Dirnagl, U. Central nervous system
injury-induced immune deficiency syndrome. Nat. Rev. Neurosci. 6,
775–786 (2005).
25. Vogelgesang, A. & Dressel, A. Immunological consequences of ischemic stroke:
Immunosuppression and autoimmunity. J. Neuroimmunol. 231, 105–110 (2011).
26. Vogelgesang, A. et al. Analysis of lymphocyte subsets in patients with stroke and
their influence on infection after stroke. Stroke 39, 237–241 (2008).
27. Vernino, S. et al. Cause-specific mortality after first cerebral infarction: a
population-based study. Stroke 34, 1828–1832 (2003).
28. Kristiansen, M. et al. Identification of the haemoglobin scavenger receptor. Nature
409, 198–201 (2001).
29. Schaer, D. J. et al. CD163 is the macrophage scavenger receptor for native and
chemically modified hemoglobins in the absence of haptoglobin. Blood 107,
373–380 (2006).
30. Frings, W., Dreier, J. & Sorg, C. Only the soluble form of the scavenger receptor
CD163 acts inhibitory on phorbol ester-activated T-lymphocytes, whereas
membrane-bound protein has no effect. FEBS Lett. 526, 93–96 (2002).
31. Högger, P. & Sorg, C. Soluble CD163 inhibits phorbol ester-induced lymphocyte
proliferation. Biochem. Biophys. Res. Commun. 288, 841–843 (2001).
32. Timmermann, M., Buck, F., Sorg, C. & Högger, P. Interaction of soluble CD163 with
activated T lymphocytes involves its association with non-muscle myosin heavy
chain type A. Immunol. Cell Biol. 82, 479–487 (2004).
33. Huang, P. et al. Serum free hemoglobin as a novel potential biomarker for acute
ischemic stroke. J. Neurol. 256, 625–631 (2009).
34. Trüb, T., Frantz, J. D., Miyazaki, M., Band, H. & Shoelson, S. E. The role of a
lymphoid-restricted, Grb2-like SH3-SH2-SH3 protein in T cell receptor signaling.
J. Biol. Chem. 272, 894–902 (1997).
35. Antón, O. M., Andrés-Delgado, L., Reglero-Real, N., Batista, A. & Alonso, M. A. MAL
protein controls protein sorting at the supramolecular activation cluster of
human T lymphocytes. J. Immunol. 186, 6345–6356 (2011).
36. Watabe, M., Kakeya, H. & Osada, H. Requirement of protein kinase (Krs/MST)
activation for MT-21-induced apoptosis. Oncogene 18, 5211–5220 (1999).
37. Taylor, L. K., Wang, H. C. & Erikson, R. L. Newly identified stress-responsive protein
kinases, Krs-1 and Krs-2. Proc. Natl Acad. Sci. USA 93, 10099–10104 (1996).
38. Mzali, R. et al. Regulation of Rho signaling pathways in interleukin-2-stimulated
human T-lymphocytes. FASEB J. 19, 1911–1913 (2005).
39. Kamel, H. & Iadecola, C. Brain-immune interactions and ischemic stroke: clinical
implications. JAMA Neurol. 69, 576–581 (2012).
40. Ladecola C. & Anrather J. The immunology of stroke: from mechanisms to
translation. Nat. Med. 17, 796–808 (2011).
41. Dong, Z. et al. Leptin-mediated regulation of MT1-MMP localization is KIF1B
dependent and enhances gastric cancer cell invasion. Carcinogenesis 34,
974–983 (2013).
42. Chen, S. et al. KIF1B promotes glioma migration and invasion via cell surface
localization of MT1-MMP. Oncol. Rep. 35, 971–977 (2016).
43. Bell, S. et al. Differential gene expression during capillary morphogenesis in 3D
collagen matrices: regulated expression of genes involved in basement membrane matrix assembly, cell cycle progression, cellular differentiation and
G-protein signaling. J. Cell Sci. 114, 2755–2773 (2001).
44. Vink J. Y., Charles-Horvath P. C., Kitajewski J. K. & Reeves C. V. Anthrax toxin
receptor 2 promotes human uterine smooth muscle cell viability, migration and
contractility. Am. J. Obstet. Gynecol. 210, 154.e1–154.e8 (2014).
45. Kidwell, C. S. & Warach, S. Acute ischemic cerebrovascular syndrome: diagnostic
criteria. Stroke 34, 2995–2998 (2003).
46. Heckmann, L.-H., Sørensen, P. B., Krogh, P. H. & Sørensen, J. G. NORMA-Gene: a
simple and robust method for qPCR normalization based on target gene data.
BMC Bioinformatics 12, 250 (2011).
47. Heinze, G. & Schemper, M. A solution to the problem of separation in logistic
regression. Stat. Med. 21, 2409–2419 (2002).
48. Holm, S. A simple sequentially rejective multiple test procedure. Scand. J. Stat. 6,
65–70 (1979).
This work is licensed under a Creative Commons Attribution 4.0
International License. The images or other third party material in this
article are included in the article’s Creative Commons license, unless indicated
otherwise in the credit line; if the material is not included under the Creative Commons
license, users will need to obtain permission from the license holder to reproduce the
material. To view a copy of this license, visit />by/4.0/
© The Author(s) 2016
Supplementary Information accompanies the paper on the npj Genomic Medicine website ( />
Published in partnership with the Center of Excellence in Genomic Medicine Research
npj Genomic Medicine (2016) 16038