electrical power cable engineering (6)
Bạn đang xem bản rút gọn của tài liệu. Xem và tải ngay bản đầy đủ của tài liệu tại đây (920.29 KB, 14 trang )
CHAPTER
6
ELECTRICAL PROPERTIES
OF
INS
ULATl
NG
MATERIALS
Bruce
S.
Bernstein
1.
INTRODUCTION
Electrical properties of interest for insulation materials
can
be
classified into
two
major categories:
Those
of significance
at
low voltage operating
stresses
0
Those
of
importance
at
high
voltage operating
stresses
At
low
stresses,
the properties
of
interest relate to dielectric
constant,
power
factor, and
conductivity
(resistivity).
Dielectric constant represents the ability
of
the
insulation to "hold charge." Power factor
represents
a
measure
of the amount
of
energy lost
as
heat
rather
than
transmitted
as
electrical energy.
A
good
dielectric (insulation) material
is
one
that
holds little charge
(low
dielectric
constant) and
has
very low losses (low power factor). Polyolefins represent
examples
of
polymers that
possess
excellent
combinations
of
these properties.
This
is
discussed
in depth
in
Chapter
5.
At
high
stresses
greater
than
operating
stress
the characteristic of
importance
is
dielectric
strength.
Here, the
insulation
must
be
resistant
to
partial
discbarges (decomposition of
air
in
voids
or
microvoids within the insulation).
Also
of interest
is
the
inherent
ability of the polymeric
insulation
material to
resist decomposition
under
voltage
stress.
Unfortunately, the
measured
dielectric
strength
is
not
a
constant,
but
has
a variable
value
depending
upon
how the
measurement
is
performed.
This
will
be
discussed later
in
this
chapter.
In
any
event, the dielectric
strength
must
be
"high*
for the
insulation
to
be
functional.
This
chapter will
review
factors
that
influence
electrical
properties
at
low
and
high
voltage
stresses.
87
Copyright © 1999 by Marcel Dekker, Inc.
2.
STRUCTUREPROPERTY
RELATIONSHIPS
The electrical properties
of
an
insulation materials
are
controlled by their
chemical structure. Chapter
5
reviewed the inherent chemical
structure
of
polyolefins,
and
described how the structure influences physicochemicai
properties.
In
this
chapter,
we
shall
review
how these
factors
influence
the
electrical properties. The
emphasis
shall
be
on
polyolefins.
Low
stress
electrical properties
are
determined by the polar
nature
of
the
polymer chains
and
their degree
of
polarity.
Polyethylene,
composed
of
carbon
and hydrogen
or
methylene chains,
is
non-polar
in
nature,
and
has
low
conductivity.
If
a
polar component, such
as
a carbonyl,
is
on
the chain, the
polymer chain now becomes
more
polar
and
the characteristics that lead to
low
conductivity
are
diminished. Ethylene copolymers
with
propylene
retain
their
non-polar nature since the propylene moiety
is
as
non-polar
as
is
the
ethylene
moiety.
When
a
polyolefin
is
subjected to
an
electrical field, the polymer chains have
a
tendency to become polarized.
Figure
6-1
shows what
happens
when
a
polymer
is
"stressed"
between electrodes,
with
different
polarities
resulting.
Figure
6-2
shows how the polymer insulation material responds. There
is
a tendency
for
the
positive
charges
on
the
polymer
to
move
toward
the
negative
electrode,
and
for
the negative charges on the
polymer
to move toward the
positive electrode,
hence pulling the polymer
in
two
directions.
This
is
a
gad
description,
and
does
not
take into account the chemical
structure,
which
is
discussed later.
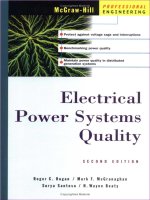
Figure
6-1
Polarization
of
a
Polymer
Subjected
to
an
Electric
Field
I-
No
Field
Field Applied
Polymer Becomes
Polarized
Schematic description
of
a
polymer subjected to electric field; polymer becomes
polarized.
88
Copyright © 1999 by Marcel Dekker, Inc.
Figure
6-2
Charge
Migration
on
Polymer
Cbains
Subjected
to
Electric
Field
Electrode
Polymer Electrode Electrode Polymer
Electrode
(Positive) (Negative)
No
Field Field Applied
Insulation response
to
electric field application. Positive charges on polymer
chain migrate
toward
the cathode and negative charges migrate toward the
anode.
Where do these charges come
from?
After all, we have described the polyolefins
as
being comprised of carbon and hydrogen, and as
not
being
polar
compared
to
say
the polyamides or ethylene copolymers possessing carbonyl or carbo;\?;late
groups.
It
can
be
noted that such description
is
“ideal”
in
nature.
While being
technically correct for a pure polyoolefin,
in
the
real
world there are always
small
amounts
of such polar
materials
present
This
will
be
discussed later.
Figure
6-3
shows
what
may
happen
to
a polymer insulation material
that
has
polar
groups
on
the side branches, rather
than
on the main polymer chain. Note
that
in
this
idealized
description
of
the “folded” chain, the
main
chain
does
not
undergo
any
movement under voltage
stress.
The side chains, which were once
“random,”
are
now
aligned toward the electrodes. Figure
6-4
shows a
“more
realistic“ coiled polymer chain with polar branches. Note how the alignment
toward
the
positive and negative electrodes
has
taken
place.
89
Copyright © 1999 by Marcel Dekker, Inc.
Figure
6-3
Schematic Description
of
Orientation
of
Polar
Functionality
on
Polymer
Side
Chains
Subjected
to
Electric
Field
No
Voltage Voltage
Stress
Applied
Under voltage stress,
a
polar
chain
orients
toward the cathode
or
anode.
depending
upon
the charge
it
possess.
The
nan-polar
chain
does
not
migrate.
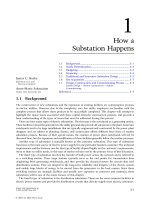
Figure
6-4
Polarization
of
Side
Chains
Depicted
on
a
Coiled
Polymer
II
,+
7
-I
No
Voltage
Field
Field
App
tied
Polymer
Becomes
Polarized
A
polymer
is
typically coiled,
as
shown
here.
The
positive
charges
on
a
polymer
are
attracted
to
the
cathode.
The
negative
charges
are
attracted
toward
the anode.
The movement
of
these
charged
regions
causes
motion
of
the
entire side
chain.
In
Figure
6-5,
we show what happens
to
the
main
chain.
Prior
to
this,
we
had
considered
what happened
to
the
relatively
short
branches. However, the entire
main
chain
may
undergo
motion
also,
assuming
it
possesses
functional
groups
that
respond
to
the
voltage
stress.
The
figure
shows
that
entire
chain
segments
may
move
and
rotate,
in
accordance
with
the field
90
Copyright © 1999 by Marcel Dekker, Inc.
Figure
6-5
Main Chain Motion
of
Polymer
Subjected to
Electric
Field
When the main chain length possesses charged regions, the entire main chain
may exhibit motion under the electric field. Here, the center portion of the thin
chain migrates to the left. The lower portion of the chain, depicted here
as
being
thick, migrates toward the right. The depiction indicates that one chain is
positively charged and the other is negatively charged.
It should
be
emphasized that this description is what would happen under
dc.
Consider now what would happen under ac; here the alignments will have to be
shiRing back and forth in accordance with the polarity change. Furthermore, this
will take place at a rate controlled by the frequency. In considering these points,
it becomes evident that the response
of
a polyolefin polymer, even a slightly
polar one, is quite different under ac than dc. The next question to consider is
what happens if the movement
of
the chains cannot “keep up” with the change
in frequency? Of course, our interest is in the
50
to
60
hertz range,
but
to
understand the polymer response, it
is
desirable to review what happens over a
very
broad frequency range.
This
is reviewed
in
the Section
3.0.
Before entering
that subject, it
is
necessary to recall that the polymer chains that
we
have been
considering consist of many, many methylene groups linked together and these
are non-polar
in
nature. However, after formation (polymerization), these very
long chains are always subjected to small chemical changes. These small
chemical changes, known as oxidation, may
omr
during conversion
of
the
monomer to the polymer. This may also occur during conversion of the polymer
to a fabricated
part
(in
our
case, the cable insulation). When extrusion
is
performed, the polymer
is
heated to very high temperatures in an extruder barrel,
and is subjected to mixing and grinding due to screw motions.
As
noted earlier,
an
effort is made to prevent this elevated-temperature-induced degradation (but
more realistically, the effect is kept to a minimum) by incorporating an
antioxidant into the polymer. The antioxidant preferentially degrades and
protects the polymer insulation. However a small degree
of
oxidative
degradation cannot be prevented, and always occurs. Therefore there will always
91
Copyright © 1999 by Marcel Dekker, Inc.
be
some
oxidized functional groups
on
the polymer chains. These are important
points
to
keep
in
mind when reviewing
the
polymer insulation response to
frequency.
3.0
DIELECTRIC CONSTANT AND POWER FACTOR
Different regions of the polymer chains will be sensitive and respond differently
to
voltage stress. This phenomena is intimately related
to
the ftequency.
Different hnctional
groups
will be sensitive to different frequencies. When the
“proper” frequency-functional group combination occurs, the chain portion will
respond by moving, e.g., rotating. Since this phenomenon
is
frequency
dependent, one might expect that different responses will result
from
different
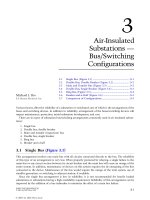
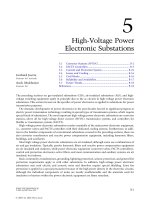
functional group-frequency combinations. This is exactly what occurs. Referring
to the top curve
in
Figure
6-6,
we can see that at low frequencies, when
stress
is
applied, the polar region-dipoles-can respond and
“accept”
the charge, and align
as described above. The dielectric constant is relatively high under these
conditions.
As
the fiequency increases, no change occurs in this effect will occur
as
long as
the
dipoles can respond. At
some
point as the frequency continues to
increase, the chains
will
have difficulty responding as fast as the field
is
changing. When
the
fiequency change is occurring at
so
rapid
a
rate that no
rotation can
occur,
the charge cannot be held and the dielectric constant
will
be
lowered.
Figure
6-6
Dielectric Constant and
Power
Factor
as
a Function
of
Frequency
L
I
I
I
I
I
I
I
I
log
w
-
log
YJ
-
Upper portion
of
Figure
6-6
depicts the change in dielectric constant with
frequency. The lower portion
of
the figure depicts the change in power factor
with frequency.
92
Copyright © 1999 by Marcel Dekker, Inc.
For a polymer like polyethylene, with very small amounts of polar
functionality,
the dielectric constant is always low (compared to a more polar polymer such
as
a
polyamide [Nylon for example]). However, oxidized
regions
will respond
more readily due to their more polar nature, The reason for the change in
dielectric
constant
with fresuency is clear. It should also
be
noted that other
parameters
affect
this
property; e.g., temperature.
In
essence,
any
change that
afkcts
motion of the polymer chain
will
affect the dielectric constant.
The point where
the
polymer
chain
segments undergo change
in
rate of rotation
is
of
special
interest. The lower curve of Figure
6-6,
focusing
on
losses (e.g.,
power factor), shows a
peak
at
this
point.
In
considexing power
factor,
the same
explanation applies; changes
are
affected by frequency and specific polymer
nature.
At low frequencies, the dipoles on the polymer chains follow variations
in the ac field, and
the
current
and
voltage
are
out
of
phase; hence the losses are
low. At very
high
fkquencies as noted above, the dipoles cannot move rapidly
enough to respond,
and
hence the losses
are
low
here
also. But
where
the change
is
taking
place, the losses are greatest.
This
can
be
visualized by
thinking
in
terms
of motion causing the energy
to
be
mechanical rather
than
electrical
in
nature.
It is
common
to refer to the dielectric
constant
and power factor at
50
or
60
Hertz,
and at 1,000
hem.
In
relating
the
information
shown
in Figure
6-6
to
the earlier
figures,
it
is
to
be
noted
that
the polar functionality can
be
due to motion of
main
chains or
branches. Where the oxidized groups
are
the
same,
as
in
carbonyl, one could
expect that the chains (ideally) to respond the same way at the same frequency.
But
what
happens
if
there
are
different
functional
groups present such as a
cadmnyl, carboxyl, or even amide or imide
functionality?
Also,
how does the
main
chain
nature
affect
all
this?
The answer is that these factors
are
quite
significant. Different functional groups will respond differently at the same
frequency, and the main chain
can
hinder motion due to its viscoelastic nature.
If
the dipole is rigidly attached
on
the polymer backbone, then
main
chain
motion
is
going
to
be
involved.
If
the dipole is on a branch, it
can
be
considered
to
be
flexibly attached,
and
the rate
of
motion
of
the branch
will
be
expected to
differ
from
the
main
chain,
even
if
the functional group
is
the same. The end
result
of
all
of
this is a phenomenon called dispersion. Here the chains move at
Werent
rates
at
any
single fresuency and temperature. They
may
exhibit
a
change Over a
broad
region
rather
than
a
sharp,
localized
region
as the
frequency
and temperature
is
changed
slightly.
For purposes of understanding power cable insulation response, the
main
interest
is,
of
course,
at
50
or
60
hertz.
Also,
our
interest is
in
what is intended
to
be
relatively non-polar systems. It is
necessary
to remember that
no
system is
perfect and there will
be
variations in degrees of polarity
not
only from one
insulation material to another,
and
not only from one
grade
of
the same material
93
Copyright © 1999 by Marcel Dekker, Inc.
to another, but perhaps also form one batch of supposedly identical material
to
another. Much depends upon the processing control parameters during
extrusion.
The literature reports dielectric
losses
of many Merent
types
of
polyolefins
as
a
function
of
temperahue, at controlled frequencies. Hence, it is known
that
conventional low density polyethylene undergoes losses at
various
Merent
temperatures.
In
addition, antioxidants, and antioxidant degradation by products,
low molecular weight molecules,
will
also respond, and
this
complicates
interpretation. With conventional crosslinked polyethylene, the situation is even
more complex as there are peroxide residues
and
crosslinking agent by-products.
These low molecular weight organic molecules, acetophenone, dimethyl
benzyl
alcohol, alpha methyl styrene,
and
smaller quantities
of
other
compounds,
will
gradually migrate out
of
the
insulation
over time. Hence interpretation of
data
requires
not
only
knowledge
of
the system, but some degree
of
caution
is
prudent.
In
addition
to
all
of this,
if
there
are
foreign
contaminants present, it
is
possible that they also
can
influence the mead dielectric constant
and
power
factor.
The dielectric constant of polyethylene
is
dependent upon
the
temperature and
fresuency of testing. At constant temperature, it is reduced slightly
as
the
fresuency increases; at constant frequency, it increases with temperature.
4.
DIELECTRIC
STRENGTE
The dielectric strength
of
an
insulation material can
be
defined as the limiting
voltage stress beyond which the dielectric
can
no
longer
maintain
its integrity.
The applied
stress
causes the insulation to fail; a discharge
occurs
which
causes
the insulation to
rupture.
Once
that
happens, it
can
no
longer serve its intended
role. Unfortunately, the dielectric
strength
is
not an absolute number; the value
obtained when dielectric
strength
is measured depends
on
many factors, not the
least of which
is
how the test is performed. Therefore, it
is
necessary to review
the issues involved,
so
that
the
value
and
the limitations of the term “dielectric
strength”
are
well understood.
The dielectric strength
is
usually expressed in
stress
per unit thickness volts per
mil,
or
kV
per
mm.
For
full
size
cable, it
is
common to merely
report
the
kV
at
which the cable
has
failed. Hence
if
a 175
mil
wall cable fails at
52.5
kV
(or
52,500
volts), the dielectric strength
can
also
be
expressed
as
300
V/mil.
The most
obvious
value
of
dielectric
strength
is
called the intrinsic strength.
This
is
defined by the characteristics
of
the material itself
in
its pure
and
defect-
free
state, measured under test conditions that produce breakdown at the highest
possible voltage stress.
In
practice,
this
is
never achieved experimentally. One
94
Copyright © 1999 by Marcel Dekker, Inc.
reason,
as
noted above,
is
the
diEculty
in
attaining
a defect-free pure insulation
specimen. The closest one
can
come is on measurement
of
very
thin,
carefully
prepared
films
with appropriate electrodes. (The
thinner
the
film,
the less
the
chance for a defd to exist.) Under these ideal conditions, the insulation itself
would fail due to its
inherent
properties (bond
strength
rupture).
It
is mom likely
is
that
hilure will
occur
uuder discharge conditions; hem
gas
(e.g., air) present
in
small voids
in
the
insulation,
present due to processing
characteristics,
will
undergo
decomposition.
Air
is
the most likely
gas
present
for polyethylene and crosslinked polyethylene (in
contrast
to
vapors
of
crosslinking by products). Its intrinsc dielectric
strength
is
significantly less
than
that of polyethylene. Under
these
conditions, the discharges that take place
in these
small
void@) leads to “erosion”
of
the insulation
surface
in
contact with
the
air.
This
in
turn
leads to gradual decomposition
of
the insulation and
eventual failure. The decomposition
of
the
air
in
the voids
occurs
at voltage
stresses
much lower
than
the
inherent
strength
of
the polyethylene itself, For
example, the dielectric
strength
of
a one
mil
thick
film
of polyethylene measured
under
identicaI conditions to
a
layer
of
air
(atmospheric
pressure),
gives
a
dielectric
strengtb
value
200
times
greater. Polyethylene give value of about
16,500 volts per
mil,
while
that of
air
is about
79.
The dielectric
strength
of
air
increases with pressure
(that
of
polyethylene does not change), and this concept
has
commercial
impact;
however the degree
of
improvement is small.
By
increasing the pressure by a factor
of
6,
the dielectric
strength
increases
by
a
factor of about
5
still
well below
that
ofthe polymer
film.
When
focusing
on
emded cable insulation,
we
are
now concerned
with
relatively thick sections;
175
to
425
mil
walls
for
distribution
cables,
and
even
thicker walls for transmission cables. Discharges that
OCCUT
in these
practical
systems
may
not lead to immediate failure. It is possible that
the
discharge will
cause
rupture
of a portion
of
the wall,
and
then
cease.
This
could
be
related to
the
energy
of the discharge, the size of the adjacent void,
and,
of
course,
the
nature
of
the insulation material.
When
this
occ~rs,
we
will develop
a
blackened
needle-shaped
series
of
defects,
sometimes resembling a
tree
limb; these
are
called
electrical
trees.
Discharges
may
occur
repetitively,
and
hence
the
tree
will
appear to
grow.
In
time the
“bee”
will bridge the
entire
insulation
wall
and
cause
failure.
Discharges
may
also occur on the surface of the insulation,
particularly
if
there is
poor
adhesion between the insulation and shield layers.
Another
mechanism of failure
is
known
as
thermal
breakdown.
This
occurs
when the
insulation
tempemure
starts
to
increase
as
a
result
of
aging
phenomena
under
operating
stress.
Under voltage
stress,
some insulation
systems
will
start
to generate heat, due to losses.
If
the rate
of
heating exceeds
the rate
of
cooling (that normally
occus
by
thermal tmsfer) then thermal
runaway
occurs,
and the insulation fails
by
essentially, thermally induced
95
Copyright © 1999 by Marcel Dekker, Inc.
degradation. Several points should be kept
in
mind here:
(1)
The heat transfer capability of polyolefins is low, and heat dissi-
pation is
not
normally rapid
(2)
These events may occur
in
the presence or absence
of
discharges
(3)
The presence
of
inorganic fillers contributes to increasing the
dielectric losses, and may exacerbate the situation.
Also,
some organic
additives in the insulation may also lead
to
increasing the dielectric
losses/ Finally, it should be noted that thermal breakdown
of
poylolephins is a very well-studied area.
Although
not
a
direct cause of failure, mention should be made of water treeing;
water trees lead to a reduction
in
dielectric strength, but are
not
a direct cause
of
failure. These trees have a different shape for electrical
trees,
and also have
different cause. The differences are outlined below.
WATER
TREES
ELECTRICAL
TREES
Water required Water not required
Fan
or bush shaped
Grow for years
Microvoids connected by tracks
Needle or spindle shaped
Failure shortly after formation
Carbonized regions
Water
trees
grow
under low (normal) operating stress, do not require the
presence
of
“small voids,” and lead
to
a reduction
in
dielectric strength.
Laboratory studies have shown that such trees can penetrate virtually the entire
insulation wall
yet
not lead immediately to failure.
As
the chart shows, the
“channels” or “tracks” that comprise water and electrical trees differ.
AC
breakdown strength
is
commonly performed on
fill
size cables
as
an
aid
in
characterization. For
full
size cables, it
is
common to
perform
many such tests
of
long
lengths
of
cables (e.g.,
25
to
30
feet) and plot the data on WeibulI or
Log
normal curves. This
is
done as the data always has some variation.
A
good
example
is
data developed
on
a project for the Electric Power Research Institute
(EPRI).
96
Copyright © 1999 by Marcel Dekker, Inc.
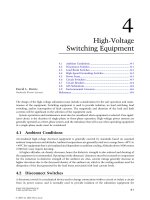
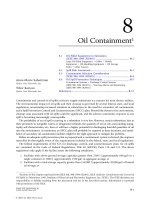
Figure
6-7
AC
Bmakdm
Strength
of
15
kV
XLPE
Insdated
Cabk
as
a
Function
of
Position
on
Reel
that Contained
5,000
Fat
of
Cabk
and
Total
ErCrosion
Run
wm
50,000
Feet
AC
Breakdown
in
volts
per
mil
1400
1200
1000
800
600
400
200
0
80
160
240
320
400
480
Position
on
Cable
Run
in
Feet
In
Figure
6-7,
it
is
Seen
that
the dielectric
sa~ngth
of
full
size
cabb
varies
hn
a
low
of
about
600
V/mil
to
a
maximum
of
about
1,300
Vlmil.
This
demonstrates
that
dthough
the
cable
was
manltEactured
in
presumably
the
we
ma~er
(this
cable
was
tested
from
the
same
ex&usion
nm
and
the
same
reel),
some
variation
is
inevitable.
This
is
appannt
from
the
ac
breakdown
strength
measurementandisthereasonthatsmtisticaievaluationofthedataobtainedis
a
necessity.
From
what
has
been
noted
above,
it
is
likely
that
these
Variations
are
due
to
inevitable
imperfections
that
result
during
process@
Figure
6-7
demonstrates
the
variation
in
measured
ac
brrakdown
saength
of
cmslinked
polyethylene
insulated
cable. Sample
lengths
tested
wtre
from
the same
production
rn
and
from
the
same
reel.
Variations
such
as
these
an
common
and
are
the
reaSOn
for
employing
statistical
analysis
of
data
such
as
Weibull
distribution
The
data
shown
fium
the
EPRI
project
was
obtained
at
a
five
minute
step
rise
time.
If
the
time
interval
between
the
steps
is
ind
(e.g.,
from
5
to
10
minutes),
the
apparent
ac
breakdown
strength
decreases.
If
the
time
intend
benveen
steps
is
increased
again
to
say
30
minutes
the
appeut
dielearic
97
Copyright © 1999 by Marcel Dekker, Inc.
strength
is
reduced even more.
In
other words, the apparent dielectric strength
that
one
obtains
in
performing
a test increases
as
the stress
is
applied more
rapidly.
[This
is
analogous to what happens during a tensile strength
test
for
polyethylene; the apparent tensile strength increases
as
the
stress
is applied more
rapidly]. Therefore, the meaning of
an
“ac
breakdown
strength”
value is
relevant
only
if
the manner
in
which the test
was
performed
is
known.
In
comparing ac
dielectric strength values for different insulation materials, the test should
always
be
performed
in
the same
manner.
This
holds true whether one is
comparing Werent grades of
the
same
material (Werent grades
of
polyethylene) or Werent insulation materials (polyethylene versus
polypropylene), for example.
The testing of
thin
films
or slabs
of
insulation materials
is
performed
in
the
laboratory and the opportunity
to
control the
local
environment during
testing
is
present.
This
should
be
done
and
should
be
reported. Since relatively small
specimens
are
involved (compared
to
fit11
size
cables), a large number
are
usually tested to overcome the inherent variability in results,
as
noted above.
When working with
small
samples, the opportunity
to
control the
local
environment
during
testing
is
greater,
and
reproducibility may
be
enhand.
Hence the following variables
are
to
be
controlled
so
that
the information
obtained represents a true representation of the
statistical
distribution
in
homogenieties for the material under study.
specimen thickness
0
temperature
0
electrode
shape
and size
The
reasons
for controlling the thickness have been noted.
This
is
especially
of
increasing
importance
as the thickness
is
reduced. Temperame
control
is vital,
as
the dielectric
strength
is
related
to
the temperature of the specimen at the time
breakdown
occurs.
Clearly, when working
with
small
samples, the
opportunity
to generate experimental
data
at controlled
uniform
temperatures [such as
by
testing in a controlled environment
room,
or
in
an
oven]
is
present.
The
electrode
shape
and size represents a
significant
parameter for small sample
testing.
The
most common electrodes
are
Rogowski
types,
where the electrode
is
med
and inserted into the polymer slab; this provides a
uniform
stress
gradient
and enhances the oppoxtunity for obtaining meaningfid information. If the
electrode-polymer interface is
sharp
(instead
of
rounded) the voltage
stress
will
be
enhanced
at
this
location.
The
failure
of
the
test specimen
will
be
induced at
this
location. Should that happen,
the
dielectric
strength
measured
will
be
related
more to the manner
in
which the test was
performed
(inducing a
high
localized
stress) rather
than
related to the properties of the insulation
itself.
98
Copyright © 1999 by Marcel Dekker, Inc.
Needle
tests
are
also
performed, where
a
sharp,
but controlled radius
of
curvature exists at the needle tip, and the latter
is
inserted
into
the specimen
part
way
to the ground plane, Voltage
stress
is
applied and the dielectric strength is
measured;
this
approach
has
been
used
to determine the influence
of
additives,
designed to
incmse
the breakdown
strength,
and
aid in developing superior
insulation materials.
A
detailed description of
typical
amngements of electrodes
that
may
be used
for dielectric
strength
testing
of
thin films
is
provided by
Mathes
in
the references.
The
fresuency
of measment
may
be
readily varied in
thin
film studies, much
more easily
than
for full
size
cables. While most testing is performed at
60
hertz,
testing
has
also
been
performed
at fresuencies ranging to
1,OOO
hertz.
Again,
the
rate of
rise
of the field
is
vitally importanz
and
can
readily be controlled.
The
reasons
br
controlling the thickness have
been
noted above.
This
is
especially critical when working with
thin
samples. Temperature
control
is
also
vital,
as
the dielectric
strength
is related
to
the temperature
of
the specimen at
the time breakdown
occurs.
Clearly, when working with
small
samples, the
opportunity
to generate experimental
data
at oontrolled,
dorm
temperatures
is
present. For instance, do the testing in a controlled environment
room
or oven.
The electrode
shape
and
size
represents
a significant parameter for
small
sample
testing.
The
most
common
electrodes
are
Rogowski
types
where the electrode is
curved and
inserted
into the polymer slab.
This
provides a
uniform
stress
gradient
and enhances the opportunity for obtaining meaningful
information.
If
the electrode-polymer interface is
sharp
(instead
of
rounded), the voltage
stress
will
be
enhanced
at this location. Failure of the test specimen
will
be
induced at
this
location. Should
that
happen,
the dielectric
strength
measured
will
be
related
more
to the
manner
in
which the test was performed (inducing
a
high
localized
stress)
rather
than
related to the properties
of
the insulation itself.
Needle tests
are
also performed where a
sharp,
generally controlled radius
of
curvature
exists at the needle tip.
This
needle
is
then
inserted into the
specimen
part
way to the
ground
plane. Voltage
stress
is applied
and
the dielectric
strength
is measured.
This
approach
has
been
used
to detennine the influence of
additives, designed to
increase
the
breakdown
strength,
and
an
aid
in
developing
superior
materials.
A
detailed description
of
typical anangements of electrodes
is
provided
by Mathes
in
the references. The frequency of measurement
may
be
readily varied
in
film
studies much more easily
than
for full size cables. While
most
testing is
performed
at
60
hertz, testing
has
also
been
performed at
frequencies ranging to
1,OOO
hertz.
Again, the rate of
rise
of
the field is vitally
important and
can
readily
be
controlled.
99
Copyright © 1999 by Marcel Dekker, Inc.
5.
SUMMARY
The chemical structure of the polymeric insulation determines the magnitude of
the dielectric constant and power factor. These
two
properties are significant at
operating stress and generally considered to be ‘‘low.’’ Polyolefins such as poly-
ethylene or crosslinked polyethylene have low dielectric constants and low pow-
er factors. Low levels of oxidation, generally resulting from processing the poly-
mer, lead to slight increases
in
these properties. Higher than normal operating
stresses are used to determine the dielectric strength of an insulating material.
The manner in which the test is designed and performed can influence the re-
sults. Statistical evaluation of the dielectric strength data is required. Failure
mechanisms are briefly reviewed and the differences between water and
elec-
trical trees are noted.
6.
REFERENCES
[6-11
L.
A.
Dissado and
J.
C.
Fothergill, “Electrical Degredation and Break-
down
in
Polymers,”
G.
C.
Stevens, Editor, Peter Peregrinus Ltd., 1992.
[6-21 Ken Mathes, “Electrical Insulating Materials.”
[6-31 M. L. Miller, “The Structure of Polymers,” Reinhold Book Corporation,
SPE Polymer Science and Engineering Series, Chapters
1,
2,
3,
10,
&
13,
1966.
100
Copyright © 1999 by Marcel Dekker, Inc.