impact of community tracer teams on treatment outcomes among tuberculosis patients in south africa
Bạn đang xem bản rút gọn của tài liệu. Xem và tải ngay bản đầy đủ của tài liệu tại đây (515.36 KB, 10 trang )
Bronner et al. BMC Public Health 2012, 12:621
/>
RESEARCH ARTICLE
Open Access
Impact of community tracer teams on
treatment outcomes among tuberculosis patients
in South Africa
Liza E Bronner1*, Laura J Podewils1, Annatjie Peters2, Pushpakanthi Somnath3, Lorna Nshuti3,
Martie van der Walt3 and Lerole David Mametja4
Abstract
Background: Tuberculosis (TB) indicators in South Africa currently remain well below global targets. In 2008, the
National Tuberculosis Program (NTP) implemented a community mobilization program in all nine provinces to trace
TB patients that had missed a treatment or clinic visit. Implementation sites were selected by TB program managers
and teams liaised with health facilities to identify patients for tracing activities. The objective of this analysis was to
assess the impact of the TB Tracer Project on treatment outcomes among TB patients.
Methods: The study population included all smear positive TB patients registered in the Electronic TB Registry from
Quarter 1 2007-Quarter 1 2009 in South Africa. Subdistricts were used as the unit of analysis, with each designated
as either tracer (standard TB program plus tracer project) or non-tracer (standard TB program only). Mixed linear
regression models were utilized to calculate the percent quarterly change in treatment outcomes and to compare
changes in treatment outcomes from Quarter 1 2007 to Quarter 1 2009 between tracer and non-tracer subdistricts.
Results: For all provinces combined, the percent quarterly change decreased significantly for default treatment
outcomes among tracer subdistricts (−0.031%; p < 0.001) and increased significantly for successful treatment
outcomes among tracer subdistricts (0.003%; p = 0.03). A significant decrease in the proportion of patient default
was observed for all provinces combined over the time period comparing tracer and non-tracer subdistricts
(p = 0.02). Examination in stratified models revealed the results were not consistent across all provinces; significant
differences were observed between tracer and non-tracer subdistricts over time in five of nine provinces for
treatment default.
Conclusions: Community mobilization of teams to trace TB patients that missed a clinic appointment or treatment
dose may be an effective strategy to mitigate default rates and improve treatment outcomes. Additional
information is necessary to identify best practices and elucidate discrepancies across provinces; these findings will
help guide the NTP in optimizing the adoption of tracing activities for TB control.
Keywords: Default, Community mobilization, Treatment adherence, Outreach
* Correspondence:
1
Division of TB Elimination, Centers for Disease Control and Prevention, 1600
Clifton Road NE Mailstop E-10, Atlanta, GA 3033, USA
Full list of author information is available at the end of the article
© 2012 Bronner et al.; licensee BioMed Central Ltd. This is an Open Access article distributed under the terms of the Creative
Commons Attribution License ( which permits unrestricted use, distribution, and
reproduction in any medium, provided the original work is properly cited.
Bronner et al. BMC Public Health 2012, 12:621
/>
Page 2 of 10
Background
Tuberculosis (TB) is a leading cause of morbidity and
mortality worldwide, infecting an estimated 9.4 million
persons and causing death in 1.7 million persons annually [1]. The World Health Organization (WHO) ranks
South Africa as having the third highest TB incidence
rate among the top 22 high-burden TB countries, with
an estimated 405,982 persons diagnosed with TB each
year (incidence rate 971/100,000) [1].
Patient default from treatment is one of the most important problems in TB control [2,3]. In 1996, the South
Africa National Tuberculosis Program (NTP) adopted
the Directly Observed Treatment Short-Course (DOTS)
strategy nationwide for the treatment of TB patients.
While the NTP has implemented several strategies over
the past decade to improve access to treatment and support treatment compliance among TB patients, at 76%
the treatment success rate remains well below WHO targets of 85% cured or completing treatment necessary to
mitigate the spread of TB [1,4-6].
Default from TB treatment poses a serious health risk to
TB-infected individuals and to the community. The number of TB patients who default from TB treatment in
South Africa, defined as missing at least 2 consecutive
months of treatment [6], remains high ranging from 5.9 –
14.7% [1,4]. TB treatment defaulters, especially those who
are smear positive, propagate ongoing community transmission and promote the development and acquisition of
drug-resistant TB strains resulting in a higher number of
TB cases [3,7,8]. Previous studies have shown that over
one-third of patients who default from treatment are
culture-positive for TB and therefore infectious at the time
of default [3,7]. Additionally, research in India found that
patients who defaulted from treatment had a standardized
mortality ratio of 14.3 versus 2.0 in patients who completed treatment [9].
Research has shown that TB patient tracing activities
are an effective method to significantly reduce TB treatment default [8,10,11]. However, there is little research
documenting the effect of tracing on TB treatment outcomes [11]. In 2008, the South Africa NTP initiated a
national project (hereafter referred to as the TB Tracer
Project) aiming to decrease default rates and improve
patient outcomes through community mobilization. The
aim of this study is to evaluate the impact of the TB
Tracer Project on TB treatment outcomes in South
Africa.
Methods
TB Tracer Project design
The TB Tracer Project was implemented from January
2008 to May 2009 in all nine provinces of South Africa.
Two to four districts in each province deemed as high
priority by the South African NTP with the highest rates
of TB treatment default in 2006 were selected for inclusion [12]. Each district then selected four to six
9 Provinces
30 Districts not
selected for
inclusion
21 High Priority
Districts selected for
inclusion
147 Non Tracer
Subdistricts
63 Tracer
Subdistricts
224,390
TB patients with
treatment outcomes
181,283
TB patients with
treatment outcomes
72 Tracer Teams
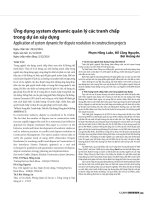
Figure 1 Overview of the TB Tracer Project implementation and study population of TB patients registered in the ETR included for
analysis (n = 405,673). The South African National TB Program selected 2 to 4 districts from each of the 9 provinces of South Africa for inclusion
in the TB Tracer Project. The selected districts were those with the highest rates of treatment default in 2006. The districts then selected four to
six subdistricts to carry out the project with at least one tracer team assigned to each selected subdistrict.
Bronner et al. BMC Public Health 2012, 12:621
/>
Page 3 of 10
Table 1 Characteristics of TB patients in the Electronic TB Registry for Tracer and Non-Tracer subdistricts, Quarter 1
2007-Quarter 1 2009, South Africa
Characteristic
All Patients
Tracer
Non-Tracer
(n = 405, 673)
(n = 181,283)
(n = 224,390)
n
%
n
%
n
%
Case type
New
303846
74.9
141166
77.9
162680
72.5
Retreatment
101827
25.1
40117
22.1
61710
27.5
Eastern Cape
72371
17.8
37840
20.9
34531
15.4
Free State
26920
6.6
9457
5.2
17463
7.8
Gauteng
58036
14.3
32769
18.1
25267
11.3
Kwazulu-Natal
85634
21.1
46517
25.7
39117
17.4
Limpopo
19281
4.8
7126
3.9
12155
5.4
Mpumalanga
26623
6.6
16083
8.9
10540
4.7
Northern Cape
12541
3.1
5636
3.1
6905
3.1
Northwest
30393
7.5
15436
8.5
14957
6.7
Western Cape
73874
18.2
10419
5.7
63455
28.3
Province Totals^
Treatment Outcomes*,{^
Defaulted
Cured
Completed
38783
9.6
20538
11.3
18245
8.1
260219
64.1
108439
59.8
151780
67.6
40276
9.9
20579
11.4
19697
8.8
Failed
8885
2.2
4199
2.3
4686
2.1
Died
34355
8.5
16330
9.0
18025
8.0
2033
0.5
581
0.3
1452
0.6
21122
5.2
10617
5.9
10505
4.7
MDR-TB
Transferred
†The Electronic TB Registry (ETR) is the national TB surveillance database used in South Africa.
*Treatment success was defined as having a registered treatment outcome of either ‘Cured’ or ‘Completed’ in the ETR (n = 300,495; Tracer n = 129,018; Non-Tracer
n = 171,477).
{Patients registered in the National ETR database with missing treatment outcome data (n = 18,275; Tracer n = 10,292; Non-Tracer n = 7,983) were considered as
missing and were excluded from this analysis.
^Percentages total to greater than 100% due to rounding of percentage values.
subdistricts to carry out the project. Each subdistrict was
assigned at least one dedicated TB tracer team comprised of one registered nurse, two community health
care workers, and one data capturer. Teams of health
care workers were employed at health facilities (i.e. hospitals, clinics, and community health centers) to trace
TB patients who had interrupted treatment or had
missed a clinic appointment to obtain a sputum sample
Table 2 Percent quarterly change in proportion of TB treatment outcomes, Tracer vs. Non-Tracer subdistricts,
Q1 2007-Q1 2009, South Africa
Tracer
Percent quarterly change, %†
Non-Tracer
95% CI
P-value
Percent quarterly change, %†
(−0.048, -0.014)
95% CI
P-value
Default
−0.031
<0.001
−0.002
(−0.019, 0.016)
0.85
Success*
0.003
(0.001, 0.006)
0.03
0.002
(−0.001, 0.004)
0.16
0.007
(0.002, 0.012)
<0.01
0.010
(0.005, 0.014)
<0.001
(−0.047, -0.011)
<0.01
−0.059
(−0.076, -0.041)
<0.001
Cure
Completed
−0.029
Failed
0.012
(−0.014, 0.037)
0.36
−0.030
(−0.054, -0.006)
0.01
Died
0.002
(−0.012, 0.016)
0.79
−0.006
(−0.019, 0.007)
0.34
†Calculations of percent quarterly change included all smear positive TB patients registered with treatment outcome data in the ETR.
*Treatment success was defined as having a registered treatment outcome of either ‘Cured’ or ‘Completed’ in the ETR and was calculated by combining ‘Cured’
and ‘Completed’ treatment outcomes.
Bronner et al. BMC Public Health 2012, 12:621
/>
20
Figure 2 Proportion of all smear positive TB patients with final
treatment outcomes for all provinces, tracer vs. non-tracer
subdistricts, Quarter 1 2007-Quarter 1 2009, South Africa. A
significant difference was detected in tracer subdistricts (solid line)
compared to non-tracer subdistricts (dashed line) in the proportion
of treatment outcomes for patient default, completion, and failure
among all smear positive TB patients with treatment outcomes
recorded in the ETR. The p-value reported for each graph represents
the significance of the tracer status by time interaction term to
assess the change in linear trend of each treatment outcome
comparing tracer versus non-tracer subdistricts over time. The y-axis
of each graph in Figure 2 varies according to the baseline treatment
outcome recorded for Q1 2007. The y-axes were not standardized
on a 0-100% scale to allow for better visualization of the percent
change in each treatment outcome from baseline to the end of the
evaluation period in Q1 2009.
Default treatment outcome, p=0.02
% Defaulted
16
12
8
4
0
84
Successful treatment outcome, p=0.49
79
% Successful
Page 4 of 10
74
69
64
59
54
84
to evaluate their smear status for TB. Since the project
was implemented as a programmatic intervention, tracer
team activities, mechanisms of tracing, modes of transportation, and health facility placement varied by subdistrict. Over the course of the project there were 21
districts selected for inclusion with 63 tracer subdistricts
with 72 project-designated tracer teams that participated
during the project period and 147 non-tracer subdistricts; there were 30 districts that were not selected for
inclusion in the project (Figure 1).
Cured treatment outcome, p=0.43
% Cured
79
74
69
64
59
54
20
Completed treatment outcome , p=0.02
% Completed
16
12
Study design
8
This retrospective study was conducted using routinely
collected data from the South African national database
for TB surveillance, the Electronic TB Registry (ETR).
Aggregate TB patient data is recorded quarterly in the
ETR at the subdistrict level; therefore, the subdistrict
level was used as the unit of analysis and time was measured quarterly in this study. The study population
included all smear positive TB patients registered with
final treatment outcomes recorded in the National ETR
from Quarter 1 2007 through Quarter 1 2009 (Q1 to Q4
2007, Q1 to Q4 2008, and Q1 2009) across the nine provinces of South Africa.
4
0
6
Failed treatment outcome, p=0.02
% Failed
5
4
3
2
1
0
20
Died treatment outcome, p=0.40
% Died
16
Definitions and outcomes
12
8
4
0
Time (Quarterly)
Tracer
Non-Tracer
ETR data from Q1 through Q4 2007 was included in the
analysis to provide information on treatment outcomes
prior to the implementation of the TB Tracer Project
(Q1 2008 through Q1 2009) and to allow for the analysis
of the change in trend of TB treatment outcomes over
time. Tracer subdistricts were considered as those where
at least one health facility included TB team tracing activities in addition to standard NTP patient services,
whereas non-tracer subdistricts provided only standard
NTP patient services.
The proportion of patients with treatment outcomes
registered in the National ETR as cured, completed,
Bronner et al. BMC Public Health 2012, 12:621
/>
Page 5 of 10
Table 3 Percent quarterly change in proportion of default TB treatment outcomes stratified by province, Tracer vs.
Non-Tracer subdistricts, Q1 2007-Q1 2009, South Africa
Province
Tracer
Quarterly change in default,%†
Non-Tracer
95% CI
P-value
Quarterly change in default,%†
95% CI
P-value
−0.009
(−0.025, 0.008)
0.29
0.030
(0.007, 0.053)
0.01
Free State
0.008
(−0.031, 0.048)
0.65
−0.026
(−0.060, 0.008)
0.12
Gauteng
−0.005
(−0.026, 0.015)
0.57
−0.020
(−0.049, 0.009)
0.17
Kwazulu-Natal
−0.032
(−0.053, -0.009)
<0.01
−0.027
(−0.053, -0.002)
0.04
Limpopo
−0.003
(−0.043, 0.036)
0.86
0.059
(0.015, 0.102)
0.01
Eastern Cape
Mpumalanga
−0.060
(−0.096, -0.024)
<0.01
0.009
(−0.027, 0.046)
0.60
Northern Cape
−0.191
(−0.270, -0.112)
<0.001
−0.025
(−0.099, 0.049)
0.48
Northwest
−0.055
(−0.079, -0.031)
<0.001
0.017
(−0.011, 0.045)
0.22
0.002
(−0.041, 0.046)
0.91
−0.023
(−0.039, -0.007)
<0.01
Western Cape
†Calculations of percent quarterly change included all smear positive TB patients registered with treatment outcome data in the ETR.
defaulted, failed, and died were each evaluated separately
as the primary impact indicators for comparing patients
from tracer and non-tracer subdistricts. Completion and
cure treatment outcomes were combined to define a
successful treatment outcome as an additional primary
impact indicator for comparison with all other treatment
outcomes (default, failed, and died). Patients registered
in the National ETR with missing treatment outcome
data were excluded from this analysis.
Statistical analysis
Descriptive statistics were used to summarize characteristics of the population of TB patients registered in the
ETR for the time period evaluated (Q1 2007 through Q1
2009). Longitudinal analysis was utilized to evaluate
changes in each TB treatment outcome between tracer
and non-tracer subdistricts over time (using PROC
GLIMMIX in SAS). Each outcome of interest (default,
success, cured, completed, failed, and died) was evaluated separately, using the log of the proportion of each
outcome at each time point. Proportions were calculated
by using the counts of patients recorded in the ETR with
a given outcome as the numerator divided by the total
number of patients in the ETR with a final treatment
outcome recorded. The percent quarterly change over
time for each TB treatment outcome was computed for
each the tracer and non-tracer subdistricts for all smear
positive cases and for all smear positive cases in each
province.
Mixed linear regression models were used with a random intercept that specified the province variable as a
random cluster effect to account for spatial correlation
of TB treatment outcomes within provinces of South Africa. The tracer indicator (tracer vs. non-tracer subdistricts) and time variable (continuous variable measured
quarterly) were held as fixed effects in the model and
the tracer*time interaction term was included to assess
the effect of the tracer teams over time. Province stratified analyses were conducted for the two primary outcomes of interest, default and treatment success, using
the same model parameters with the exception of province clusters. The p-value for significance of the tracer
status by time interaction term is reported to assess
change in the linear trend of each treatment outcome
comparing tracer versus non-tracer subdistricts over
time. Statistical significance was considered at a pvalue<0.05. All analyses were conducted using SAS version 9.3 (SAS Institute Inc., Cary, NC, USA).
Ethical considerations
This evaluation was approved by the Institutional Review Boards of the U.S. and South African Centers for
Disease Control and Prevention and the South African
Medical Research Council. Information was derived
from existing electronic data systems that are part of
routine monitoring and evaluation of the NTP. No
patients were contacted as part of this analysis, and the
data abstraction did not involve individual patient charts
or information.
Results
Study population characteristics
From Q1 2007 to Q1 2009, there were 405,673 smear
positive TB patients registered in the National ETR with
treatment outcomes recorded (18,275 TB patients missing treatment outcome data were excluded from this
analysis). Of these patients, 45% (181,283) received TB
health services in subdistricts where TB tracer teams
were operating (Table 1). New patients accounted for
75% (303,846) of TB patients in the ETR database during
the project period. The greatest proportion of TB
patients were from Kwazulu-Natal (85,634; 21%), Eastern
Cape (72,371; 18%), and Western Cape (73,874; 18%)
Bronner et al. BMC Public Health 2012, 12:621
/>
% Default
20
Figure 3 Proportion of all smear positive TB patients with
default TB treatment outcomes stratified by province, tracer vs.
non-tracer subdistricts, Q1 2007-Q1 2009, South Africa. A
significant difference was detected in the proportion of treatment
default in 5/9 provinces in South Africa in tracer subdistricts (solid
line) compared to non-tracer subdistricts (dashed line). The p-value
reported for each graph represents the significance of the tracer
status by time interaction term to assess the change in linear trend
of each treatment outcome comparing tracer versus non-tracer
subdistricts over time. The y-axis representations for percentages of
treatment default were not standardized on a 0-100% scale to allow
for better visualization of the percent change from Q1 2007 to the
end of the evaluation period in Q1 2009.
Eastern Cape, p=0.01
16
12
8
4
0
20
Free State, p=0.17
% Default
16
12
8
4
0
% Default
20
Gauteng, p=0.40
16
12
KwaZulu-Natal, p=0.79
Provinces. Among the 405,673 TB patients analyzed,
64% (260,219)had a final treatment outcome of cured,
yet 10% (38,783) defaulted from TB treatment. When
comparing patients from tracer subdistricts to those
from non-tracer subdistricts, 60% (108,439) versus 68%
(151,780) patients were cured; whereas, 11% (20,538)
versus 8% (18,245) patients defaulted, respectively.
Limpopo, p=0.04
Percent quarterly change for all treatment outcomes: all
smear positive TB patients
8
4
0
20
16
% Default
Page 6 of 10
12
8
4
0
% Default
20
16
For all smear positive TB patients, a significant decrease
in the percent quarterly change in default treatment outcomes of −0.031% was observed in tracer subdistricts
(p < 0.001) compared to a decrease of only −0.002% in
non-tracer subdistricts (p = 0.85) (Table 2). Additionally,
a significant increase in the percent quarterly change in
successfully treatment outcomes was observed in tracer
subdistricts (tracer = 0.003%, p = 0.03; non-tracer =
0.002%, p = 0.16). The percent quarterly change in cured
treatment outcomes increased significantly in the tracer
and non-tracer subdistricts (tracer = 0.007%, p < 0.01;
non-tracer = 0.010%, p < 0.001); by contrast, there was a
significant decrease in completion treatment outcomes
in both groups (tracer = −0.029%, p < 0.01; non-tracer =
−0.059%, p < 0.001).
12
8
4
0
20
Mpumalanga, p=0.01
% Default
16
12
8
4
0
20
Northern Cape, p<0.01
% Default
16
12
8
4
0
% Default
20
Northwest, p<0.001
16
12
Analysis of trends in treatment outcomes: all smear
positive TB patients
8
4
0
20
Western Cape, p=0.26
% Default
16
12
8
4
0
Time (Quarterly)
Tracer
Non-Tracer
When comparing the change in proportions of treatment outcomes in tracer versus non-tracer subdistricts
from Q1 2007 to Q1 2009, significant changes over
time were detected in the proportions of defaulted,
completed, and failed treatment outcomes (Figure 2).
The proportion of patients who defaulted from treatment in subdistricts with tracer teams declined from
13.1% in Q1 2007 to 10.2% in Q1 2009, a decrease
that was significantly greater than observed in nontracer subdistricts from 8.4% to 7.7% (p-value for
tracer indicator by time interaction, p = 0.02). The proportion of TB patients with a successful treatment outcome increased in the tracer subdistricts (70.5% to
Bronner et al. BMC Public Health 2012, 12:621
/>
Page 7 of 10
Table 4 Percent quarterly change in proportion of successful TB treatment outcomes stratified by province, Tracer vs.
Non-Tracer subdistricts, Q1 2007-Q1 2009, South Africa
Province
Tracer
Quarterly change in success, %†
Non-Tracer
95% CI
P-value
Quarterly change in success, %†
95% CI
P-value
0.003
(−0.003, 0.009)
0.29
−0.005
(−0.011, 0.001)
Free State
−0.006
(−0.016, 0.005)
0.25
0.003
(−0.006, 0.011)
0.51
Gauteng
0.003
(−0.002, 0.009)
0.23
0.009
(0.003, 0.015)
<0.01
Eastern Cape
0.08
−0.001
(−0.006, 0.005)
0.75
0.001
(−0.004, 0.007)
0.61
Limpopo
0.011
(−0.002, 0.024)
0.10
−0.001
(−0.010, 0.009)
0.86
Mpumalanga
0.015
(0.004, 0.025)
0.01
0.002
(−0.008, 0.012)
0.68
Northern Cape
0.016
(0.002, 0.029)
0.03
0.002
(−0.011, 0.015)
0.72
0.007
(−0.002, 0.016)
0.11
−0.004
(−0.013, 0.005)
0.40
−0.002
(−0.015, 0.011)
0.78
0.003
(−0.002, 0.008)
0.21
Kwazulu-Natal
Northwest
Western Cape
†Calculations of percent quarterly change included all smear positive TB patients registered with treatment outcome data in the ETR.
73.1%) compared to the non-tracer subdistricts (76.4%
to 77.2%), but this change was not significant over
time (interaction p = 0.49). Meanwhile, the proportion
of treatment completion decreased significantly from
12.7% to 9.4% in tracer subdistricts versus 10.1% to
6.9% in non-tracer subdistricts (interaction p = 0.02).
Further, a small but significant increase in the proportion of treatment failure was observed in the tracer
subdistricts (2.1% to 2.2%) versus non-tracer subdistricts (2.4% to 2.2%) (interaction p = 0.02).
Analysis of treatment default: all smear positive TB
patients stratified by province
Province stratified models for default treatment outcomes among all TB cases demonstrated inconsistent
results across the nine provinces. The tracer subdistricts
in four of nine provinces displayed a significant decrease
in the percent quarterly change in patient default; the
non-tracer subdistricts in three different provinces and
in one of the same provinces (KwaZulu-Natal) also
revealed a significant decline (Table 3). However, the
interaction of the tracer teams over time demonstrated a
significant decrease in the proportion of patient defaultin five provinces for tracer versus non-tracer subdistricts (Figure 3). The proportion of patient default
among tracer subdistricts decreased significantly in Eastern Cape (10% to 9%), Limpopo (14.5% to 12.1%), Mpumalanga (10% to 5%), Northern Cape (13% to 4%), and
Northwest (17% to 10%) Provinces. Conversely, the nontracer subdistricts from the same provinces showed an
increase in the proportion of default treatment outcomes
during the analysis time period.
Analysis of treatment success: all smear positive TB
patients stratified by province
The stratified analysis exposed similar discrepancies in
the results of the tracer teams on successful treatment
outcomes. A significant increase in the percent quarterly
change of successful treatment outcomes occurred in
two of nine provinces for tracer subdistricts and in one
province for non-tracer subdistricts (Table 4). When
examining the change in treatment success over time in
tracer versus non-tracer subdistricts, only Eastern Cape
Province displayed results that approached significance
(interaction p = 0.05) (Figure 4). Nonetheless, the proportion of treatment successincreased from Q1 2007 to
Q1 2009 among tracer subdistricts in Eastern Cape (73%
to 75%), Gauteng (76% to 79%), Limpopo (59% to 67%),
Mpumalanga (70% to 81%), Northern Cape (77% to
86%), and Northwest (68% to 73%) Provinces. Additionally, among the non-tracer subdistrictsin Eastern Cape,
the success rate declined from 83% to 80% and in
Northwest Province from 78% to 74%. Meanwhile, Free
State Province demonstrated a decrease in treatment
success among the tracer subdistricts while treatment
success increased in non-tracer subdistricts (interaction
p = 0.19). Kwazulu-Natal Province displayed a similar decrease in treatment success in both the tracer and nontracer subdistricts.
Discussion
This analysis documents the impact of a national program to trace TB patients who interrupted treatment or
missed a clinic visit in South Africa. The overall percent
quarterly change for all smear positive TB patients in
South Africa from Q1 2007 through the end of the TB
Tracer Project in Q1 2009 showed a significant decrease
in default treatment outcomes and a significant increase
in successful treatment outcomes among tracer subdistricts. Changes over time were significantly different between tracer and non-tracer subdistricts for treatment
outcomes of default, completed, and failed. Specifically,
the decreasing trend in the proportion of patients who
defaulted over time was significantly greater among
Bronner et al. BMC Public Health 2012, 12:621
/>
% Success
88
Page 8 of 10
Figure 4 Proportion of all smear positive TB patients with
successful TB treatment outcomes stratified by province, tracer
vs. non-tracer subdistricts, Q1 2007-Q1 2009, South Africa. A
significant difference was detected in the proportion of treatment
success in 1/9 provinces in South Africa in tracer subdistricts (solid
line) compared to non-tracer subdistricts (dashed line). The p-value
reported for each graph represents the significance of the tracer
status by time interaction term to assess the change in linear trend
of each treatment outcome comparing tracer versus non-tracer
subdistricts over time. The y-axis representations for percentages of
treatment success were not standardized on a 0-100% scale to allow
for better visualization of the percent change from Q1 2007 to the
end of the evaluation period in Q1 2009.
Eastern Cape, p=0.05
83
78
73
68
63
58
% Success
88
Free State, p=0.19
83
78
73
68
63
58
% Success
88
Gauteng, p=0.17
83
78
73
68
63
58
Q1 2007
% Success
88
Q3 2007
Q1 2008
Q3 2008
Q1 2009
KwaZulu-Natal, p=0.56
83
78
73
68
63
58
% Success
88
Limpopo, p=0.15
83
78
73
68
63
58
% Success
88
Mpumalanga, p=0.08
83
78
73
68
63
58
% Success
88
Northern Cape, p=0.15
83
78
73
68
63
58
% Success
88
Northwest, p=0.09
83
78
73
68
63
58
% Success
88
Western Cape, p=0.47
83
78
73
68
63
58
Time (Quarterly)
Tracer
Non-Tracer
tracer subdistricts than non-tracer subdistricts. The proportion of patients who completed treatment also had a
declining trend over the time period for each the tracer
and non-tracer subdistricts; however, the slope was
significantly less among the tracer subdistricts than the
non-tracer subdistricts. These findings demonstrate a
significant temporal association between TB tracer
teams and TB treatment outcomes.
Our findings are supported by a study conducted in
Kenya at clinics operated by Médeicins Sans Frontières
(MSF) which demonstrated that the implementation of
an active defaulter tracing system for HIV, prevention of
mother-to-child transmission, and TB patients resulted
in a decrease in TB patients lost to follow up [11]. Furthermore, the MSF tracing system documented a high
resumption of appointments by patients and was able to
establish a treatment outcome for almost 85% of patients
who missed an appointment [11].
In our study, we found that the impact of the TB
Tracer Project varied by province. The inconsistency in
the results observed between the provinces could be attributable to a variety of factors not assessed in this analysis: differential patient and tracer subdistrict sample
sizes between provinces, variability in reporting and
recording of TB treatment outcomes, as well as differences in TB burden, HIV prevalence, infrastructure,
socioeconomic structure and geography. Previous research has cited the relationship between the health provider and patient and the pattern of health care delivery
to be significantly associated with patient default [3,7,1318]. The differences in results between provinces may
also be due to geographic migration patterns; a study of
multidrug resistant TB in South Africa found that being
born outside of South Africa and changing residence
during treatment were both significantly associated with
default from treatment [15]. Additionally, variations in
staffing and in the number of tracer teams operating per
health facility and per subdistrict may have affected the
efficacy of the TB Tracer Project. While this analysis did
not assess these qualitative issues, a parallel study is
underway to determine whether the differences in impact of the TB tracer teams may be attributable to some
of these factors.
The present study was unique as few other treatment
default and adherence studies have been able to assess
Bronner et al. BMC Public Health 2012, 12:621
/>
the issue both nationally and within specific country
regions. However, this study is not without limitations.
This was an ecological study using a non-randomized
selection of tracer and non-tracer subdistricts where in
inclusion in the project was based upon one of the outcomes of interest, thereby allowing for differences in
case load and for possible bias in our results. The evaluation of the TB Tracer Project was requested and conducted after the completion of the project design and
implementation. Many data elements necessary for an
epidemiologic evaluation of the impact of this intervention were not available for analysis, including patient
level information, details of tracer teams’ duties and
actions, and tracer team coverage of subdistricts and/or
health facilities. However, by using national programmatic data from the ETR we were able to account for
baseline trajectories in modeling with national standardized surveillance data. The subdistrict was utilized as
the unit of analysis for this study because it was not possible to reliably account for and categorize the tracer status for all individual health facilities. However, the level
of misclassification is likely similar in both groups and
therefore would not introduce a systematic bias in the
data aggregated at the subdistrict level. This nondirectional misclassification would have biased toward a
null result of finding no difference in the outcome between tracer and non-tracer sites. Nonetheless, the differences in the proportions of TB treatment outcomes
between tracer and non-tracer subdistricts both prior to
and during the TB Tracer Project were inherent in the
study design [12]. However, by modeling the proportion
of TB treatment outcomes rather than patient counts
with a large national sample, we aimed to minimize the
effect of this selection bias.
This analysis was restricted to smear positive TB
patients registered in the ETR with a treatment outcome
recorded and therefore the results may not be representative of all TB patients who defaulted from treatment.
However, we were able to capture the majority of patients
in the ETR cohorts from Q1 2007 to Q1 2009. The aggregate ETR data available for this analysis limited our ability
to produce a quantifiable point estimate to evaluate the effect of the tracer teams on TB treatment outcomes. Yet
the data allowed us to examine the impact of the tracer
teams over more than a two year period for the entire
country of South Africa. Furthermore, the ability to perform a province stratified analysis to assess the effect of
the intervention within each South African province
allows for a deeper understanding of the underlying processes at work within the NTP in South Africa and allows
for greater programmatic improvements.
The programmatic implications of patient tracing extend beyond the focus of this study. The improvements
achieved in patient default observed during the TB
Page 9 of 10
Tracer Project were statistically significant; however, the
current study did not observe a significant difference between tracer and non-tracer subdistricts for overall treatment success. It is likely that other programmatic
interventions (i.e., DOTS, effective medication, adequate
healthcare staffing, etc.) are necessary to extend beyond
decreasing treatment default and to achieve an increase
in treatment success. A multi-pronged approach is essential to reach global TB treatment targets, one component of which may be tracing patients to improve
adherence in addition to other TB control strategies.
While this study focused on default in smear positive TB
patients, we did not have information regarding the HIV
status of the patients counted in the ETR nor did we
have data for smear negative TB patients. Research has
found that patients undergoing HIV and TB treatment
are more likely to interrupt treatment and the implications of TB treatment default for an HIV positive patient
are of particular concern in a high-burden HIV setting
[3,15]. We chose not to focus on MDR TB patients in
this study; however, the repercussions of treatment default for MDR TB patients must be considered when
evaluating the importance of a TB tracing program [15].
Conclusion
In conclusion, this study provides important data on the
efficacy of using patient tracers to improve TB outcomes
in South Africa. Our results demonstrate that community mobilization of teams designated to trace TB
patients may be an effective strategy to mitigate TB default rates and improve TB treatment outcomes. A parallel study by Bristow et al. is underway to assess
knowledge, attitudes, challenges, and best practices
regarding TB tracing activities and to elucidate discrepancies across provinces in South Africa. These results
will shape future research to implement a full scale TB
tracing program with ongoing monitoring and evaluation. With the synergy of the TB, MDR TB, and HIV
epidemics in South Africa, the need to increase treatment success and to decrease default is paramount.
Competing interest
The authors have no competing interests to report. The findings and
conclusions in this report are those of the authors and do not necessarily
represent the official position of the Centers for Disease Control and
Prevention.
Author’s contribution
LEB, LJP, AP, PS, LN, MVW, and LDM contributed to the study design. LEB
and LJP designed the overall statistical analysis plan, analyzed the data, and
take responsibility for the accuracy of the data analysis. LEB drafted the
manuscript with assistance and input by LJP. LEB, LJP, AP, PS, LN, MVW, and
LDM reviewed the findings for the interpretation of the data and the
manuscript for intellectual content as well as critical review and editing. All
authors read and approved the final manuscript.
Bronner et al. BMC Public Health 2012, 12:621
/>
Acknowledgements
We would like to thank the national, provincial and local Departments of
Health for their approval and assistance in allowing us to conduct this study.
We would like to acknowledge all members of the tracer teams and clinical
staff at the tracer health facilities for all of their dedication and tireless efforts
without which this project could not have been achieved. We would also
like to thank the supportive staff at the South African Medical Research
Council. We would also like to thank Nong Shang and Carla Winston from
the U.S. Centers for Disease Control and Prevention and Katherine Mues
from Emory University Rollins School of Public Health for their statistical
review and consultation.
Evaluation of the project was made possible through the support of the
Centers for Disease Control and Prevention South Africa Global AIDS
Program, and through funding and collaboration with the South African
Medical Research Council (Cooperative Agreement 5 U51 PS000729-05, PA
PS07-006). We would also like to thank the European Union for financing the
planning, implementation and monitoring of the Tracer Project.
Author details
1
Division of TB Elimination, Centers for Disease Control and Prevention, 1600
Clifton Road NE Mailstop E-10, Atlanta, GA 3033, USA. 2Global AIDS Program,
Centers for Disease Control and Prevention, 877 Pretorius Street, Arcadia
0007, South Africa. 3TB Epidemiology and Intervention Research Unit, South
African Medical Research Council, 1 Soutpansberg Road, Private Bag X385,
Pretoria 0001, South Africa. 4Tuberculosis Control and Management, Republic
of South Africa National Department of Health, Private Bag X828, Pretoria
0001, South Africa.
Page 10 of 10
12. Republic of South Africa National Department of Health: Report on TB
Treatment Default in South Africa. Pretoria: National Department of Health of
the Republic of South Africa; 2006.
13. Cox HS, Morrow M, Deutschmann PW: Long term efficacy of DOTS regimens
for tuberculosis systematic review. In.: BMJ; 2008.
14. Demissie M, Getahun H, Lindtjorn B: Community tuberculosis care
through “TB clubs” in rural North Ethiopia. Soc Sci Med 2003, 56
(2003):2009–2018.
15. Holtz TH, Lancaster J, Laserson KF, Wells CD, Thorpe L, Weyer K: Risk factors
associated with default from multidrug-resistant tuberculosis treatment,
South Africa, 1999–2001. Int J Tuberc Lung Dis 2006, 10(6):649–655.
16. Liefooghe R, Suetens C, Meulemans H, Moran M-B, Muynck AD: A
randomised trial of the impact of counselling on treatment adherence
of tuberculosis patients in Sialkot, Pakistan. Int J Tuberc Lung Dis 1999,
3(12):1073–1080.
17. Santha T, Garg R, Frieden TR, Chandrasekaran V, Subramani R, Gopi PG,
Selvakumar N, Ganapathy S, Charles N, Rajamma J, et al: Risk factors
associated with default, failure and death among tuberculosis patients
treated in a DOTS programme in Tiruvallur District, South India, 2000. Int
J Tuberc Lung Dis 2002, 6(9):780–788.
18. Zwarenstein M, Schoeman JH, Vundule C, Lombard CJ, Tatley M:
Randomised controlled trial of self-supervised and directly observed
treatment of tuberculosis. Lancet 2001, 352(9137):1340–1343.
doi:10.1186/1471-2458-12-621
Cite this article as: Bronner et al.: Impact of community tracer teams
on treatment outcomes among tuberculosis patients in South Africa. BMC
Public Health 2012 12:621.
Received: 27 January 2012 Accepted: 13 July 2012
Published: 7 August 2012
References
1. World Health Organization: Global tuberculosis control: WHO Report 2010.
Geneva Switzerland: WHO; 2010.
2. Thiam S, LeFevre AM, Hane F, Ndiaye A, Ba F, Fielding KL, Ndir M, Lienhardt
C: Effectiveness of a Strategy to Improve Adherence to Tuberculosis
Treatment in a Resource-Poor Setting: A Cluster Randomized Controlled
Trial. JAMA 2007, 297(4):380–386.
3. Elbireer S, Guwatudde D, Mudiope P, Nabbuye-Sekandi J, Manabe YC:
Tuberculosis treatment default among HIV-TB co-infected patients in
urban Uganda. Trop Med Int Health 2011, 16(8):981–987.
4. Health SANDo: The National Tuberculosis Control Programme. In Draft
National Tuberculosis Policy Guidelines 2008. Pretoria, South Africa: National
Department of Health of the Republic of South Africa; 2008.
5. World Health Organization: WHO Report 2008: Global tuberculosis control epidemiology, strategy, financing. Geneva Switzerland: WHO; 2008.
6. World Health Organization WHO Headquarters and Regional Offices:
International Union Against Tuberculosis and Lung Disease IUATLD,
Royal Netherlands Tuberculosis Association KNCV: revised international
definitions in tuberculosis control. Int J Tuberc Lung Dis 2001, 5(3):213–215.
7. Franke MF, Appleton SC, Bayona J, Arteaga F, Palacios E, Llaro K, Shin SS,
Becerra MC, Murray MB: Mitnick3 CD: Risk Factors and Mortality
Associated with Default from Multidrug-Resistant Tuberculosis
Treatment. Clinical Infectious Disease 2008, 46(12):1844–1851.
8. Liu Q, Abba K, Alejandria M, Balanag V, Berba R, Lansang M: The Cochrane
Library. The Cochrane Collaboration. In Reminder systems and late patient
tracers in the diagnosis and management of tuberculosis (Review).: John Wiley
& Sons, Ltd; 2008:1–37.
9. Kolappan C, Subramani R, Karunakaran K, Narayanana P: Mortality of
tuberculosis patients in Chennai, India. Bull World Health Organ 2006,
84:555–560.
10. Volmink J, Garner P: Systematic Review of Randomised Controlled Trials
of Strategies to Promote Adherence to Tuberculosis Treatment. Br Med J
1997, 315(7120):1403–1406.
11. Thomson KA, Cheti EO, Reid T: Implementation and outcomes of an
active defaulter tracing system for HIV, prevention of mother to child
transmission of HIV (PMTCT), and TB patients in Kibera, Nairobi, Kenya.
Trans R Soc Trop Med Hyg 2011, 105(6):320–326.
Submit your next manuscript to BioMed Central
and take full advantage of:
• Convenient online submission
• Thorough peer review
• No space constraints or color figure charges
• Immediate publication on acceptance
• Inclusion in PubMed, CAS, Scopus and Google Scholar
• Research which is freely available for redistribution
Submit your manuscript at
www.biomedcentral.com/submit