impact of point spread function modelling and time of flight on fdg uptake measurements in lung lesions using alternative filtering strategies
Bạn đang xem bản rút gọn của tài liệu. Xem và tải ngay bản đầy đủ của tài liệu tại đây (1.2 MB, 18 trang )
Armstrong et al. EJNMMI Physics 2014, 1:99
/>
ORIGINAL RESEARCH
Open Access
Impact of point spread function modelling and
time of flight on FDG uptake measurements in
lung lesions using alternative filtering strategies
Ian S Armstrong1,2*, Matthew D Kelly3, Heather A Williams1 and Julian C Matthews2
* Correspondence:
1
Nuclear Medicine, Central
Manchester University Hospitals,
Oxford Road, Manchester, UK
2
Institute of Population Health,
MAHSC, University of Manchester,
Manchester, UK
Full list of author information is
available at the end of the article
Abstract
Background: The use of maximum standardised uptake value (SUVmax) is
commonplace in oncology positron emission tomography (PET). Point spread function
(PSF) modelling and time-of-flight (TOF) reconstructions have a significant impact
on SUVmax, presenting a challenge for centres with defined protocols for lesion
classification based on SUVmax thresholds. This has perhaps led to the slow adoption
of these reconstructions. This work evaluated the impact of PSF and/or TOF
reconstructions on SUVmax, SUVpeak and total lesion glycolysis (TLG) under two different
schemes of post-filtering.
Methods: Post-filters to match voxel variance or SUVmax were determined using a
NEMA NU-2 phantom. Images from 68 consecutive lung cancer patients were
reconstructed with the standard iterative algorithm along with TOF; PSF modelling Siemens HD·PET (HD); and combined PSF modelling and TOF - Siemens ultraHD·PET
(UHD) with the two post-filter sets. SUVmax, SUVpeak, TLG and signal-to-noise ratio of
tumour relative to liver (SNR(T-L)) were measured in 74 lesions for each reconstruction.
Relative differences in uptake measures were calculated, and the clinical impact of any
changes was assessed using published guidelines and local practice.
Results: When matching voxel variance, SUVmax increased substantially (mean
increase +32% and +49% for HD and UHD, respectively), potentially impacting
outcome in the majority of patients. Increases in SUVpeak were less notable (mean
increase +17% and +23% for HD and UHD, respectively). Increases with TOF alone
were far less for both measures. Mean changes to TLG were <10% for all algorithms
for either set of post-filters. SNR(T-L) were greater than ordered subset expectation
maximisation (OSEM) in all reconstructions using both post-filtering sets.
Conclusions: Matching image voxel variance with PSF and/or TOF reconstructions,
particularly with PSF modelling and in small lesions, resulted in considerable
increases in SUVmax, inhibiting the use of defined protocols for lesion classification
based on SUVmax. However, reduced partial volume effects may increase lesion
detectability. Matching SUVmax in phantoms translated well to patient studies for
PSF reconstruction but less well with TOF, where a small positive bias was observed
in patient images. Matching SUVmax significantly reduced voxel variance and
potential variability of uptake measures. Finally, TLG may be less sensitive to
reconstruction methods compared with either SUVmax or SUVpeak.
Keywords: PET quantification; PSF modelling; Time-of-flight; SUV; Total lesion glycolysis
© 2014 Armstrong et al.; licensee Springer. This is an Open Access article distributed under the terms of the Creative Commons
Attribution License ( which permits unrestricted use, distribution, and reproduction in any
medium, provided the original work is properly credited.
Armstrong et al. EJNMMI Physics 2014, 1:99
/>
Background
[18F]2-Fluoro-2-deoxy-D-glucose (FDG) positron emission tomography (PET) has been
shown to play a key role in the management of patients with non-small cell lung cancer
in terms of staging and prognosis [1-5] and monitoring response to therapy [6]. In these
applications, the uptake of FDG expressed as standardised uptake value (SUV) is of key
importance, with SUVmax being the most commonly reported measure [7]. The use of
SUVmax for discrimination between benign and malignancy for soft tissue masses and
lymph nodes has been demonstrated for lung cancer patients [8,9] and changes in SUVmax
used as an indicator of response to therapy [10].
While the use of SUVmax is commonplace, it is known to be sensitive to both reconstruction parameters [11] and the amount of statistical image noise, leading to poorer
test-retest consistency relative to other SUV-based metrics [12,13]. Consequently, alternative metrics such as SUVpeak [14] and total lesion glycolysis (TLG), the product of SUVmean and metabolic tumour volume derived from the PET images, have been suggested
for use, particularly in monitoring response to therapy [6,15]. Recently, TLG has also been
shown to offer superior prognostic information than SUVmax [16-20].
In recent years, there have been significant advances in iterative image reconstruction
algorithms and scanner hardware. Consequently, reconstruction algorithms that include
point spread function (PSF) modelling [20,21] and time of flight (TOF) [22] have become
commercially available on PET/CT scanners, with TOF also available on PET/MR [23].
The use of PSF modelling, with and without TOF, has been shown to improve signalto-noise ratio (SNR) [24-27] and lesion detectability [28-30] partly through decreasing
voxel variance. However, the implementation of PSF modelling, both within projection
space and image space, from different manufacturers and also academic institutions has
been shown to produce Gibbs artefacts [21,31-35] (Nick Vennart, personal communication). In patient imaging, the Gibbs artefact, combined with reduced partial volume effects, has a significant impact on SUVmax [36-38]. This is particularly evident with
minimal or no post-reconstruction filtering, which has been shown in phantom studies
with numerical observers to provide greater lesion detectability [28-30]. Changes to
SUVmax as a consequence of PSF modelling present a challenge as changes to defined
local practice for reporting may be required such as changing the thresholds used for
the discrimination of malignancy. The scanner used in this study has been part of a
multi-site network of scanners for routine FDG oncology imaging since 2009. SUVmax
is the reported uptake metric, and the consensus amongst local reporting clinicians
within the network is that lesions with SUVmax > 5.0 are considered highly suspicious
of malignant disease.
It is necessary, in practice, to smooth clinical images to provide image quality that is
deemed acceptable for clinical reporting. This degrades the spatial resolution but increases signal to noise. The degree of smoothing applied at any given centre is heavily
influenced by the experience and personal preferences of the reporting clinicians, informed by the advice of physicists providing scientific support. Where several PET
scanners serve the same patient population, it is also advantageous to match imaging
performance across the network in terms of visual image quality and quantitative
characteristics.
A trade-off curve of signal enhancement versus noise reduction when using PSF and/
or TOF algorithms can be established by applying a range of reconstruction post-filters.
Page 2 of 18
Armstrong et al. EJNMMI Physics 2014, 1:99
/>
It has been demonstrated that it is possible to match SUVmax from PSF-based reconstruction with traditional non-PSF algorithms by applying a particular post-filter.
Lasnon et al. [39] showed that a 7.0-mm full-width-half-maximum (FWHM) postfilter with PSF reconstruction gave comparable recovery coefficients in phantom data
to non-PSF reconstructions and brought the recovery coefficients in line with European recommendations [40]. Another study proposed the application of a post-filter
for the purpose of quantification [41]. This study also demonstrated that despite a
spatially dependent PSF, this approach of using a single post-filter choice was adequate for all lesions irrespective of their location in the field of view. The application
of a relatively broad post-filter to PSF modelling images may seem counterintuitive as
it will undo the improvements in partial volume effect, but there are likely to be other
benefits that have not been reported such as a reduction in voxel variance in the
images.
Another potential solution may be to use alternative uptake metrics to SUVmax. One
study [37] suggested that TLG may be more stable when comparing PSF to non-PSF
reconstruction, but this study only assessed ten lung lesions. Another study [38] has
suggested the move to SUVmean based upon a 50% isocontour of SUVmax. To our
knowledge, there are currently no studies that investigate the impact of these reconstructions with PSF modelling and TOF on TLG and SUVpeak.
The primary aim of this study was to evaluate the impact of PSF modelling and TOF
on SUVmax-based lesion classification as implemented at the local institution. This was
performed using Siemens reconstruction software including implementations for TOF
and PSF modelling (HD, UHD). Implementations of reconstruction algorithms can differ, and therefore, the results might be specific to HD and UHD; however, we feel it is
likely that findings may be generalisable to other reconstruction implementations with
similar philosophies. Any change in FDG uptake measurements across different reconstruction protocols can hopefully allow other centres to assess how such changes may
impact their approaches to lesion classification. Two set criteria for post-filtering the
images were assessed based upon characteristic locations on a signal enhancement versus noise reduction trade-off curve. These two points are 1) matching image noise
(voxel variance) which was expected to enhance signal and 2) matching signal (SUVmax)
which, based on previous studies [39,41], was anticipated to require greater levels of
post-filtering and hence reduce image noise. This latter approach is aimed to be particularly relevant to centres that wish to maintain uptake quantification for practical
purposes, which is particularly important in multi-site imaging networks. In addition,
this work aimed to expand on the results of previous studies [36-38] with the addition
of TOF, evaluation of other uptake metrics such as SUVpeak and TLG, and determining
gains in SNR for the two strategies.
Methods
PET/CT scanner
The PET scanner used in this study was a Siemens Biograph mCT with 64 slice CT
(Siemens Medical Solutions, Erlangen, Germany). The scanner has a four-ring extended
axial field of view of 21.6 cm (TrueV) and includes options for PSF modelling (Siemens
HD·PET) and combined PSF modelling with TOF (Siemens ultraHD·PET) in the image
reconstruction. Performance data for the scanner has been published previously [42].
Page 3 of 18
Armstrong et al. EJNMMI Physics 2014, 1:99
/>
Page 4 of 18
Phantom acquisitions
A NEMA NU-2 image quality (IQ) phantom (PTW, Freiburg, Germany) was filled with
[18F]FDG so that the background compartment and all six hot spheres had activity concentrations of 5.19 and 41.7 kBq/ml, respectively. This 8:1 contrast was chosen to
mimic lung lesion contrast, which is generally high. In order to divide the data into ten
replicate datasets, a gated 60-min list-mode acquisition was performed using an ECG
simulator as the gating input. Each replicate image contained 30 million (±0.2%) net
true coincidences as this was typical of the number of counts measured over the thorax
in our standard patient acquisitions. Images were reconstructed using four methods:
standard 3-D ordinary Poisson ordered subset expectation maximisation (OSEM) reconstruction; OSEM with TOF (TOF); OSEM with PSF modelling - Siemens HD·PET
(HD); and OSEM with both PSF and TOF - Siemens ultraHD·PET (UHD). For nonTOF reconstructions, 3 iterations and 24 subsets (3i24s) were used, while for TOF reconstructions, 2 iterations and 21 subsets (2i21s) were used.
Two iterations were chosen for TOF reconstructions as TOF has been shown to
provide faster convergence with comparable signal to noise achieved in fewer iterations than non-TOF [27,43], and it has been shown in published performance data for
the scanner that one fewer iteration with TOF is optimal [42], providing similar background variability and marginally superior contrast recovery in smaller objects. However, it is not possible to exactly match the number of subsets for TOF and non-TOF
reconstructions. All images were reconstructed into a 256 × 256 matrix with voxel
sizes of 3.2 mm × 3.2 mm × 2.0 mm. As is routinely performed with patient data, a
5.0-mm FWHM Gaussian post-filter was applied to the OSEM images. The baseline
parameters of 3 iterations and 24 subsets and 5.0-mm post-filter for OSEM reconstruction have been in routine use since the scanner was commissioned in 2009.
These parameters were selected to align SUVmax quantification and voxel variance
with other scanners in the local oncology imaging network.
A variety of post-filters with different kernel widths was applied to the TOF, HD and
UHD images with kernel widths ranging from 0 to 10 mm FWHM in step sizes for
0.1 mm.
Noise matching
Twelve circular regions of interest (ROIs) of 37-mm diameter were placed in the
phantom background over five separate slices (60 ROIs in total) of the IQ phantom
image in accordance with the NEMA NU-2-2007 standard [44]. For each image replicate, the average coefficient of variation (COV) over the 60 ROIs was calculated as
COVR ẳ
60
X
k;R
kẳ1
k;R
;
1ị
where k,R and k,R are the voxel standard deviation and mean, respectively, within
ROI k and replicate R. The mean and standard deviation of COVR was determined
across all ten replicate images. The OSEM 3i24s 5.0-mm post-filter image was used to
compute the reference COV value. For the three other reconstruction methods, the
post-filter that gave the smallest difference in COV, relative to the OSEM image, was
determined.
Armstrong et al. EJNMMI Physics 2014, 1:99
/>
SUVmax matching
SUVmax is the uptake measure used in our routine patient reports and so was the measure
chosen to match across the reconstruction algorithms. To achieve this, SUVmax was measured in each hot sphere in the phantom for the OSEM images using a 3-D volume of
interest, equal in diameter to each true sphere size and centred on the sphere. As with the
COV matching, a post-filter was incremented in 0.1-mm steps on the other three reconstructions until the summed squared difference of SUVmax for the six hot spheres relative
to those in the OSEM image was minimised.
FDG patient acquisitions
Patient preparation
Retrospective data from 68 (33 males; mean [range] weight: 72.5 kg [40 to 136]; mean
[range] body mass index: 26.3 kg/m2 [14.1 to 51.8]) consecutive routine oncology patients
referred for assessment of single pulmonary nodule or staging of non-small cell lung cancer were included in this study. All data were fully anonymised before inclusion. Patients
fasted for 6 h prior to the injection of FDG and were asked to drink at least 500 ml of
water before the scan. Blood glucose was measured with permissible limits of 3.0 to
12.5 mmol/l. Patients with a body weight <100 kg were prescribed 350 MBq of [18F]FDG,
while those with body weight >100 kg (two in this study) were prescribed 400 MBq. The
mean [range] administered activity of [18F]FDG was 365.5 MBq [242.0 to 423.1]. It can be
noted that the minimum dose administered is considerably below the prescribed activity this was due to a patient arriving late and insufficient remaining activity in the stock vial.
The mean [range] time was 64.3 [59 to 87] min from the time of injection to commencing
the scan. Advice from the local ethics committee deemed that the use of retrospective
anonymised patient data did not require formal ethical approval.
PET/CT acquisitions
The PET acquisition was performed from eyes to mid-thigh for all patients, requiring
six or seven bed positions. The acquisition time for each bed position was 2.5 min.
Attenuation correction was performed using a non-contrast CT acquisition performed
prior to the PET acquisition. Scatter and random corrections were applied to all images. All images were reconstructed with OSEM 3i24s and 5.0-mm post-filter as the
reference, along with the phantom-determined TOF, HD and UHD protocols, which
match either voxel COV or SUVmax.
Uptake measurements
All images were viewed and the uptake quantified using Siemens TrueD image display
software (Siemens Medical Solutions, Erlangen, Germany). In each patient, a 3-cmdiameter spherical volume of interest (VOI) was placed within an area of uniform FDG
distribution in the liver, and the COV of the voxels within the VOI was calculated. Three
FDG uptake measurements were derived for each identified lesion within the lung: SUVmax, SUVpeak (as defined in the PET response criteria in solid tumours (PERCIST) protocol [14]) and TLG. SUV was normalised to patient body weight only. Volume delineation
for TLG was performed using a 40% threshold of SUVmax (TLG-40). Recent metaanalyses [16,17] have highlighted several methods for volume delineation - either using
percentage or absolute SUV thresholds. The choice of a percentage threshold in this study
Page 5 of 18
Armstrong et al. EJNMMI Physics 2014, 1:99
/>
Page 6 of 18
was based on a hypothesis that as the magnitude of the partial volume effect varied with
different reconstructions, the impact on the tumour volume and SUVmean would be inversely related. This may result in a more stable value for the TLG. It should be noted that
other methods of delineation are likely to produce alternative results. Lesion volume was
measured on the OSEM image using a 40% threshold of SUVmax.
Signal to noise
It is difficult to estimate SNR directly in a lesion due to inhomogeneous uptake; therefore, we have adopted the use of the liver as a source for the background and noise
measurement. This technique has been performed previously [25] and is considered a
reasonable relative surrogate for SNR in the lesion. For lesions with SUVmax above the
PERCIST threshold of 1.5 times the mean SUV in the liver VOI + 2 standard deviations
of the voxels within the liver VOI [14], the signal-to-noise ratio of the tumour, relative
to the liver, (SNR(T-L)) was calculated as
SNRTLị ẳ
Tumour Liver
;
L
2ị
where the Tumour refers to SUVmax in the lung lesion, Liver is the mean SUV measured in the liver VOI and σL is the standard deviation of voxel values measured in the
liver VOI. This method allows comparison to other studies, which have used the same
metric [25,42]. SNR(T-L) of all qualifying lesions was determined for each reconstruction
using the two filtering schemes of matched voxel COV and matched SUVmax. The gain
in SNR(T-L) was expressed for the TOF, HD and UHD reconstructions as the ratio to
the SNR(T-L) measurements from the standard OSEM images of the same patient.
Statistical analysis
Relative percentage differences of the uptake metrics relative to OSEM were expressed as
mean with 95% confidence intervals. Bland-Altman analysis was also performed on the data.
Relative changes of >25% for SUVmax and >30% for SUVpeak were considered clinically significant based upon EORTC [10] and PERCIST [14] guidelines respectively. In addition,
hypothetical changes to patient management as a consequence of SUVmax based on local
practice were recorded. Differences in voxel COV in the liver VOI and gains in SNR(T-L)
were assessed using a paired t test with a p value <0.05 considered to be significant.
Results
Phantom images
The FWHM of the post-filters obtained for matching voxel COV to OSEM 3i24s and a
5.0-mm post-filter were 4.4, 3.8 and 2.9 mm for TOF, HD and UHD, respectively. The
FWHM of the post-filters obtained for matching SUVmax were 4.8, 6.6 and 6.5 mm for
TOF, HD and UHD, respectively. To provide an illustration of the underlying impact of
each algorithm, SUVmax, expressed as a percentage of the true activity concentration, and
noise data are first shown with no post-filter in Table 1. Data are then presented with the
two post-filter sets as described in Table 2. From the data, it is seen that there is considerable increase in SUVmax in the two smallest spheres with HD and UHD with matched
voxel COV. The variability of SUVmax was greater in the two smallest spheres at matched
voxel COV, particularly with HD and UHD; the positive bias in the larger spheres with
Armstrong et al. EJNMMI Physics 2014, 1:99
/>
Page 7 of 18
Table 1 Phantom recovery data for unfiltered images
Sphere size
Background
voxel COV
10 mm
13 mm
17 mm
22 mm
28 mm
37 mm
OSEM (%)
106 (19.5)
136 (20.2)
155 (19.8)
168 (18.0)
184 (9.5)
186 (8.2)
46.3 (0.51)
TOF (%)
90 (12.0)
123 (11.2)
132 (7.2)
144 (11.0)
157 (11.4)
167 (13.7)
37.4 (0.48)
HD (%)
99 (13.7)
155 (7.2)
144 (6.2)
145 (5.3)
144 (7.1)
147 (6.0)
18.2 (0.32)
UHD (%)
103 (9.0)
151 (8.8)
141 (5.9)
136 (4.5)
135 (5.9)
138 (5.6)
14.9 (0.46)
SUVmax in each of the image quality spheres expressed as a percentage of the true activity concentration, and voxel COV
in the phantom background. Data are shown for all four reconstruction algorithms with no post-filtering applied. Values
are mean and standard deviation (SD) obtained from the replicates, with the latter shown in parentheses. For clarity, the
SD shown is the SD across the replicates expressed as a percentage of the true activity concentration in the sphere.
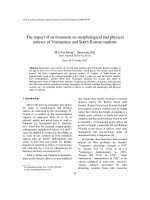
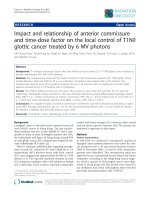
OSEM and TOF at matched voxel COV is likely to be due to image voxel variance, while
with HD and UHD at matched voxel COV, Gibbs artefacts are also expected to contribute.
This can be seen in Figure 1, which shows profiles through the centre of the 37-, 22- and
13-mm spheres.
With post-filters to match SUVmax recovery, variability is comparable or less with
HD and UHD compared with OSEM. To verify the cross-calibration between the dose
calibrator and scanner, the activity concentration, averaged across the 60 background
ROIs, was measured as 5.14 ± 0.1 kBq/ml.
Patient images
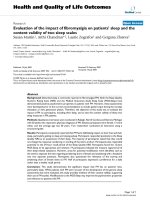
Figure 2 shows images from a single representative female patient with a BMI of 37 kg/m2.
The image has been cropped to show only the lung lesion and liver. Voxel COV within the
liver VOI was 16.3%, 15.0%, 16.5% and 15.4% for OSEM, TOF, HD and UHD, respectively,
with matched voxel COV post-filters and 13.5%, 10.8% and 7.95% for TOF, HD and UHD,
respectively, with matched SUVmax post-filters. SUVmax for the lesion in the right lung was
5.4, 6.0, 8.2 and 10.1 for OSEM, TOF, HD and UHD, respectively, with matched noise
post-filters and 5.2, 5.7 and 5.7 for TOF, HD and UHD, respectively, with matched SUVmax
post-filters. The visual reduction in voxel variance within the liver is evident in the HD
and UHD images with the matched SUVmax protocol.
Table 2 Phantom recovery data
Sphere size
OSEM
Background
voxel COV
10 mm
13 mm
17 mm
22 mm
28 mm
37 mm
53
80
96
102
110
110
12.9
Matched voxel COV
TOF (%)
58 (4.4)
84 (3.4)
97 (3.2)
101 (2.4)
110 (2.4)
113 (3.8)
12.8 (0.23)
HD (%)
73 (7.1)
123 (4.5)
122 (2.9)
121 (5.3)
121 (3.8)
123 (2.8)
12.8 (0.38)
UHD (%)
89 (6.6)
138 (7.5)
129 (3.1)
123 (2.7)
125 (4.0)
127 (4.2)
12.7 (0.43)
Matched SUVmax
TOF (%)
55 (3.8)
80 (2.8)
94 (2.9)
98 (1.8)
107 (2.3)
110 (2.9)
11.2 (0.37)
HD (%)
47 (3.0)
80 (2.3)
103 (2.7)
102 (3.5)
105 (1.3)
106 (0.9)
7.57 (0.17)
UHD (%)
49 (1.9)
81 (1.8)
102 (2.0)
100 (1.2)
104 (2.0)
105 (1.2)
6.27 (0.33)
SUVmax in each of the image quality spheres expressed as a percentage of the true activity concentration, and voxel
COV in the phantom background. Data are shown for OSEM (reference reconstruction) and the PSF and TOF-based
reconstructions with the two post-filter sets. Values are mean and standard deviation (SD) obtained from the replicates, with
the latter shown in parentheses. For clarity, the SD shown is the SD across the replicates expressed as a percentage of the
true activity concentration in the sphere.
Armstrong et al. EJNMMI Physics 2014, 1:99
/>
Figure 1 Phantom sphere profiles. Transaxial line profiles through the centre of the 37-mm sphere (a, d, g),
22-mm sphere (b, e, h) and 13-mm sphere (c, f, i). Plots in the top row are for unfiltered images, those in the
centre row are for post-filters to match voxel COV, and those in the bottom row are for plots to match SUVmax.
Liver noise
Table 3 shows the voxel COV data measured in the VOI within the patient livers. There
were no significant differences for the PSF and TOF-based reconstructions versus OSEM
when using the matched voxel COV post-filters. As with the phantom data, significant reductions of voxel COV were measured for PSF and TOF-based reconstructions compared
with OSEM using the post-filters to match SUVmax recovery. The mean measurements of
Figure 2 Coronal PET images. Coronal images from a female patient with BMI 37 kg/m2. Top row: images
with matched voxel COV. Bottom row: images with matched SUVmax.
Page 8 of 18
Armstrong et al. EJNMMI Physics 2014, 1:99
/>
Page 9 of 18
voxel COV in the liver VOI for TOF, HD and UHD were 90%, 65% and 56%, respectively,
of the value measured using OSEM.
FDG uptake measurements
Tables 4 and 5 summarise the changes of the three uptake measures observed using the
PSF and TOF-based reconstructions relative to OSEM. The data in Table 5 for the number of lesions with a change in SUVmax greater than 25% occurred in lesions with very low
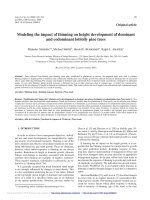
grade uptake (SUVmax <2.5). Bland-Altman plots for the relative differences are shown in
Figures 3, 4 and 5, which, in addition to data in Tables 4 and 5, show that the smaller
values of SUVmax and SUVpeak experience the greatest increase with matched voxel COV
(Figure 3a,b,c and Figure 4a,b,c). For matched SUVmax filters, this is still present with TOF
algorithms (Figure 3d,f and Figure 4d,f) but not with HD reconstruction.
For matched voxel COV, the increase in both SUVmax and SUVpeak ratio for PSF and
TOF-based reconstructions versus OSEM was inversely related to lesion volume as
shown in Figure 6. This reflects what was seen in the image quality phantom measurements. The gains in SUVmax were most pronounced with UHD, which is likely to be a
consequence of reduced post-filtering compared with HD when voxel COV was
matched (2.9 mm for UHD and 3.8 mm for HD). Differences in TLG-40 were not
dependent on lesion volume. No relationship between SUV difference and lesion volume was observed for matched SUVmax post-filters.
Out of the 74 lesions, 59 had a SUVmax of >5.0 using OSEM reconstruction. No
change to patient management would occur in these instances as a result of an increase
of SUVmax when using the PSF and TOF-based reconstructions. A key group of ten patients was identified with low or borderline SUVmax (<5.0) for suspicion of malignancy
using this institute's practice. The SUVmax for these 15 lesions in each of the reconstruction algorithms are shown in Table 6. The table shows that, with matched voxel
COV, several of these lesions would change classification with HD and UHD, as would
be expected from data in previous tables and figures. With matched SUVmax filters,
there is only one lesion that would have changed classification according to local practice and only with the TOF reconstruction.
Signal-to-noise gains
Fifty-nine lesions were found to have SUVmax above the threshold based on the liver uptake as measured on the OSEM images. Significant SNR(T-L) gains were found for PSF and
TOF-based reconstructions with both matched voxel COV and matched SUVmax. With
the addition of PSF modelling, either to OSEM or OSEM + TOF images, there is a more
marked gain in SNR(T-L). For matched voxel COV, SNR(T-L) ratios relative to OSEM were
1.10 ± 0.11, 1.43 ± 0.23 and 1.67 ± 0.41 for TOF, HD and UHD, respectively, and for
matched SUVmax, they were 1.19 ± 0.12, 1.58 ± 0.16, and 1.94 ± 0.29, respectively. For each
reconstruction algorithm, the improvement in SNR(T-L) with matched SUVmax versus
matched noise was also significant.
Table 3 Patient liver noise
Liver COV (%)
OSEM
TOF
HD
UHD
Matched COV
10.6 (2.3)
10.5 (2.4)
10.6 (2.2)
10.4 (2.1)
9.5 (2.1)
6.8 (1.5)
5.9 (1.3)
Matched SUVmax
Image noise, expressed as coefficient of variation (COV), measured in the liver for each reconstruction for matched voxel
COV and matched SUVmax post-filters. Values are mean and standard deviation, with the latter shown in parentheses.
Armstrong et al. EJNMMI Physics 2014, 1:99
/>
Page 10 of 18
Table 4 Relative uptake differences for matched voxel COV
Uptake
SUVmax
SUVpeak
TLG-40
TOF
HD
UHD
Mean% change
+8.8%
+32%
+49%
95% CI
−7.2% to +25%
+7.8% to +55%
+1.0% to +97%
n > 25% change
4/74
50/74
63/74
Mean% change
+6.9%
+17%
+27%
95% CI
−5.7% to +20%
+5.3% to +29%
+1.6% to +51%
n > 30% change
1/74
1/74
25/74
Mean% change
+1.9%
−8.4%
−7.5%
95% CI
−16% to +20%
−29% to +12%
−37% to +22%
Mean percentage changes and 95% confidence intervals of the three uptake measures relative to OSEM reconstruction.
Also shown are the number of lesions with a greater than 25% and 30% increase in SUVmax and SUVpeak, respectively.
Data in the table are from images using post-filters to match image voxel COV.
Discussion
The deployment of PSF and TOF-based reconstruction methods into routine clinical
practice for FDG imaging presents a challenge, particularly in centres or collaborative
imaging networks with a defined protocol for classification of malignancy based upon
SUV data. To our knowledge, this is the first study that has evaluated the performance
of PSF and TOF-based reconstruction algorithms with two post-filtering strategies
based on the objective criteria of matched image noise (voxel COV) or matched SUVmax, quantifying the impact on SUVmax, SUVpeak , TLG and SNR(T-L). Specific findings
are applicable to Siemens HD and ultraHD reconstruction algorithms using the parameters applied in the study.
It is clear from the data in Tables 1 and 2 and Figure 3 that quantification differences
occur in the phantom data for all algorithms applied in this study. There are several
factors that will contribute to the differences: the effect of statistical noise, partial volume effect, the size (and hence number of voxels) of the region of interest and, for the
HD and UHD algorithms, Gibbs artefacts. The contributions from these factors to the
measurements of SUVmax will differ as reconstruction parameters are varied. We believe that the interactions between the various factors are complex and not completely
separable. As such, we do not feel that it is possible to identify one single phenomenon
as the source of quantification differences for any of the algorithms used.
Table 5 Relative uptake differences for matched SUVmax recovery
Uptake
SUVmax
SUVpeak
TLG-40
TOF
HD
UHD
Mean% change
+5.4%
+0.6%
+5.3%
95% CI
−8.5% to +19%
−8.1% to +9.4%
−9.5% to +20%
n > 25% change
1/74
0/74
2/74
Mean% change
+5.3%
+1.7%
+6.3%
95% CI
−6.4% to +17%
−3.0% to +6.5%
−4.9% to +17%
n > 30% change
0/74
0/74
1/74
Mean% change
+3.8%
+2.4%
+4.0%
95% CI
−13% to +20%
−13% to +18%
−12% to +20%
Mean percentage changes and 95% confidence intervals of the three uptake measures relative to OSEM reconstruction.
Also shown are the number of lesions with a greater than 25% and 30% increase in SUVmax and SUVpeak, respectively.
Data in the table are from images using post-filters to match SUVmax.
Armstrong et al. EJNMMI Physics 2014, 1:99
/>
Figure 3 Bland-Altman plots showing relative percentage differences for SUVmax relative to OSEM.
Plots on the top row are for images with matched image voxel COV post-filters, and plots on the bottom
row are for images with matched SUVmax recovery post-filters. Reconstructions are TOF (a, d), HD (b, e) and
UHD (c, f). In each plot, the solid grey line shows the mean percentage difference and the two dashed lines
show the 95% confidence intervals.
It can be seen that overestimation occurs for all four reconstruction algorithms
(Table 1) and requires the application of a post-filter to reduce this (Table 2). The
smaller filter kernel applied to HD and UHD to match noise combined with voxel correlation leads to a lesser reduction of this overestimation. It can be seen that there appears to be a particular size of object where an overestimation with HD and UHD is
particularly prominent with no or minimal levels of post-filtering, which, in part, may
be due to overlapping Gibbs edge artefacts. Despite this, it can be seen from HD recovery data in Table 2 that, with matched voxel variance, there is very little dependence of
Figure 4 Bland-Altman plots showing relative percentage differences for SUVpeak relative to OSEM.
Plots on the top row are for images with matched image voxel COV post-filters, and plots on the bottom
row are for images with matched SUVmax recovery post-filters. Plot layout (a-f) and line styles are as
per Figure 3.
Page 11 of 18
Armstrong et al. EJNMMI Physics 2014, 1:99
/>
Figure 5 Bland-Altman plots showing relative percentage differences for TLG-40 relative to OSEM.
Plots on the top row are for images with matched image voxel COV post-filters, and plots on the bottom
row are for images with matched SUVmax recovery post-filters. Plot layout (a-f) and line styles are as
per Figure 3.
recovery on sphere size for the 13- to 37-mm spheres, which is a desirable property.
This highlights the importance of establishing a full understanding of the impact of
these algorithms, and it is the duty of medical physics experts to educate clinicians on
changes expected to quantification.
Ideally, the implementation of PSF modelling would not lead to Gibbs artefacts, but
given the necessary compromises for PET imaging with limited statistics, an improvement
in one area such as in image resolution is almost certainly going to lead to a deterioration
in other aspects. Overall, whether the changes are desirable is application dependent, with
our data showing smaller absolute errors for smaller spheres (but not for large spheres)
and reduced dependency on quantification with lesion size.
Matching image noise produces marked increases in SUVmax, particularly with PSF
reconstructions, that are potentially clinically significant, depending on local practice.
This highlights the pitfalls of using uptake metrics such as SUVmax, that are so sensitive
to partial volume effects and reconstruction parameters, with fixed thresholds for malignancy. The largest increases in SUVmax occur for small lesions, which typically have
Figure 6 Percentage differences versus lesion volume. Relative percentage differences of SUVmax for
TOF (a), HD (b) and UHD (c) compared with OSEM for the 74 lung lesions against lesion volume as
measured in the OSEM images using a 40% threshold. All plots are for matched voxel COV. The black line
illustrates the percentage differences measured for the six spheres of the image quality phantom.
Page 12 of 18
Armstrong et al. EJNMMI Physics 2014, 1:99
/>
Page 13 of 18
Table 6 Changes in SUVmax with lesions with borderline values for malignancy
Volume
SUVmax
(ml)
OSEM
TOF
Matched noise
HD
UHD
TOF
Matched SUVmax
HD
UHD
1.26
2.1
2.4
2.8
3.6
2.2
1.8
1.9
9.26
2.2
2.9
2.9
4.0
2.8
2.3
2.9
2.80
2.2
2.5
3.2
3.6
2.3
2.2
2.2
1.99
2.4
2.8
3.2
4.2
2.7
2.2
2.4
6.04
2.5
3.1
3.3
4.3
3.0
2.7
3.2
1.83
2.7
3.4
3.8
5.5
3.2
2.5
3.0
3.99
2.8
3.1
3.6
4.0
3.0
2.8
3.0
1.52
3.2
4.0
4.5
6.3
3.8
2.9
3.4
8.90
3.2
3.6
4.3
5.2
3.4
3.0
3.3
1.56
3.4
4.0
4.9
6.8
3.8
3.1
3.6
2.51
3.4
4.2
4.6
6.4
4.0
3.3
4.0
6.33
3.5
4.0
4.3
5.3
3.8
3.4
3.7
1.40
3.9
4.1
6.0
6.9
3.9
3.8
3.8
14.22
4.4
4.6
4.9
5.2
4.5
4.3
4.5
2.06
4.5
5.6
7.0
8.5
5.4
4.7
4.2
SUVmax values for patients with low uptake (<5.0) for suspicion of malignancy and the SUVmax data obtained from the
PSF and TOF-based algorithms using the two post-filter strategies. The left column shows the lesion volume as measured
from the OSEM PET image using a 40% threshold. Values in bold represent lesions that would have changed classification
using a strict SUVmax cut-off of 5.0. Values in italics represent increases of greater than 25%.
low SUVmax (less than 5), which is consistent with other studies [36,37]. One potential
solution may be to modify thresholds based on estimated tumour volume. It would be
useful to extend the matching of SUVmax to smaller objects, but this is not possible due
to the limitation of the current NEMA phantom, with 10 mm being the diameter of
the smallest sphere insert. It is these small lesions, with SUVmax close to the typical
cut-offs for discrimination of benign and malignant disease, that are arguably the most
critical lesions for lung cancer staging as they are likely to be possible additional pulmonary nodules or lymph nodes. Determining whether a lymph node is malignant, particularly those in the mediastinum, has a considerable influence on the overall staging
and will play a major role in patient management. This change in SUVmax is expected
to require an adaptation of locally used thresholds for discrimination of disease. It was
also noted from the phantom studies that variability of SUVmax was worse for PSFbased algorithms in the small spheres, which suggests worse test-retest performance in
clinical data. This is suspected to be due to increased inter-voxel correlation that is introduced when using PSF-based algorithms [21]. This increased correlation results in a
reduction of voxel variance (and hence the voxel COV as used in this study as a noise
metric), but it has been shown to potentially result in larger variability of uptake metrics within small ROIs [45]. We feel that the impact of PSF modelling on variability for
clinical data has yet to be explored fully, and while this is beyond the scope of this
study, it is recommended that caution is observed when applying PSF modelling for
assessing response to treatment with follow-up scans. Despite this, the reduced levels
of post-filtering required with PSF and PSF + TOF have been shown to improve lesion
visualisation [28-30].
With matched voxel COV, SUVpeak experiences similar differences to those seen for
SUVmax, albeit to a lesser extent. Quantification of peak uptake implicitly includes an
Armstrong et al. EJNMMI Physics 2014, 1:99
/>
additional filtering operation with a spherical kernel. The small mean relative differences for TLG suggests that it is a relatively robust uptake metric when comparing
against OSEM images for either filtering strategies. The large degree of variability
seen in the relative changes, as highlighted by the confidence intervals in Tables 4
and 5, may be concerning. However, it should also be noted that the total range of
TLG observed in this study is approximately a full order of magnitude greater than
SUVmax and SUVpeak. The use of TLG has been reported in assessment of therapy
response and, recently, for prognosis in a small number of studies. The increased
stability of TLG with a volume delineation based on a percentage of SUVmax suggests
the metric may be more appropriate than SUVmax for staging and prognosis as the
evidence base for this metric is established. We believe that this is the first time that
the dependence of TLG on reconstruction algorithm has been explored in the
literature.
Alternatively, post-filters for PSF and TOF-based algorithms can be determined to
give SUVmax that, according to this institute's practice, would not alter the outcome of
the study. For all lesions with borderline SUVmax for suspicion of malignancy, relative
changes with PSF and TOF-based reconstructions were less than 20%.
Matching SUVmax between PSF-based algorithms and OSEM has been demonstrated
previously [39]. However, our study has also shown that matching SUVmax will significantly reduce the voxel variance in the image compared with OSEM, which we believe
has yet to be demonstrated quantitatively. Combined with increased voxel correlation,
this reduction of voxel variance alters the image appearance quite considerably and
may be perceived as over-smoothing of images. Findings from this study are based
upon an image matrix of 256 × 256 voxels, whereas other centres may use different parameters such as 200 × 200 or 400 × 400 voxels, which are common choices on the
mCT due to the system's intrinsic 400 × 400 matrix. We believe that, when Gaussian
post-filtering is applied, the dependence of both image noise and SUVmax on matrix
choice is diminished. It has also been shown that the thickness of the walls of the fillable spheres of the NEMA phantom has an impact on SUVmax quantification [46,47].
This is only seen to cause appreciable error with low sphere-to-background contrast
and small spheres, and hence, we expect that the impact on the test objects used in this
study is likely to be minimal.
It is noted that the degree of post-filtering for the HD and UHD algorithms (6.6 and
6.5 mm, respectively) will reduce spatial resolution for these PSF-based algorithms
that are intended to provide superior spatial resolution. However, we feel that this approach may be beneficial when deploying a new PET/CT scanner to an existing clinical
setting, comparing patient scans for follow-up with other systems or supporting the
transition to a ‘new’ imaging facility with a catalogue or library of images with higher
resolution.
In this study, the addition of TOF increased the variation in ratio values of image
voxel variance for both phantom and patient data with either matched noise or
matched SUVmax. In the patient data only, TOF appeared to introduce a slight positive bias and greater distribution of differences in the SUVmax data. This was not
seen in the phantom studies and the cause of this is unclear. It could be due to a dependence on patient size, as TOF is associated with SNR gains proportional to the
diameter of object [48]. However, in this study and others [20], this did not appear
Page 14 of 18
Armstrong et al. EJNMMI Physics 2014, 1:99
/>
to apply in lung images where the majority of tissue in the image has low density
with very low uptake of FDG.
We believe this is the first study to demonstrate SNR gains with PSF and/or TOF
using lesion uptake as a measure of signal with two different criteria for choosing
post-filtering. A recent study has shown reductions in voxel variance and gains in
SNR but measured only in uniform areas of uptake with patient livers [27]. One
study has evaluated SNR gains using lesion uptake as the signal [25] but only comparing images reconstructed with PSF and PSF + TOF, with the intention to demonstrate the SNR gains brought on by TOF. It was expected that SNR gains would be
seen for PSF and TOF-based algorithms compared with conventional OSEM. However, it was not anticipated that the gains in SNR would be greater when parameters
are chosen to match SUVmax. This may be of particular relevance for low-contrast
lesions elsewhere in the body, such as the abdomen, which do not have the inherent
high lesion to background contrast of lung lesions. The notion that increased levels
of post-filtering may be superior in terms of SNR gains seems slightly at odds with
published work on lesion detection that suggest less post-filtering results in optimal
lesion detection [28,29]. This may be due to fact that the definition of SNR in this
study is not a direct indicator of lesion detectability.
There are two limitations with this study where future work is planned. Firstly,
no histological correlation with FDG uptake measured in the lesions was performed as in other studies [36]. Therefore, it is not possible to determine cut-off
values and diagnostic accuracy of the uptake metrics in the two strategies of implementation. This is arguably outside the scope of this study as the purpose was
not to determine such data. Secondly, we have only assessed lung lesions, and
from other studies [25], it is likely that reconstruction will perform differently in
other areas of the body.
The effect of PSF and TOF-based reconstruction on quantification, particularly
SUVmax , has limited their introduction into routine clinical use despite demonstrated improvements in lesion detectability. This study extends existing studies
[39] which have shown that the impact on SUVmax can be addressed with appropriate post-filters, by demonstrating that the same approach can be used for reconstructions with TOF reconstructions and also with alternative uptake metrics such
as SUVpeak or TLG. Furthermore, we have demonstrated that this additional filtering to match SUVmax actually provides added gains in SNR over parameters to
match image voxel COV. However, if the additional smoothing is visually undesirable, an alternative methodology can be used which performs the additional filtering
required to match SUVmax only for quantification and is not visualised [41].
Conclusions
This work evaluated the impact of reconstructions that include PSF modelling and/
or TOF on lesion classification according to a local protocol by assessing changes in
FDG uptake measurements. Two objective strategies for post-filtering were investigated: matching image voxel COV versus matching SUVmax. For matched voxel
COV, considerable increases in SUVmax and SUVpeak were observed compared with
OSEM. Using post-filters to match SUVmax reduced the discrepancies of either
SUVmax or SUVpeak across reconstructions, particularly with PSF modelling. This
Page 15 of 18
Armstrong et al. EJNMMI Physics 2014, 1:99
/>
also resulted in a considerable reduction in voxel variance. Some small discrepancies
in patient data still remained when TOF was incorporated, which was not seen in
phantom data, warranting further investigation. The TLG metric appears to be more
robust in either scheme of post-filtering despite a slightly larger variation in the
amount of change, which may be less of a problem considering the large range of
TLG data observed. This suggests TLG may be a more suitable metric to adopt instead of SUVmax as the evidence base develops. Gains in SNR were seen in both
implementations with the greatest gains seen for matched SUVmax post-filters.
Abbreviations
COV: coefficient of variation; EORTC: European Organization for Research and Treatment of cancer; FDG: 2-fluoro-2-deoxyD-glucose; FWHM: full width at half the maximum; HD: Siemens HD·PET reconstruction; OSEM: ordered subset expectation
maximisation; PERCIST: PET response criteria in solid tumours; PET: positron emission tomography; PSF: point spread
function; ROI: region of interest; SNR: signal-to-noise ratio; SUV: standardised uptake value; TLG: total lesion glycolysis;
TOF: time of flight; UHD: Siemens ultraHD·PET reconstruction; VOI: volume of interest.
Competing interests
This study was performed as part of the first author's (IA) PhD project, which receives financial support (course fees)
from Siemens Healthcare that is paid to the nuclear medicine department and then directly to the University of
Manchester.
Authors' contributions
IA managed and processed all image data and wrote the manuscript. MK assisted with data analysis (MATLAB code)
and critically appraised and modified the draft manuscript. HW critically appraised and modified the draft manuscript.
JM is a PhD supervisor and critically appraised and modified the draft manuscript. All authors read and approved the
final manuscript.
Author details
1
Nuclear Medicine, Central Manchester University Hospitals, Oxford Road, Manchester, UK. 2Institute of Population
Health, MAHSC, University of Manchester, Manchester, UK. 3Molecular Imaging, Healthcare Sector, Siemens PLC, Oxford,
UK.
Received: 28 February 2014 Accepted: 2 September 2014
References
1. Cerfolio RJ, Bryant AS, Ohja B, Bartolucci AA: The maximum standardized uptake values on positron emission
tomography of a non-small cell lung cancer predict stage, recurrence, and survival. J Thorac Cardiovasc Surg
2005, 130:151–159.
2. Cerfolio RJ, Bryant AS, Ojha B, Eloubeidi M: Improving the inaccuracies of clinical staging of patients with
NSCLC: a prospective trial. Ann Thorac Surg 2005, 80:1207–1214.
3. Subedi N, Scarsbrook A, Darby M, Korde K, Mc Shane P, Muers MF: The clinical impact of integrated FDG PET–CT
on management decisions in patients with lung cancer. Lung Cancer 2009, 64(3):301–307.
4. Dijkman B, Schuurbiers O, Vriens D, Looijen-Salamon M, Bussink J, Timmer-Bonte J, Snoeren M, Oyen W, van der
Heijden H, de Geus-Oei L-F: The role of 18F-FDG PET in the differentiation between lung metastases and
synchronous second primary lung tumours. Eur J Nucl Med Mol Imaging 2010, 37(11):2037–2047.
5. Gregory DL, Hicks RJ, Hogg A, Binns DS, Shum PL, Milner A, Link E, Ball DL, Mac Manus MP: Effect of PET/CT on
management of patients with non-small cell lung cancer: results of a prospective study with 5-year survival
data. J Nucl Med 2012, 53(7):1007–1015.
6. Erdi YE, Macapinlac H, Rosenzweig KE, Humm JL, Larson SM, Erdi AK, Yorke ED: Use of PET to monitor the
response of lung cancer to radiation treatment. Eur J Nucl Med Mol Imaging 2000, 27(7):861–866.
7. Beyer T, Czernin J, Freudenberg LS: Variations in clinical PET/CT operations: results of an international survey
of active PET/CT users. J Nucl Med 2011, 52(2):303–310.
8. Bryant AS, Cerfolio RJ: The maximum standardized uptake values on integrated FDG-PET/CT is useful in
differentiating benign from malignant pulmonary nodules. Ann Thorac Surg 2006, 82(3):1016–1020.
9. Nambu A, Kato S, Sato Y, Okuwaki H, Nishikawa K, Saito A, Matsumoto K, Ichikawa T, Araki T: Relationship between
maximum standardized uptake value (SUVmax) of lung cancer and lymph node metastasis on FDG-PET. Ann Nucl
Med 2009, 23(3):269–275.
10. Young H, Baum R, Cremerius U, Herholz K, Hoekstra O, Lammertsma AA, Pruim J, Price P: Measurement of
clinical and subclinical tumour response using [18F]-fluorodeoxyglucose and positron emission
tomography: review and 1999 EORTC recommendations. European Organization for Research and
Treatment of Cancer (EORTC) PET Study Group. Eur J Cancer 1999, 35:1773–1782.
11. Boellaard R, Krak NC, Hoekstra OS, Lammertsma AA: Effects of noise, image resolution, and ROI definition on
the accuracy of standard uptake values: a simulation study. J Nucl Med 2004, 45:1519–1527.
12. Nahmias C, Wahl LM: Reproducibility of standardized uptake value measurements determined by 18F-FDG
PET in malignant tumors. J Nucl Med 2008, 49:1804–1808.
Page 16 of 18
Armstrong et al. EJNMMI Physics 2014, 1:99
/>
13. Lodge MA, Chaudhry MA, Wahl RL: Noise considerations for PET quantification using maximum and peak
standardized uptake value. J Nucl Med 2012, 53:1041–1047.
14. Wahl RL, Jacene H, Kasamon Y, Lodge MA: From RECIST to PERCIST: evolving considerations for PET response
criteria in solid tumors. J Nucl Med 2009, 50:122S–150S.
15. Larson SM, Erdi Y, Akhurst T, Mazumdar M, Macapinlac HA, Finn RD, Casilla C, Fazzari M, Srivastava N, Yeung
HW, Humm JL, Guillem J, Downey R, Karpeh M, Cohen AE, Ginsberg R: Tumor treatment response based on
visual and quantitative changes in global tumor glycolysis using PET-FDG imaging. The visual response
score and the change in total lesion glycolysis. Clin Positron Imaging 1999, 2:159–171.
16. Wiele C, Kruse V, Smeets P, Sathekge M, Maes A: Predictive and prognostic value of metabolic tumour volume
and total lesion glycolysis in solid tumours. Eur J Nucl Med Mol Imaging 2013, 40:290–301.
17. Pak K, Cheon GI, Nam H-Y, Kim S-J, Kang KW, Chung J-K, Kim EE, Lee DS: Prognostic value of metabolic tumor
volume and total lesion glycolysis in head and neck cancer: a systematic review and meta-analysis. J Nucl
Med 2014, 55:884–890.
18. Chung MDHH, PD, Kwon MDHW, Kang MDKW, Park MDN-H, Song MDY-S, Chung MDJ-K, Kang MDS-B, Kim
MDJW: Prognostic value of preoperative metabolic tumor volume and total lesion glycolysis in patients
with epithelial ovarian cancer. Ann Surg Oncol 2012, 19:1966–1972.
19. Hyun S, Ahn H, Kim H, Ahn M-J, Park K, Ahn Y, Kim J, Shim Y, Choi J: Volume-based assessment by 18F-FDG
PET/CT predicts survival in patients with stage III non-small-cell lung cancer. Eur J Nucl Med Mol Imaging 2014,
41:50–58.
20. Panin VY, Kehren F, Michel C, Casey M: Fully 3-D PET reconstruction with system matrix derived from point
source measurements. Med Imaging, IEEE Trans 2006, 25:907–921.
21. Alessio AM, Stearns CW, Shan T, Ross SG, Kohlmyer S, Ganin A, Kinahan PE: Application and evaluation of a
measured spatially variant system model for PET image reconstruction. Med Imaging IEEE Trans 2010,
29:938–949.
22. Conti M, Bendriem B, Casey M, Chen M, Kehren F, Michel C, Panin V: First experimental results of time-of-flight
reconstruction on an LSO PET scanner. Phys Med Biol 2005, 50:4507.
23. Kalemis A, Delattre BMA, Heinzer S: Sequential whole-body PET/MR scanner: concept, clinical use, and
optimisation after two years in the clinic. The manufacturer's perspective. Magn Reson Mater Phy 2013,
26:5–23.
24. Karp JS, Surti S, Daube-Witherspoon ME, Muehllehner G: Benefit of time-of-flight in PET: experimental and
clinical results. J Nucl Med 2008, 49:462–470.
25. Lois C, Jakoby BW, Long MJ, Hubner KF, Barker DW, Casey ME, Conti M, Panin VY, Kadrmas DJ, Townsend DW: An
assessment of the impact of incorporating time-of-flight information into clinical PET/CT imaging. J Nucl Med
2010, 51:237–245.
26. El Fakhri G, Surti S, Trott CM, Scheuermann J, Karp JS: Improvement in lesion detection with whole-body
oncologic time-of-flight PET. J Nucl Med 2011, 52:347–353.
27. Akamatsu G, Ishikawa K, Mitsumoto K, Taniguchi T, Ohya N, Baba S, Abe K, Sasaki M: Improvement in PET/CT
image quality with a combination of point-spread function and time-of-flight in relation to reconstruction
parameters. J Nucl Med 2012, 53:1716–1722.
28. Kadrmas DJ, Casey ME, Black NF, Hamill JJ, Panin VY, Conti M: Experimental comparison of lesion detectability
for four fully-3D PET reconstruction schemes. Med Imaging IEEE Trans 2009, 28:523–534.
29. Schaefferkoetter J, Casey ME, Townsend DW, El Fakhri G: Clinical impact of time-of-flight and point response
modeling in PET reconstructions: a lesion detection study. Phys Med Biol 2013, 58:1465–1478.
30. Kadrmas DJ, Casey ME, Conti M, Jakoby BW, Lois C, Townsend DW: Impact of time-of-flight on PET tumor
detection. J Nucl Med 2009, 50:1315–1323.
31. Tong S, Alessio AM, Thielemans K, Stearns C, Ross S, Kinahan PE: Properties and mitigation of edge artifacts in
PSF-based PET reconstruction. Nucl Sci IEEE Trans 2011, 58:2264–2275.
32. Rahmim A, Qi J, Sossi V: Resolution modeling in PET imaging: theory, practice, benefits, and pitfalls. Med Phys
2013, 40:064301–064315.
33. Rapisarda E, Bettinardi V, Thielemans K, Gilardi MC: Image-based point spread function implementation in a
fully 3D OSEM reconstruction algorithm for PET. Phys Med Biol 2010, 55:4131–4151.
34. Watson CC: Estimating effective model kernel widths for PSF reconstruction in PET. In Nuclear Science
Symposium and Medical Imaging Conference (NSS/MIC), 2011 IEEE; 23–29 Oct. 2011; 2011:2368–2374.
35. Kotasidis FA, Matthews JC, Angelis GI, Noonan PJ, Jackson A, Price P, Lionheart WR, Reader AJ: Single scan
parameterization of space-variant point spread functions in image space via a printed array: the impact
for two PET/CT scanners. Phys Med Biol 2011, 56:2917–2942.
36. Lasnon C, Hicks RJ, Beauregard J-M, Milner A, Paciencia M, Guizard A-V, Bardet S, Gervais R, Lemoel G,
Zalcman G, Aide N: Impact of point spread function reconstruction on thoracic lymph node staging with
18F-FDG PET/CT in non–small cell lung cancer. Clin Nucl Med 2012, 37:971–976.
37. Andersen FL, Klausen TL, Loft A, Beyer T, Holm S: Clinical evaluation of PET image reconstruction using a
spatial resolution model. Eur J Radiol 2013, 82:862–869.
38. Prieto E, Dominguez-Prado I, Garcia-Velloso MJ, Penuelas I, Richter JA, Marti-Climent JM: Impact of time-of-flight and
point-spread-function in SUV quantification for oncological PET. Clin Nucl Med 2013, 38:103–109.
39. Lasnon C, Desmonts C, Quak E, Gervais R, Do P, Dubos-Arvis C, Aide N: Harmonizing SUVs in multicentre trials
when using different generation PET systems: prospective validation in non-small cell lung cancer patients.
Eur J Nucl Med Mol Imaging 2013, 40:985–996.
40. Boellaard R, O'Doherty MJ, Weber WA, Mottaghy FM, Lonsdale MN, Stroobants SG, Oyen WJ, Kotzerke J, Hoekstra OS,
Pruim J, Marsden PK, Tatsch K, Hoekstra CJ, Visser EP, Arends B, Verzijlbergen FJ, Zijlstra JM, Comans EF, Lammertsma AA,
Paans AM, Willemsen AT, Beyer T, Bockisch A, Schaefer-Prokop C, Delbeke D, Baum RP, Chiti A, Krause BJ: FDG PET
and PET/CT: EANM procedure guidelines for tumour PET imaging: version 1.0. Eur J Nucl Med Mol Imaging 2010,
37:181–200.
Page 17 of 18
Armstrong et al. EJNMMI Physics 2014, 1:99
/>
Page 18 of 18
41. Kelly MD, Declerck JM: SUVref: reducing reconstruction-dependent variation in PET SUV. EJNMMI Res 2011, 1:16.
42. Jakoby BW, Bercier Y, Conti M, Bendriem B, Townsend D: Physical and clinical performance of the mCT time-offlight PET/CT scanner. Phys Med Biol 2011, 56:2375–2389.
43. Conti M, Bendriem B, Casey M, Mu C, Kehren F, Michel C, Panin V: Implementation of time-of-flight on CPS
HiRez PET scanner. In Nuclear Science Symposium Conference Record, 2004 IEEE; 16–22 Oct. 2004; 2004:2796–2800.
44. National Electrical Manufacturers Association: NEMA Standards Publication NU 2–2007: Performance Measurements
of Positron Emission Tomographs. NEMA 2007.
45. Rahmim A, Tang J: Noise propagation in resolution modeled PET imaging and its impact on detectability. Phys
Med Biol 2013, 58:6945–6968.
46. Hofheinz F, Dittrich S, Potzsch C, Hoff J: Effects of cold sphere walls in PET phantom measurements on the
volume reproducing threshold. Phys Med Biol 2010, 55:1099–1113.
47. Berthon B, Marshall C, Edwards A, Evans M, Spezi E: Influence of cold walls on PET image quantification and
volume segmentation: a phantom study. Med Phys 2013, 40:082505.
48. Budinger TF: Time-of-flight positron emission tomography: status relative to conventional PET. J Nucl Med
1983, 24:73–78.
doi:10.1186/s40658-014-0099-3
Cite this article as: Armstrong et al.: Impact of point spread function modelling and time of flight on FDG uptake
measurements in lung lesions using alternative filtering strategies. EJNMMI Physics 2014 1:99.
Submit your manuscript to a
journal and benefit from:
7 Convenient online submission
7 Rigorous peer review
7 Immediate publication on acceptance
7 Open access: articles freely available online
7 High visibility within the field
7 Retaining the copyright to your article
Submit your next manuscript at 7 springeropen.com