failure analysis of a vibration isolator used in launch vehicle applications
Bạn đang xem bản rút gọn của tài liệu. Xem và tải ngay bản đầy đủ của tài liệu tại đây (3.3 MB, 9 trang )
Case Studies in Engineering Failure Analysis 3 (2015) 1–9
Contents lists available at ScienceDirect
Case Studies in Engineering Failure Analysis
journal homepage: www.elsevier.com/locate/csefa
Case study
Failure analysis of a vibration isolator used in launch vehicle
applications
S.V.S. Narayana Murty *, Sushant K. Manwatkar, P. Ramesh Narayanan
Material Characterization Division, Materials and Metallurgy Group, Vikram Sarabhai Space Centre, Trivandrum 695 022, India
A R T I C L E I N F O
A B S T R A C T
Article history:
Received 5 May 2014
Received in revised form 26 June 2014
Accepted 23 July 2014
Available online 9 August 2014
Vibration isolators are used in launch vehicles to protect sensitive electronic equipments
from the rigors of flight structural vibrations during the lift-off and ascent phase. Failure of
one such vibration isolator made of AISI 304 is reported in the present study after ground
level testing has been completed. The vibration isolator had a crack of length
approximately 42 mm at the fore end corner. Detailed optical and scanning electron
microscopy was conducted on the failed vibration isolator to understand the reasons for
cracking. Finally, it was concluded that micro cracks formed during the deep drawing
operation (due to large strains at the fore end corner) propagated during vibration testing
resulting in the failure of the body of the vibration isolator.
ß 2014 Published by Elsevier Ltd. This is an open access article under the CC BY-NC-ND
license ( />
Keywords:
Vibration isolator
AISI 304
Deep drawing
Micro-cracks
Optical microscopy
Scanning electron microscopy
1. Introduction
In a launch vehicle, vibration isolators are used to protect sensitive electronic equipments from the rigors of structural
vibrations during the lift-off and ascent phase. Passive elastomeric isolators are preferred over active ones, due to their
simplicity, tailorability and ease of fabrication. Silicone rubber is used in these applications due to its excellent chemical and
environmental resistance, very good damping/isolation characteristics, easy compound modification and good aging
resistance [1]. For a given load rating and configuration, stiffness and damping of the isolators are tailored to meet the
functional requirements.
Failure of a vibration isolator installed on a launch vehicle proto assembly was reported after vibration testing. The
vibration isolator consists of a silicone elastomer molded insert with a stainless steel AISI 304 pin that was co-molded and
encapsulated in a metallic body and closed at the bottom with a closure. The above said failed component with crack at the
fore end corner was studied. Further, untested and successfully tested vibration isolators were also given for the purpose of
comparison. This paper brings out the observations on the failed vibration isolator to ascertain the cause of failure.
2. Fabrication of vibration isolator
The body of the vibration isolator is made up of AISI 304 stainless steel. Deep drawing process was adopted for the
fabrication using three dies and two punches. Initially, the material was drawn by 15 mm using the first die and punch set.
* Corresponding author. Tel.: +91 471 256 3628; fax: +91 471 280 5048.
E-mail addresses: , (S.V.S. Narayana Murty).
/>2213-2902/ß 2014 Published by Elsevier Ltd. This is an open access article under the CC BY-NC-ND license ( />3.0/).
2
S.V.S.N. Murty et al. / Case Studies in Engineering Failure Analysis 3 (2015) 1–9
Subsequently, it was further drawn up to 30 mm, with second die and using same punch. Thereafter to maintain the radius
and the draw length, a third die and second punch were used. Blanks of size 200 mm  200 mm  0.8 mm thickness were
used for the fabrication of vibration isolators. The deep drawing was carried out on hydraulic power press (100 T capacity)
operated manually. No lubricants were used during deep drawing operations. Further, no annealing operation was
conducted either before or after the deep drawing operation. Raw materials used for the fabrication, untested and un-failed
vibration isolators were also analyzed for the purpose of comparison.
3. Experimental
The chemical composition of the failed vibration isolator corresponds to AISI 304 and has the composition (in weight
percentage): 0.06 C, 0.25 Si, 0.004 P and S, 0.93 Mn, 17.6 Cr, 8.0 Ni and balance Iron. The failed vibration isolator was
subjected to visual observations. The chemical composition of the isolator body was analyzed using a Niton GOLD D+ model
portable X-ray fluorescent spectrometer. The fracture surface was carefully sectioned using a Buehler slow speed precision
saw for further observations of the fracture surface. The fracture surface was observed in a Carl Zeiss EVO50 environmental
scanning electron microscope attached with an energy dispersive spectrometer (EDS). For the purpose of optical microscopy,
the specimens were mounted in Bakelite and were conventionally polished using a series of emery papers and finish polished
with a one micron diamond paste. The freshly polished specimens were etched electrolytically using 10% oxalic acid in water
to reveal the microstructure. The specimens were viewed in a Olympus (GX71 model) optical metallurgical microscope and
photographs were recorded. The hardness of the material was measured using a clemex make digital microhardness tester.
The ferrite number which indicates the quantity of magnetic phase present in the steel was measured using a Ferritescope
(Fisher). For evaluating the mechanical properties of the material, standard ASTM sub-size specimens were fabricated from
0.8 mm thick sheet specimens with a gauge width of 6.25 mm and a gauge length of 25 mm. The specimens were tested in an
Instron servo hydraulic testing machine.
4. Observations
The chemical composition of the failed vibration isolation body corresponds to AISI 304 austenitic stainless steel. The
chemical composition in weight percentage is: Cr-16.9; Ni-8.29; Mn-1.15; V-0.078; Mo-0.1 and Fe-Balance. Fig. 1 shows the
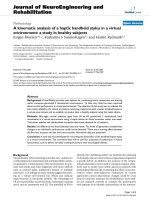
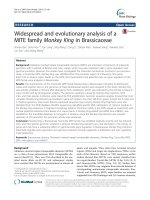
cracked vibration isolator with the elastomer in place. Visual observations were carried out on the failed vibration isolator.
The cracked vibration isolator had a crack of length approximately 42 mm at the fore end corner. The crack was wide at
center and had a zig-zag profile (Fig. 1). About 10 mm from the top of the body where crack was noticed, there exists a
circumferentially dull region, due to severe plastic straining. Below, it is bright and shining. Inside surface has die marks
along the height of the body.
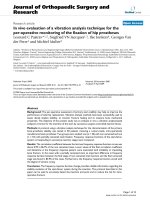
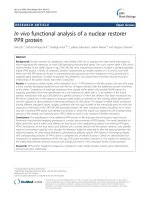
Fig. 2 shows the full body (Fig. 2(a)) of the vibration isolator along with the close up view of the crack (Fig. 2(b)). It can be
seen from Fig. 2(b) that the surface at the location of the cracks has a mat finish showing plastic deformation. The cracked
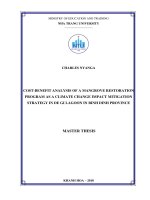
portion at the fore end corner was sectioned carefully in a Buehler make Isomet slow speed saw. Fig. 3(a) shows the low
magnification
scanning electron micrograph of the cracked surface showing zig-zag crack path and Fig. 3(b) shows the
[(Fig._1)TD$IG]
Fig. 1. Vibration isolator assembly with molded insert in place.
[(Fig._2)TD$IG]
S.V.S.N. Murty et al. / Case Studies in Engineering Failure Analysis 3 (2015) 1–9
3
Fig. 2. (a) Cracked vibration isolator body and (b) close-up view of the same showing zig-zag crack path and matted surface finish near to the corner area.
presence of microcracks near to the location of failure. The thickness at the location of crack is about 0.4 mm taken at several
locations along the crack length. These microcracks could be seen along the periphery of the crack and parallel to the main
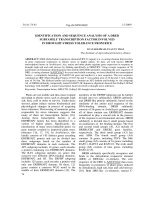
crack. Fig. 4 shows the scanning electron micrograph of the surface cracked vibration isolator showing dimples throughout
the surface. Dimples are shallow and are elongated indicating that the microstructure is highly deformed at the location of
failure. Fig. 5 shows the optical microstructures of the 0.8 mm thick raw material sheet taken on the surface which was used
for the fabrication of vibration isolator. The microstructure shows typical austenitic grains with twins on the surface of the
material. The polished and etched cross section (Fig. 5(b)) shows strain markings along the direction of rolling indicating that
the sheet has not been fully annealed.
Fig. 6(a–f) shows the optical photomicrographs obtained from base, top flange, middle of the body and top of the body and
near to crack on both sides of the body and flange of the cracked vibration isolator. The presence of deformation induced
martensite at middle and top of the body of the isolator with the original grains deformed during the deep drawing operation
can be clearly noticed. During deep drawing operation, the material is subjected to loads beyond the yield strength of the
material to induced shape change. The strains that get introduced into the material will vary the microstructure accordingly.
In the present case, the strain introduces martensitic transformation in the material which can be clearly seen in the
photomicrographs taken along the height of the vibration isolator.
Tensile testing was performed on the raw material used for the fabrication of vibration isolators. The mechanical
properties of the specimens are: 0.2% yield strength: 353 MPa; ultimate tensile strength: 741 MPa and % elongation of 65.6.
The as received sheets were subjected to annealing at 1040 8C for 30 min and mechanical properties were evaluated. The
mechanical properties of the specimens in the annealed condition are: 0.2% yield strength: 215 MPa; ultimate tensile
strength: 672 MPa and % elongation of 73.4. The reduction in the yield strength and increase in elongation after annealing
indicates that the original material is not in fully annealed condition. Fig. 7 shows the optical photomicrographs taken at the
crack edge of the failed vibration isolator. Note the presence of deformation induced martensite and deformed grains in the
radial direction taken at two different magnifications (a and b). Fig. 8 shows the photographs of the tensile tested coupons in
the as received and after annealing at 1040 8C for 30 min. The surface of the material after annealing is characterized by a
clear 45 degree fracture. Further, the higher elongation of the annealed specimens against the as received specimens can also
be clearly seen in Fig. 8. Fig. 9 shows the stress–strain curves of the tensile tested coupons in the as received and after
annealing at 1040 8C for 30 min. It can be clearly seen from the stress–strain curves that the yield and ultimate tensile
strength of the material decreases and percentage elongation improves after annealing operation.
Optical microscopic observations revealed typical austenitic structure in the raw material used for the fabrication of
vibration isolator. However, deformation induced martensite was noticed in the body of the cracked specimen (as well as
untested and successfully tested components supplied) along the height. Austenitic stainless steel AISI 304 being a
metastable steel, deformation induced martensite is expected during forming operations. Microhardness results indicate
significantly higher hardness for the cracked specimen at the location of failure (425 VPN) compared to 338 VPN (un failed
after testing) and 387 VPN (un used). The ferrite number (FN) measurement conducted on the cracked vibration isolator near
to the crack was 22 FN. The ferrite numbers on unfailed vibration isolator at same location was 10 FN. However, the ferrite
[(Fig._3)TD$IG]
4
S.V.S.N. Murty et al. / Case Studies in Engineering Failure Analysis 3 (2015) 1–9
Fig. 3. (a) Scanning electron micrograph of the cracked vibration isolator showing zig-zag crack path and (b) presence of microcracks at the location of
failure.
[(Fig._4)TD$IG]
Fig. 4. Scanning electron micrograph of the cracked vibration isolator showing dimpled failure.
[(Fig._5)TD$IG]
S.V.S.N. Murty et al. / Case Studies in Engineering Failure Analysis 3 (2015) 1–9
5
Fig. 5. Optical microstructures of the raw material used for the fabrication of vibration isolator (a) showing austenitic grains with twins on the surface of the
material and (b) strain markings on the cross section.
number on the top flange was significantly higher for the cracked vibration isolator (14 FN) against unfailed one (3 FN).
This indicates that the raw material used for the fabrication of the cracked vibration isolator is not in fully annealed
condition.
5. Discussion
Deep drawing is a metal working process used for shaping flat sheets in to cup shaped articles. Usually, a clamping or a
hold down pressure is required to press the blank against the die to prevent wrinkling, which is carried out using a blank
holder. The load in deep drawing is applied by the punch to the bottom of the cup and it is then transmitted to the side wall of
the cup. Usually, failure occurs in the narrow band of material in the cup wall just above the radius of the punch which has
undergone no radial drawing, but subjected to tensile deformation [2].
The chemical composition of the failed vibration isolator corresponds to AISI 304. The dull appearance at the fore end
region and low thickness (of 0.4 mm against the 0.8 mm indicated in the drawing) at the location of crack indicates that the
deep drawing operation resulted in large strains at the fore end corner. The hardness at the location of crack is also
significantly higher compared to the successfully tested and untested isolators. This is in agreement with the severe thinning
observed at the location of failure. The component has not undergone any stress relieving operation during or after forming.
So the presence of residual stresses is also significant.
One of the measures of deep drawability of a material is limiting drawing ration (LDR). This is defined as the largest blank
which can be drawn without tearing and is given by the ratio of maximum blank diameter to punch diameter. The ability to
be formed by stretching depends on work hardening. At the onset of necking, the material is stretched and thinned.
Therefore, maximum allowable strain at the onset of necking is an important factor in stretch forming. Limiting Drawing
6
[(Fig._6)TD$IG]
S.V.S.N. Murty et al. / Case Studies in Engineering Failure Analysis 3 (2015) 1–9
Fig. 6. (a–f) Optical photomicrographs obtained from different regions of the cracked vibration isolator. Note the presence of deformation induced martensite.
[(Fig._7)TD$IG]
S.V.S.N. Murty et al. / Case Studies in Engineering Failure Analysis 3 (2015) 1–9
7
Fig. 7. Optical photomicrographs taken at the crack edge of the failed vibration isolator. Note the presence of deformation induced martensite and deformed
grains in the radial direction taken at two different magnifications (a and b).
[(Fig._8)TD$IG]
Fig. 8. Tensile tested coupons in the as received and after annealing at 1040 8C for 30 min. Note the higher elongation of the annealed specimens and 45
degree fracture against the as received specimens.
[(Fig._9)TD$IG]
S.V.S.N. Murty et al. / Case Studies in Engineering Failure Analysis 3 (2015) 1–9
8
Fig. 9. Stress–strain curves of the tensile tested coupons in the as received and after annealing at 1040 8C for 30 min.
Ratio specification for 0.8 mm thick sheet AISI304 material is in the range of 1.95–2.05. The total area drawn is 4625 mm2
(which is equal to the summation of the area of F39 mm circular portion (1194.5 mm2) + surface area of cylindrical portion
(F39 mm  28 mm height = 3430.5 mm2). This value corresponds to a circular blank diameter of 76.74 mm. The calculated
LDR for the present configuration based on the area drawn (for a punch diameter of 37.3 mm) works out to be 76.74/
37.30 = 2.06. This value meets the specification for AISI 304 stainless steel [3].
Failure of vibration isolator can occur either if the die design is not proper or the raw material condition is not confirming
to the requirements of deep drawing operation. Based on literature, clearance at least 10–20% of sheet thickness should be
provided between the die and punch. As per the drawing and data provided by manufacturer, the clearance is of the order of
0.125 mm which meets the requirement. The corner radius measured in failed and unfailed vibration isolator specimens
were found to vary from R1.2 to R2.0 against R2.0 specified in the drawing. The yield strength of 353 MPa was found to be
higher than the specified value for annealed condition (270 MPa yield strength). The strength values and thickness reduction
indicate a reduction in percentage elongation of the order of 40% for annealed condition to cold rolled condition. The
hardness of the blank measured is about 200 VPN. The value reported by the manufacturer is around 84 HRB which is
approximately equivalent to $164 VPN. This indicates that the raw material is not in fully annealed condition.
Strain induced martensitic transformation and its effect on the strain hardening behavior of austenitic stainless steel AISI
304 is studied [4]. Some austenitic stainless steels are prone to transformation from the metastable austenitic face-centered
cubic structure to the more stable martensitic a0 phase quadratic centered structure due to strain-induced martensitic
transformation (SIMT) [5,6]. This strain-induced martensitic transformation enhances mechanical resistance and produce
additional plastic deformation in the direction of the applied stress. In the present case, strain induced martensitic
transformation was observed (Fig. 7) at the location of crack. The thickness of the material at the location of the crack was
measured to be 0.4 mm against the raw material sheet thickness of 0.8 mm used for the fabrication of vibration isolator. This
large deformation has produced strain induced martensitic transformation near to the location of crack.
Multiple micro-cracks were noticed near to the location of crack and running parallel to the length of the crack. The zigzag nature of the crack path (Fig. 2(b)) indicates that these micro cracks have joined together resulting in the failure of the
vibration isolator during vibration testing. This is corroborated by the fact that many vibration isolators fabricated with the
same die set and processed under similar processing plan have been successfully used. This eliminates the possibility of
problems related to the die design or processing. However, the hardness of the material near to the location of crack along
with large thinning observed indicated that the material used for the fabrication of the component was not in fully annealed
condition. Therefore, it is recommended to use deep drawing grade material in fully annealed condition to avoid the
recurrence of such failures.
6. Conclusion
Based on the above inferences, it can concluded that micro cracks formed during the deep drawing operation (due to large
strains at the fore end corner) propagated during vibration testing resulting in the cracking of the body of the vibration
isolator. It is recommended to use the material in fully annealed condition to avoid cracking during deep drawing operations
involving no intermediate annealing steps.
Acknowledgement
Authors wish to acknowledge Director, VSSC for his kind permission to publish this work.
S.V.S.N. Murty et al. / Case Studies in Engineering Failure Analysis 3 (2015) 1–9
9
References
[1] Abraham A, Sivakumar S, Janardhanan N, Bhagawan SS, Gopalakrishnan V, Narayanan E. Proceedings of the emerging technologies and indigenisation in
the aerospace industry. New Delhi: Allied Publishers; 1995. p. 58–74.
[2] Dieter GE. Mechanical metallurgy. Mc. Graw-Hill Book Company; 1988.
[3] Metals hand book forming and forging, 14. OH, USA: ASM, Metals Park; 1989.
[4] Choi JY, Jin W. Scr Mater 1997;36(1):99–104.
[5] Olson GB, Cohen M. Metall Trans 1975;6A:791–5.
[6] Iwamoto T, Tsuta T, Tomita Y. Int J Mech Sci 1998;40:173–85.