differential expression of genes mapping to recurrently abnormal chromosomal regions characterize neuroblastic tumours with distinct ploidy status
Bạn đang xem bản rút gọn của tài liệu. Xem và tải ngay bản đầy đủ của tài liệu tại đây (1.98 MB, 15 trang )
BMC Medical Genomics
BioMed Central
Open Access
Research article
Differential expression of genes mapping to recurrently abnormal
chromosomal regions characterize neuroblastic tumours with
distinct ploidy status
Cinzia Lavarino1, Idoia Garcia1, Carlos Mackintosh4, Nai-Kong V Cheung5,
Gema Domenech7, José Ríos7, Noelia Perez2, Eva Rodríguez1, Carmen de
Torres1, William L Gerald6, Esperanza Tuset3, Sandra Acosta1, Helena Beleta1,
Enrique de Álava4 and Jaume Mora*1
Address: 1Developmental Tumour Biology Laboratory, Hospital Sant Joan de Déu, Fundació Sant Joan de Déu, Barcelona, Spain, 2Pathology,
Hospital Sant Joan de Déu, Fundació Sant Joan de Déu, Barcelona, Spain, 3Hematology, Hospital Sant Joan de Déu, Fundació Sant Joan de Déu,
Barcelona, Spain, 4Molecular Pathology Laboratory, Centro de Investigación del Cáncer-IBMCC (USAL-CSIC), Salamanca, Spain, 5Department of
Pediatrics, Memorial Sloan-Kettering Cancer Centre, New York, USA, 6Pathology, Memorial Sloan-Kettering Cancer Centre, New York, USA and
7Unit of Biostatistics and Epidemiology, Universitat Autònoma, Barcelona, Spain
Email: Cinzia Lavarino - ; Idoia Garcia - ; Carlos Mackintosh - ; NaiKong V Cheung - ; Gema Domenech - ; José Ríos - ;
Noelia Perez - ; Eva Rodríguez - ; Carmen de Torres - ;
William L Gerald - ; Esperanza Tuset - ; Sandra Acosta - ;
Helena Beleta - ; Enrique de Álava - ; Jaume Mora* -
* Corresponding author
Published: 13 August 2008
BMC Medical Genomics 2008, 1:36
doi:10.1186/1755-8794-1-36
Received: 4 March 2008
Accepted: 13 August 2008
This article is available from: />© 2008 Lavarino et al; licensee BioMed Central Ltd.
This is an Open Access article distributed under the terms of the Creative Commons Attribution License ( />which permits unrestricted use, distribution, and reproduction in any medium, provided the original work is properly cited.
Abstract
Background: Neuroblastic tumours (NBTs) represent a heterogeneous spectrum of neoplastic
diseases associated with multiple genetic alterations. Structural and numerical chromosomal
changes are frequent and are predictive parameters of NBTs outcome. We performed a
comparative analysis of the biological entities constituted by NBTs with different ploidy status.
Methods: Gene expression profiling of 49 diagnostic primary NBTs with ploidy data was
performed using oligonucleotide microarray. Further analyses using Quantitative Real-Time
Polymerase Chain Reaction (Q-PCR); array-Comparative Genomic Hybridization (aCGH); and
Fluorescent in situ Hybridization (FISH) were performed to investigate the correlation between
aneuploidy, chromosomal changes and gene expression profiles.
Results: Gene expression profiling of 49 primary near-triploid and near-diploid/tetraploid NBTs
revealed distinct expression profiles associated with each NBT subgroup. A statistically significant
portion of genes mapped to 1p36 (P = 0.01) and 17p13-q21 (P < 0.0001), described as recurrently
altered in NBTs. Over 90% of these genes showed higher expression in near-triploid NBTs and the
majority are involved in cell differentiation pathways. Specific chromosomal abnormalities observed
in NBTs, 1p loss, 17q and whole chromosome 17 gains, were reflected in the gene expression
profiles. Comparison between gene copy number and expression levels suggests that differential
expression might be only partly dependent on gene copy number. Intratumoural clonal
Page 1 of 15
(page number not for citation purposes)
BMC Medical Genomics 2008, 1:36
/>
heterogeneity was observed in all NBTs, with marked interclonal variability in near-diploid/
tetraploid tumours.
Conclusion: NBTs with different cellular DNA content display distinct transcriptional profiles
with a significant portion of differentially expressed genes mapping to specific chromosomal regions
known to be associated with outcome. Furthermore, our results demonstrate that these specific
genetic abnormalities are highly heterogeneous in all NBTs, and suggest that NBTs with different
ploidy status may result from different mechanisms of aneuploidy driving tumourigenesis.
Background
Neuroblastic tumours (NBTs) are one of the most common neoplasms in childhood, accounting for approximately 40% of solid tumours encountered in the first four
years of life [1]. NBTs are heterogeneous in terms of their
biological, genetic and morphological characteristics and
exhibit marked diverse clinical behaviours.
The biological bases of these processes are poorly understood. There is an apparent link between NBTs aggressiveness and specific genetic aberrations (i.e., MYCN
amplification, chromosome deletions of 1p36, 11q23,
14q32 or 19q13.3; gain of 17q and near-diploid/tetraploid DNA content), indicating that specific genetic alterations are present in individual categories of NBTs and
likely contribute to clinical outcome [2-4].
Abnormal cellular DNA content is ubiquitous in cancer
and has been linked to the rate of cell proliferation, cell
differentiation, and prognosis in a variety of tumour cell
types. In contrast to most other tumours, hyperploidy
confers a favourable prognosis in NBTs [5], acute lymphoblastic leukemia [6], and rhabdomyosarcoma [7].
Non-metastatic loco-regional NBTs (stages 1, 2 and 3)
often show modal chromosomal numbers in the near-triploid range (58 to 80 modal chromosome number) and
few structural aberrations [5]. On the other hand, karyotypes of metastatic NBTs are commonly near-diploid (44
to 57 chromosomes) or near-tetraploid (81–103 chromosomes) with structural changes [5].
The presence of specific and recurrent chromosomal alterations in NBTs suggests that gene copy number abnormalities represent a major biologically relevant event, which
contributes to NBT growth and survival. The aim of the
current study was to gain further insight into the difference in gene expression of distinct biological entities
within NBTs defined by the ploidy status.
Methods
Patients and samples
Forty-nine diagnostic primary NBT specimens (24 stages
1, 2, and 3; 7 stage 4s; and 18 stage 4) obtained from
patients diagnosed and treated at MSKCC were selected
for gene expression profiling (Table 1). Risk assessment
was defined by the INSS staging classification, the MSKCC
biological risk stratification criteria, and the COG clinical
staging criteria. NBT stages 1, 2, 3 and 4s were treated
without use of cytotoxic therapy, when possible, according to MSKCC protocols. Stage 4 NBTs patients were
treated according to N5, N6 or N7 protocols. This study
was approved by the MSKCC and HSJD Institutional
Review Boards and informed consent was obtained before
collection of all samples.
Twenty-one samples (9 stages 1, 2, and 3; 1 stage 4s; and
11 stage 4) of the original MSKCC NBT cohort included in
the gene profiling analysis and an independent set of 25
primary NBT specimens (12 stage 1, 2, and 3, 2 stage 4s,
and 11 stage 4) obtained at diagnosis from 3 Spanish
institutions (HSJD, Barcelona; Hospital La Paz, Madrid;
and Department of Pathology, University of Valencia)
were available for validation analyses (Table 1). Normal
control DNA was obtained from the National DNA Bank
of Spain.
All tumour-specimens were evaluated by the same pathologists (WG and NP) to assess tumour cell content, only
tumours with > 70% were included in the study.
DNA content analysis
The modal DNA content was determined by flow cytometry DNA analysis on nuclei isolated from paraffin sections
using the method of Hedley modified [8]. DNA index
(DI) was expressed as the ratio of tumour DNA content/
standard DNA fluorescence; near-diploid DI = 0.90–1.20;
near-triploid DI = 1.21–1.75; near-tetraploid DI = 1.76–
2.20.
Gene expression profiling
Gene expression profiling was performed of 49 primary
NBT samples (22 near-triploid, 23 near-diploid and 4
near-tetraploid) using Affymetrix GeneChip Human
Genome U95 Set™ Arrays, as previously reported [9].
Microarray data and sample annotations have been
deposited in the caArray database http://caar
raydb.nci.nih.gov/caarray/.
Page 2 of 15
(page number not for citation purposes)
BMC Medical Genomics 2008, 1:36
/>
Table 1: Clinical and Biological characteristics of patients with Neuroblastoma evaluated according to tumour ploidy status.
Case number
ploidy
Age
INSS stage
<12m=0;
>12m=1
1,2,3,4s=0; 4=1
MYCN
amplification
Disease Status Survival Status
microarray
analysis
validation
analysis
1
2
3
4
5
6
7
8
9
10
11
12
13
14
15
16
17
18
19
20
21
22
23
24
25
26
27
28
29
30
31
32
33
34
35
36
37
near-3n
near-3n
near-3n
near-3n
near-3n
near-3n
near-3n
near-3n
near-3n
near-3n
near-3n
near-3n
near-3n
near-3n
near-3n
near-3n
near-3n
near-3n
near-3n
near-3n
near-3n
near-3n
near-3n
near-3n
near-3n
near-3n
near-3n
near-3n
near-3n
near-3n
near-3n
near-3n
near-3n
near-3n
near-3n
near-3n
near-3n
1
1
1
0
0
0
0
0
0
0
1
0
1
1
0
0
0
1
1
1
0
1
0
0
0
0
1
1
1
1
0
0
1
0
0
0
0
0
0
0
0
0
0
0
0
0
0
0
0
1
0
0
0
0
1
0
0
0
0
0
0
0
0
0
0
0
0
1
0
1
0
0
0
0
NA
NA
NA
NA
NA
NA
NA
NA
NA
NA
NA
NA
NA
NA
NA
NA
NA
NA
NA
NA
NA
NA
NA
NA
NA
NA
NA
NA
NA
NA
NA
NA
NA
NA
NA
NA
NA
NP
NP
NP
NP
NP
NP
P
P
NP
NP
NP
NP
P
NP
NP
NP
P
P
NP
NP
P
P
NP
NP
NP
NP
NP
NP
NP
NP
NP
NP
P
NP
P
NP
NP
A
A
A
A
A
A
A
A
A
A
A
A
D
A
A
A
A
D
A
A
A
D
A
A
A
A
A
A
A
A
A
A
A
A
D
A
A
Y
Y
Y
Y
Y
Y
Y
Y
Y
Y
Y
Y
Y
Y
Y
Y
Y
Y
Y
Y
Y
Y
.
.
.
.
.
.
.
.
.
.
.
.
.
.
.
Y
.
Y
.
Y
.
.
.
.
.
Y
.
.
.
Y
.
Y
Y
.
Y
.
Y
Y
Y
Y
Y
Y
Y
Y
Y
Y
Y
Y
Y
Y
Y
Y
38
39
40
41
42
43
44
45
46
47
48
49
50
51
52
53
54
near-2n
near-2n
near-2n
near-2n
near-2n
near-2n
near-2n
near-2n
near-2n
near-2n
near-2n
near-2n
near-2n
near-2n
near-2n
near-2n
near-2n
1
1
1
1
1
1
1
1
1
1
1
0
0
0
1
1
1
1
1
0
1
1
1
1
1
1
0
0
1
0
0
1
0
0
A
A
NA
A
A
NA
NA
A
NA
NA
NA
A
NA
NA
A
A
NA
NP
P
P
P
P
NP
P
P
NP
P
P
NP
NP
P
P
NP
NP
A
D
D
D
A
A
D
D
A
D
D
A
A
A
D
A
A
Y
Y
Y
Y
Y
Y
Y
Y
Y
Y
Y
Y
Y
Y
Y
Y
Y
Y
Y
.
Y
Y
Y
.
.
.
.
.
.
Y
.
Y
Y
.
Page 3 of 15
(page number not for citation purposes)
BMC Medical Genomics 2008, 1:36
/>
Table 1: Clinical and Biological characteristics of patients with Neuroblastoma evaluated according to tumour ploidy status. (Continued)
55
56
57
58
59
60
61
62
63
64
65
66
67
68
near-2n
near-2n
near-2n
near-2n
near-2n
near-2n
near-2n
near-2n
near-2n
near-2n
near-2n
near-2n
near-2n
near-2n
1
0
0
1
1
1
0
1
1
1
1
0
1
1
1
0
0
1
1
0
0
1
1
1
1
0
1
1
NA
NA
NA
NA
NA
NA
NA
NA
A
NA
NA
A
A
NA
P
P
NP
P
P
P
NP
P
P
NP
P
NP
P
P
D
A
A
D
D
D
A
D
D
A
D
A
D
A
Y
Y
Y
Y
Y
Y
.
.
.
.
.
.
.
.
Y
.
.
.
Y
.
Y
Y
Y
Y
Y
Y
Y
Y
69
70
71
72
73
74
near-4n
near-4n
near-4n
near-4n
near-4n
near-4n
1
0
1
0
1
1
0
1
1
1
0
1
NA
A
NA
NA
A
A
NP
P
NP
P
P
P
A
D
A
A
D
D
Y
Y
Y
Y
.
.
.
Y
Y
.
Y
Y
MYCN amplification status: NA = not amplified, A = amplified. Disease status: NP = no disease progression, P = disease progression. Survival
status: A = alive, D = dead. Microarray and validation analyses: Y = cases analyzed.
Differential gene expression analysis
Genes with high variability within samples were selected
by pair-wise comparison analyses performed by adjusting
the type-I error for multiple tests (Step-down permutation
(SDP) [10], and False Discovery Rate (FDR) [11]), and
with no type-I error adjustment (Raw method). The cutoff Family-wise error applied to select significant genes by
means of the T-test for independent data, a univariate
screening supervised procedure, was equivalent for all
three methods: < 0.1, < 0.05 and < 0.01. Hierarchical clustering analyses were performed for the differentially
expressed genes for all the methods of adjustment of
Type-I error and cut-off of P-values, using a multivariate
unsupervised method, taking into account the relationship between gene expressions. Fisher's exact test and 95%
bilateral confidence interval using Wilson method were
used to evaluate the proportion with which chromosomes
were represented in the selected gene sets in comparison
to chromosome representation within the Affymetrix
GeneChip U95Av2. Statistical analyses were performed
using SAS 9.1 and JMP 5.1 (SAS Institute Inc) for Windows and CIA 2.1.1.
Gene Ontology annotation categories
Gene Ontology (GO) annotation categories were analyzed using explore GeneOntology (eGOn v2.0) in Gene
Tools web service to create a biological profile of the differentially expressed genes. Overrepresented GO terms were determined statistically by
Fisher's exact test (P < 0.01) and adjusted FDR < 0.01.
Quantitative Real-time PCR (Q-PCR)
Quantification of transcript levels using Q-PCR was performed of 13 genes located on chromosomes 1 and 17
(see Additional file 1). Concomitant quantification of
gene copy number was performed for a set of these genes
(see Additional file 1). MYCN gene copy number was analyzed by Q-PCR, and FISH when needed. Validation analyses were performed on 46 primary NBT specimens (see
patients and samples).
Q-PCR reactions and quantification, using the ΔΔCT relative quantification method, were performed on an ABI
Prism 7000 Sequence Detection System using TaqMan®
Assay-on-Demand Gene Expression products, according
to the manufacturer's protocols (Applied Biosystems, US).
All experiments included no template controls and were
performed in duplicate and repeated twice independently.
Transcript levels were measured relative to 3 normal tissue
samples (adrenal gland, lymph node and bone marrow)
and normalized to TATA box binding protein (TBP),
hypoxantine phosphoribosyltransferase 1 (HPRT1) and
succinate dehydrogenase complex, subunit A (SDHA)
expression values. Endogenous control genes were chosen
on the basis of recent publications regarding accurate normalization of real-time quantitative RT-PCR in primary
neuroblastoma [12,13]. These genes are reported within
the most stable set of endogenous control genes. Gene
copy number quantification was performed as reported
previously [14]. Gene copy number was calculated relative to placental DNA using the B-Cell maturation factor
(BCMA) as reference gene. The validity of BCMA as reference gene in our cohort of NBTs was determined by copy
Page 4 of 15
(page number not for citation purposes)
BMC Medical Genomics 2008, 1:36
number ratio: BCMA NB tumour test sample/BCMA placenta calibrator sample. The ratio measured was equal to 1.0016; (tumour
DNA 1.0012 ± 0.13 SD)/(placental DNA 0.9996 ± 0.05).
Fluorescent in situ hybridization (FISH)
FISH was assayed on 4 μm sections of Tissue-Micro-Array
(TMA) of formalin-fixed paraffin-embedded NBT samples
corresponding to the validation set, and partially matching the MSKCC series described above. Tissue microarrays
included only tumour areas showing > 90% of tumour
cells. Sections were washed with 2× SSC buffer and fixed
in 4% paraformaldehyde in PBS. DNA-probes, CEP 17
Alpha (Ref: 32-112017;Vysis, IL, USA) LSI p53 (Ref:30190008;Vysis) and/or LSI 1p36 (Ref:30-231004;Vysis),
were denatured at 73°C, 5 min., applied to tissue sections
and simultaneously denatured using the Hybridizer
(DAKO) at 90°C, 4 min. Hybridization was performed for
16 h at 37°C in a humid chamber. Slides were then
washed with Buffer post-hybridization (Master Diagnostica, Granada, Spain) and stained with DAPI (6-diamidino-2-phenylindole) and mounted with Vectashield H1000 medium (Vector). One hundred nuclei were evaluated for each core. Results were recorded as percentage of
nuclei present in the sample having each probe signal pattern. Cell populations < 5% of abnormal cells were not
scored as significant. Microscope Magnification ×1000.
Array comparative genomic hybridization (aCGH)
Whole genome BAC-aCGH studies were performed using
the Sanger 1 Mb clone set (kindly provided by Dr. K. Szuhai LUMC, The Netherlands). BAC/PAC clones were
added to increase resolution for regions of interest: full
genomic coverage clones for chromosome 17 (CHORI)
and chromosome 11 (BAC/PAC isolated DNA, kindly
provided by Dr. J. San Miguel, CIC, Salamanca), and
19q13 enriched medium-coverage set (Invitrogen, CA,
USA and kindly provided by Dr. JC Cigudosa, CNIO,
Spain). BAC DNA was extracted, amplified by DOP and
Aminolinking-PCR and spotted in triplicate onto Codelink slides (Amersham Biosciences, GE, USA).
Tumour and reference DNA (an equimolar DNA pool
from 40 healthy donors, obtained from the Spanish
National DNA Bank) was Cy5/Cy3-dCTP (Amersham,
GE) labelled using a non-commercial Random Priming
kit composed by Random Octamers dissolved in Eppicentre Exo-Minus Klenow buffer, a dNTPs mix depleted in
dCTP and Exo-Minus Klenow enzyme (Eppiocentre).
Labelled DNA was purified through Illustra G-50 Microspin Columns, mixed and then precipitated along with Cot
DNA (Roche). Hybridization was performed for 48 hours
at 42°C and probe excess removed.
Imaging acquisition and data analysis
/>
Log2 data was acquired using Axon 4000B scanner and
GenePix software. Normalization was done with GenePix
software using the mean of the median of ratios of all the
autosomal features in the array, excluding those removed
by the quality flagging scripts. Gpr files were subsequently
processed with Bioconductor packages (CRAN) incorporating scripts for removing SD > 0.2 and GenePix flagged
spots. DNA copy algorithm and Merge Levels scripts (both
implemented in snap CGH package) were applied for segmentation of the data. A graded colour code adjusted to
the log2 rank of each individual plot was assigned to
define the segments found by the applied algorithm. Universal threshold cut-off values for defining gain/loss were
not applied because of subpopulation clonal heterogeneity, ploidy, and percentage of neuroblastic cells, which
varied from one sample to another. Due to this, plots were
evaluated independently by visual examination and
results were depicted using a graded colour code adjusted
to the log2 rank of each plot, assigning a colour grade to
every segment found by the segmentation algorithm.
Results
Differential gene expression analysis
Gene expression analysis was performed on a spectrum of
49 NBTs with varying DNA content (22 near-triploid, 23
near-diploid and 4 near-tetraploid). Owing to reduced
number of near-tetraploid cases included in this study and
taking into account the reported biological and clinical
similarities with near-diploid NBTs [15,16], near-diploid
and near-tetraploid NBTs were combined in one group.
Pair-wise comparison analyses of near-triploid (n = 22)
versus near-diploid/tetraploid (n = 27) NBTs revealed
small sets of differentially expressed genes when using a
stringent correction for multiple sampling, (6 genes [FDR
< 0.01] and 12 genes [SDP < 0.1]) (see Additional file 2).
Interestingly, all genes showing a higher expression in the
near-triploid group mapped to chromosome 17 (see
Additional file 2). Less stringent multiple testing corrections selected a larger set of differentially expressed genes,
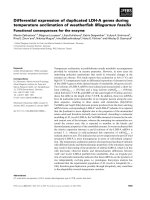
(51 genes [FDR < 0.05] (Fig. 1) and 254 genes [FDR < 0.1]
(see Additional file 2). Again, this resulted in a statistically
significant proportion of genes mapping to chromosomes
with described recurrent abnormalities in NBTs; chromosome 1 (p = 0.01) and chromosome 17 (p < 0.0001) (Fig.
1). Chromosomal region specificity was observed since
the majority of chromosome 1 and 17 differentially
expressed genes spread over 1p36-p22.1 and 17p1317q21 (Fig. 1; see Additional file 2). The majority showed
higher expression in near-triploid NBTs; 92% (CI: 78% to
97%) of chromosome 1 genes and 91% (CI: 76% to 96%)
of chromosome 17 (see Additional file 2). Only 8% (CI:
2% to 21%) probe sets for genes located on chromosome
1, ENO1 (1p36.2), CCT3 (1q23) and C1orf107 (1q32.2),
and 9% (CI: 3% to 23%) for genes on chromosome 17,
Page 5 of 15
(page number not for citation purposes)
BMC Medical Genomics 2008, 1:36
/>
5q32 ABLIM3
17p12-p11.2 PMP22
7p12-p11.2 GRB10
17p13.2 ZZEP1
7p22 RAC1
1p34.3 PHC2
1q42.1 DISC1
11p12-q12 ARHGAP1
1p36.3 CDC2L2
17p13.1 POLR2A
17p11.2 TOML2
17q22-q23 TNFAIP1
17p13.3 RUTBC1
17p11.2 EPN2
17q11.2 IFT20
17p13.3 SKIP
17q21.1-q21.3 EZN1
1p36.31 CHD5
1p36.22 CLSTN1
1p36.33 GNB1
17p13.3 GARNL4
17p13.3 PAFAH1B1
17q23-q24 RGS9
1p36.2 TNFRSF25
1p36.1-p36.2 RERE
17q11-q12 FLOT2
17p11.2 ALDH3A2
7p11 DDC
1q21-q22 NTRK1
19p13.2 CARM1
5q33.3-q34 FABP6
19q12-q13.1 UQCRFS1
19q13.1 SPINT2
Xq28 Cxorf40
Xq27 LDOC1
Xq28 VBP1
16q23.3 MPHOSPH6
14q21.1 PNN
19p13.2 FARSLA
19p13.13 RNASEH2A
2p22.2 CEBPZ
Xq28 SSR4
3q24 GMPS
3q21-q23 MRPL3
4p15.31 GPR125
12q23.1 SNRPF
1p36.3-p33.2 ENO1
5q35 NPM1
14q11.2-q12 APEX1
Xq25 RAB33A
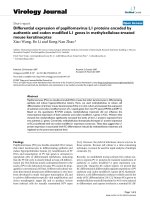
Figure
A
heatmap
1 illustrating the distinct expression profiles of 49 NB primary tumours with varying ploidy status
A heatmap illustrating the distinct expression profiles of 49 NB primary tumours with varying ploidy status.
Gene expression profiles visualized according to 51 differentially expressed genes [FDR < 0.05]. (Right) Gene dendrogram is
divided in 2 main gene clusters. Top cluster: genes displaying higher expression in near-triploid tumours; a statistically significant proportion of genes map to chromosome 1 (p = 0.01) and chromosome 17 (p < 0.0001) (Blue). Bottom cluster: genes
with higher expression in near-diploid/tetraploid NBTs. (Bottom) Filled in boxes: Ploidy: black = near-diploid, empty white
boxes = near-triploid, grey = near-tetraploid NBTs; MYCN: black = amplified, white = not amplified; Age: black > 12 months,
white < 12 months; INSS: black = Stage 4 NBTs, white = stages 1, 2, 3, and 4S.
MAC30 (17q11.2) and NME1 (17q21.3), showed a
higher expression within near-diploid/tetraploid NBTs.
The Gene Ontology biological profile of genes with higher
expression in near-diploid/tetraploid NBTs showed
enrichment for genes related to protein, macromolecular
and nucleic acid biosynthesis, such as, NME1, ATP5I,
ATP5C1, NME4, TYMS and GMPS. Whereas, near-triploid
tumours included genes involved in vesicle mediated
transport, cell communication, signal transduction, nervous system development and regulation of small GTPase
mediated signal transduction. A large portion of these
genes mapped to chromosomes 1 and 17 (60–100%),
among these RERE, CHD5, CLCN6, CDC42BPA, NTRK1,
ARHGEF11, PMP22, VAMP2, GARNL4, MAP2K4 and
FLOT2.
Quantitative Real-time Polymerase Chain Reaction (QPCR)
Quantification of transcript levels of 13 differentially
expressed genes, located mainly on the chromosomal
regions 1p36 and 17p13-q21, was performed on two separate groups of NBT specimens: 21 primary NBTs from the
original MSKCC cohort as well as on an independent set
Page 6 of 15
(page number not for citation purposes)
BMC Medical Genomics 2008, 1:36
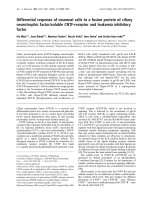
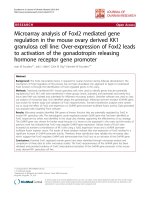
of 25 NBTs (Table 1). Expression levels identified by QPCR confirmed the microarray data in both sets of NBTs
(Fig. 2A, B and 2C).
Four genes located on chromosomes 1 and 17 were further analyzed for gene copy number by DNA Q-PCR analysis in 27 cases (Tables 2 and 3; see Additional file 3).
Near-triploid NBTs (n = 13) showed, both for chromosome 1 and 17, fold values consistently higher (≥ 1.3fold) than normal reference gene values, and were considered to represent a minimum trisomic gene copy number.
Only case # 2 (Table 2; see Additional file 3) showed 0.8–
1.1-fold values reflecting a possible loss of 1p36, subsequently confirmed by FISH and aCGH results. Near-diploid/tetraploid NBTs (n = 13) displayed a wider range of
values (0.5–2.7-fold), indicative of losses and gains
within a more heterogeneous clonal population, as
shown by FISH results. Tumour clonal heterogeneity may
often confound analyses performed on the bulk of the
tumour specimen and could explain some discrepancies
between ploidy and gene copy number.
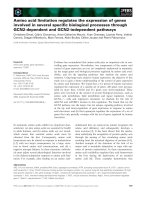
Comparison between DNA gene copy number and expression levels (Fig. 3) revealed an overall linear correlation
for those analyzed genes that displayed in the microarray
analysis higher expression levels in near-triploid NBTs.
Conversely, NME1 gene, as from microarray results,
showed low expression values, closer to the disomic reference sample expression, in near-triploid NBTs, and high
fold increase in mRNA levels in near-diploid and tetraploid cases.
Fluorescent in situ hybridization (FISH)
Interphase FISH using the DNA probes LSI 1p36 and LSI
1q25 was performed on 13 primary NBTs drawn from the
HSJD cohort; four cases were not evaluable (Table 2).
According to chromosome 1 status, near-triploid and
near-diploid/tetraploid NBTs were characterized by intratumoural heterogeneous cell population content. Only 1
case showed uniform distribution of probe signals within
cells of the tumour specimen (case #10, Table 2). All but
one of the near-triploid NBTs were constituted of clonal
populations with two LSI 1p36 and LSI 1q25 signals (2:2)
and/or three (3:3) DNA probe signal, ranging from 40–
60% and 40–100% of the cells, respectively. Case # 2 was
the only near-triploid NBT that exhibited a chromosome
1p36 loss in 30% of cells, confirmed by aCGH and QPCR. Even higher intratumoural heterogeneity was
observed in near-diploid/tetraploid NBTs.
/>
(2 CEP 17 and 2 LSI p53 signals, 2:2), three (3:3) and four
(4:4) chromosome 17 signals clonal populations that
ranged from 10–55%, 24–70% and 7–45% of the cells,
respectively. Near-diploid/tetraploid NBTs were composed by a more heterogeneous cell population, with a
high incidence of chromosomal structural abnormalities.
In a large portion of these tumours, alongside with the
two (2:2) DNA probe signal clonal populations (6%–
100% of cells), the aneuploid cell population counterpart
constituted a significant and heterogeneous portion of cell
population (Tables 3 and 4).
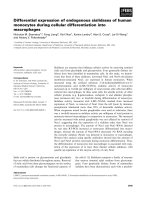
Intratumoural clonal heterogeneity was observed in all
the FISH analyses (Fig. 4).
Array comparative genomic hybridization (aCGH)
Genome array CGH was performed for 13 cases, drawn
from the HSJD validation set of NBTs, with complete FISH
and Q-PCR analyses (Tables 2 and 3; Fig. 5). Near-triploid
NBTs exhibited the highest incidence of specific chromosomal alterations, with consistent gain or loss of whole
chromosomes, being chromosomes 7 and 17 the most frequently gained (83% and 100% cases, respectively),
whilst, chromosomes 3, 4, 9, 14, 16 (50% cases), and 19
(67% NBTs) were among the most frequently lost,
although the set of cases is not large enough for statistically significant results. Chromosome 1p loss was
observed only in one case (case# 2, Table 2), a near-triploid stage 4s tumour.
Specific near-diploid/tetraploid copy number alterations
were characterized by a more heterogeneous pattern of
chromosomal aberrations than those of near-triploid,
being partial chromosomal segment alterations much
more frequent than in near-triploid tumours (Fig 5; see
Additional file 4). Partial loss of 11q and partial gain of
17q were only observed in near-diploid/tetraploid samples and never in near-triploid NBTs. Chromosome 20
showed a common pattern being one of the most frequent
gains both in near-diploid and near-triploid NBTs. MYCN
amplification was absent in near-triploid cases and shared
by near-diploid/tetraploid cases.
Further copy-number alterations that did not reach the
maximum log2 values, but were clearly distinguishable in
terms of segmentation algorithm, were detected in the
array CGH plots and could reflect higher intratumoural
clonal heterogeneity (data not shown).
Discussion
Chromosome 17 FISH using centromeric CEP 17 and LSI
p53 (17p13.1) DNA probes, was performed on 53 primary NBTs (13 cases from the HSJD cohort, Table 3, and
40 cases from MSKCC, Table 4). Based on chromosome
17 status, near-triploid tumours were constituted of two
Aneuploidy is ubiquitous in cancer and has been linked to
cell proliferation, cell differentiation and prognosis. The
karyotypes of most tumours are aneuploid, meaning that
chromosomes, which carry thousands of genes, are structurally rearranged, duplicated, broken or entirely missing.
Page 7 of 15
(page number not for citation purposes)
BMC Medical Genomics 2008, 1:36
/>
Figure
Quantitative
2 real-time PCR validation of microarray gene expression data
Quantitative real-time PCR validation of microarray gene expression data. Comparison of gene expression levels of
5 representative genes located on chromosomes 1 and 17. A. Microarray gene expression data in 49 NBT from MSKCC. Gene
expression data were log-transformed and normalized to TBP expression levels; B. Q-PCR gene transcript quantification in 21
NBTs from MSKCC; C. Q-PCR gene transcript quantification in 25 NBTs from Spanish institutions. Results were compared by
two-tailed independent-sample t test using SPSS v.14.0 for Windows (SPSS, Chicago, IL). Expression data are shown as box
plots (SPSS v.14.0).
Page 8 of 15
(page number not for citation purposes)
BMC Medical Genomics 2008, 1:36
/>
Table 2: Results of FISH, aCGH, Q-PCR analyses of chromosome 1, displayed in relation to NBTs ploidy status
Case
Number
Ploidy
MYCN
FISH Chromosome
1
a CGH Chr. 1
Q-PCR Gene copy No.
(fold change)
Disease
Status
Survival
Status
Cell % (#DNA probe
signals: LSI 1p36: LSI
1q25)
p
cen
q
GNB1
(1p36.33)
RERE (1p36.1)
G
L
G
-
G
-
1.6
0.8
3.2
1.1
NP
NP
A
A
G
G
G
G
G
G
1.5
2.6
1.4
1.4
2
2.4
1.3
3
NP
NP
NP
NP
A
A
A
A
1
2
near-3n
near-3n
NA
NA
3
4
5
6
near-3n
near-3n
near-3n
near-3n
NA
NA
NA
NA
n.e
50 (2:2), 20 (3:3), 15
(1:3), 15 (2:3)
60 (2:2), 40 (3:3)
5 (2:2), 95 (3:3)
40 (2:2), 60 (3:3)
50 (2:2), 50 (3:3)
7
8
9
10
11
near-2n
near-2n
near-2n
near-2n
near-2n
A
NA
NA
NA
NA
n.e.
n.e.
95 (2:2), 5 (3:3)
100 (2:2)
35 (2:2), 65 (1:3)
L
G
n.e
n.e
G
n.e
n.e
G
n.e
n.e
0.5
1.6
0.7
0.7
1
2.2
1.5
0.5
0.5
2.3
P
NP
NP
P
P
D
A
A
D
D
12
near-4n
A
-
-
G
0.5
0.6
P
D
13
near-4n
A
51 (1:2), 30 (2:2), 19
(1:3)
60 (2:2), 30 (3:3), 10
(4:4)
-
-
-
1.3
2.7
P
D
Thirteen representative cases drawn from the HSJD cohort analyzed by FISH, aCGH and Q-PCR of chromosome 1. n.e = not evaluable results.
MYCN amplification status: NA = not amplified, A = amplified. Disease status: NP = no disease progression, P = disease progression. Survival
status: A = alive, D = dead. FISH: results are displayed as percentage of cells exhibiting the observed number of DNA probe signals, and exact
number of signals for the DNA probes used: chromosome 1 (LSI 1p36 and LSI 1q25 DNA probes) and chromosome 17(LSI 17p13.1 and CEP 17
DNA probes). Array CGH: p and q = chromosome arms, cen. = centromeric; G = chromosome gain, L = chromosome loss. Q-PCR: gene copy
number fold changes are determined by the ΔΔCT relative quantification method.
Gain of chromosome 17 is one of the most frequent
genetic abnormalities observed in NBTs, and may involve
either the entire chromosome or partial gain of the distal
segment 17q21-qter [17]. Unbalanced translocations,
characteristic of near diploid NBTs or tumours with structural rather than numerical chromosome aberrations, are
thought to arise from DNA double strand breaks repaired
erroneously, suggesting an impaired DNA maintenance or
repair pathway [18]. On the other hand, abnormalities in
the mitotic segregation of chromosomes are thought to
underlie the numerical aberrations characteristic of neartriploid, good prognostic, NBTs. Both mechanisms define
the type of aneuploidy behind each of the subgroups of
NBTs, determining the kind of genetic aberrations as well
as the biological behaviour of each NBT subtype.
predominantly over the chromosomal regions 1p36p22.1 and 17p13-17q21. Besides, over 90% of these genes
displayed higher expression levels in near-triploid
tumours. Only two genes mapping to chromosome 17,
MAC30 and NME1, exhibited a higher expression level in
near-diploid/tetraploid NBTs. MAC30 gene encodes for a
meningioma-associated protein, highly expressed in several types of tumours, but, with unknown clinicopathological and biological significance. The product of the
NME1 gene, the nm23A protein, is a nucleoside diphosphate kinase, whose expression has been related to cell
proliferative activity [19]. Whereas reduced expression of
NME1 is associated with a high potential for metastasis in
some tumour types, like breast cancer and melanoma, its
expression is increased in aggressive NBTs [20].
Gene expression profiling of NBTs with different ploidy
status, near-triploid or near-diploid/tetraploid, enabled
us to identify distinct expression profiles associated with
each subgroup. Interestingly, a statistically significant proportion of genes shown to be differentially expressed
mapped to chromosomes described to be recurrently
altered in NBTs, chromosomes 1 and 17 [17]. Chromosomal region specificity was also observed for these differentially expressed genes since the majority spread
Genome array CGH, together with FISH and Q-PCR
results, confirmed the association of specific chromosomal abnormalities with each of the NBTs subgroups.
Therefore, it is not unreasonable to assume that these specific chromosomal alterations are associated with the
observed gene expression profiles. The highly significant
and strikingly persistent chromosomal localization of the
differentially expressed genes made us hypothesize about
which transcriptional regulation mechanisms can under-
Page 9 of 15
(page number not for citation purposes)
BMC Medical Genomics 2008, 1:36
/>
Table 3: Results of FISH, aCGH, Q-PCR analyses of chromosome 17, displayed in relation to NBTs ploidy status
Case
Number
Ploidy
MYCN
FISH Chromosome
17
a CGH Chr. 17
Q-PCR Gene copy No.
(fold change)
Cell % (# DNA probe
signals: LSI 17p13.1:
CEP 17)
p
cen
q
RUTBC1
(17p13.3)
NME1
(17q21)
Disease
Status
Survival
Status
1
2
3
4
5
6
near-3n
near-3n
near-3n
near-3n
near-3n
near-3n
NA
NA
NA
NA
NA
NA
n.e
45 (2:2), 55 (3:3)
45 (2:2), 55 (3:3)
30 (2:2), 70 (3:3)
50 (2:2), 50 (3:3)
50 (2:2), 50 (3:3)
G
G
G
G
G
G
G
G
G
G
G
G
G
G
G
G
G
G
2.3
1.5
1.3
3.6
1.6
1.4
2.5
1.5
1.4
2.2
1.3
1.5
NP
NP
NP
NP
NP
NP
A
A
A
A
A
A
7
near-2n
NA
n.e
n.e
n.e
0.7
1.4
NP
A
8
9
near-2n
near-2n
NA
A
-
-
G
0.8
1.1
0.7
1.4
P
P
D
D
10
11
near-2n
near-2n
NA
NA
5 (1:1), 80 (2:2), 10
(3:3), 5 (4:4)
33 (1:1), 66 (2:2)
7 (1:1), 7 (2:1), 60 (2:2),
20 (1:2), 6 (2:3)
80 (2:2), 15 (2:3), 5 (3:3)
28 (1:1); 11 (2:1), 56
(2:2), 5 (3:2)
n.e
n.e
G
n.e
1.2
1.1
1.5
0.9
NP
P
A
D
12
13
near-4n
near-4n
A
A
G
G
G
G
1
2.2
1.4
1.9
P
P
D
D
45 (2:2); 55 (3:3)
45 (2:2), 45 (3:3), 10
(4:4)
Thirteen representative cases drawn from the HSJD cohort analyzed by FISH, aCGH and Q-PCR of chromosome 17. n.e = not evaluable results.
MYCN amplification status: NA = not amplified, A = amplified. Disease status: NP = no disease progression, P = disease progression. Survival
status: A = alive, D = dead. FISH: results are displayed as percentage of cells exhibiting the observed number of DNA probe signals, and exact
number of signals for the DNA probes used: chromosome 1 (LSI 1p36 and LSI 1q25 DNA probes) and chromosome 17(LSI 17p13.1 and CEP 17
DNA probes). Array CGH: p and q = chromosome arms, cen. = centromeric; G = chromosome gain, L = chromosome loss. Q-PCR: gene copy
number fold changes are determined by the ΔΔCT relative quantification method.
lie these gene expression patterns. As a result of aneuploidy, cells possibly produce imbalanced expression of
large sets of genes that are amplified or lost. Such gross
imbalances would inevitably disrupt critical cellular circuits and destabilize regulatory pathways and cellular
structures. It has been assumed that gene dosage effects
may play a role in the pathogenesis of malignant diseases.
Variations of the transcriptome due to alterations of the
gene dosage have been described in vitro [21], in vivo [22]
and in human pathologies such as trisomies 13 and 21
[23]. In our hands, when comparing gene expression levels with gene copy number of a set of differentially
expressed genes located at chromosomes 1p36 and
17q13-q21, we observed a concordance between copy
number and mean expression values in all those analyzed
genes that displayed in the microarray analysis higher
expression levels in near-triploid NBTs. In contrast, NME1
gene, as from microarray results, showed low expression
values, close to the disomic reference sample expression,
in near-triploid NBTs, and high fold increase in mRNA
levels in near-diploid/tetraploid cases. NME1 gene has
been identified as one of the MYCN targets. Correlation
between MYCN overexpression and upregulation of
NME1 expression has been reported both in NBTs and
neuroblastoma cell lines [24]. In our experience, all
MYCN amplified NBTs, displaying MYCN overexpression,
as well as near-diploid cases with increased copy number
of chromosome 17q, showed high NME1 expression levels. However, NME1 overexpression was also observed in
2 near-diploid MYCN single copy cases, with low MYCN
expression and no 17q gain. This suggests that in NBTs
NME1 gene expression is only partly dependent on gene
copy number and MYCN expression, and therefore
implies the existence of other mechanisms of NME1 transcriptional regulation.
Recently, we reported that clonal ploidy heterogeneity is
present in virtually every single loco-regional, near-triploid NBT, and detected the existence of clonal DNA content heterogeneity and evolution [25,26]. In this report
our results underscore the clonal heterogeneity of all
NBTs, with a marked complexity in the near-diploid/tetraploid tumours. Furthermore, clonal variations reflected in
the array CGH plots as copy-number alterations with varying log2 values, could unveil the presence of subpopulations emerged during tumour development. These cellular
subpopulations are likely to be the cause of the high cell
heterogeneity also observed in the FISH analyses. These
Page 10 of 15
(page number not for citation purposes)
BMC Medical Genomics 2008, 1:36
/>
Figure 3 between DNA copy number and gene expression levels analyses
Comparison
Comparison between DNA copy number and gene expression levels analyses. Gene expression levels and gene
copy number are exhibited as mean values in accordance with NBT ploidy subgroups. Correlation between DNA gene copy
number and expression levels was observed in those analyzed genes that displayed in the microarray analysis higher expression
levels in near-triploid NBTs.
findings are important in emphasizing the cellular heterogeneity and karyotypic complexity (aneuploidy) generally associated with malignant tumours, but need a more
detailed understanding of their significance.
Conclusion
We have found that NBTs with different cellular DNA content display specific transcriptional profiles suggesting
that near-diploid/tetraploid and near-triploid NBTs result
from two different mechanisms of aneuploidy driving
tumourigenesis. A large number of the differentially
expressed genes participate in cell differentiation pathways and map to specific chromosomal regions recurrently involved in unbalanced translocations, gains and
losses in NBTs. Our results demonstrate that these specific
genetic abnormalities are complex, heterogeneous, and
translate into a gene expression profile that defines the
biological behaviour of each type of NBT.
Abbreviations
NBTs: neuroblastic tumours; MIBG: Meta-iodobenzylguanidine; LOH: loss of heterozygosity; MSKCC: Memorial
Sloan-Kettering Cancer Center, New York; HSJD: Hospital
Sant Joan de Déu, Barcelona; Children's Oncology Group:
COG; CT: computed tomography; INSS: International
Neuroblastoma Staging System; INPC: International NB
pathology committee; CNS: central nervous system; QPCR: Quantitative real-time polymerase chain reaction;
aCGH: array-Comparative Genomic Hybridization; FISH:
Fluorescence in situ hybridization.
Competing interests
The authors declare that they have no competing interests.
Authors' contributions
CL and JM are responsible for the initial conception and
overall hypothesis of this study. CL, IG and JM are respon-
Page 11 of 15
(page number not for citation purposes)
BMC Medical Genomics 2008, 1:36
/>
Table 4: Chromosome 17 Fluorescence in situ Hybridization results of 40 NBTs obtained from MSKCC, displayed in relation to NBTs
ploidy status
Case Number
Ploidy
MYCN
FISH Chromosome 17
Disease Status
Survival Status
Cell % (# DNA probe signals: LSI 17p13.1: CEP 17)
1
2
3
4
5
6
7
8
9
10
11
12
13
14
15
near-3n
near-3n
near-3n
near-3n
near-3n
near-3n
near-3n
near-3n
near-3n
near-3n
near-3n
near-3n
near-3n
near-3n
near-3n
NA
NA
NA
NA
NA
NA
NA
NA
NA
NA
NA
NA
NA
NA
NA
23 (2:2), 44 (3:3), 33 (4:4)
50 (2:2), 50 (3:3)
16 (2:2), 41 (3:3), 43 (4:4)
34 (2:2), 42 (3:3), 24 (4:4)
33 (2:2), 50 (3:3), 17 (4:4)
25 (2:2), 60 (3:3), 15 (4:4)
31 (2:2), 46 (3:3), 23 (4:4)
35 (2:2), 52 (3:3), 13 (4:4)
23 (2:2), 54 (3:3), 23 (4:4)
13 (3:3), 66 (3:4), 21 (5:5)
16 (2:2), 48 (3:3), 36 (4:4)
35 (2:2), 58 (3:3), 7 (4:4)
46 (2:2), 24 (3:3), 30 (4:4)
22 (3:3), 62 (4:4), 16 (4:5)
10 (2:2), 29 (3:3), 45 (4:4), 16 (5:5)
NP
NP
NP
NP
P
NP
NP
NP
NP
NP
P
NP
NP
P
P
A
A
A
A
A
A
A
A
A
A
A
A
A
D
D
16
17
18
19
20
21
22
23
24
25
26
27
28
29
30
31
32
33
34
35
36
37
near-2n
near-2n
near-2n
near-2n
near-2n
near-2n
near-2n
near-2n
near-2n
near-2n
near-2n
near-2n
near-2n
near-2n
near-2n
near-2n
near-2n
near-2n
near-2n
near-2n
near-2n
near-2n
NA
NA
NA
NA
NA
NA
NA
NA
NA
NA
NA
NA
NA
NA
NA
A
A
A
A
A
A
A
5 (1:1), 65 (2:2), 5 (1:2), 10 (3:3), 5 (2:3), 5 (4:4), 5 (3:4)
100 (2:2)
95 (2:2), 5 (3:3)
31 (CEP 2), 50 (CEP 3), 18 (CEP 4)
25 (1:1), 75 (2:2)
100 (2:2)
n.e
10 (CEP 1), 40 (CEP 2), 38 (CEP 3), 12 (CEP 4)
80 (2:2), 10 (1:2), 5 (3:3), 5 (2:2)
100 (2:2)
25 (1:1), 75 (2:2)
100 (2:2)
5 (2:1), 74 (2:2), 5 (1:2), 5 (3:3), 6 (2:3), 5 (4:4)
10 (2:1), 70 (2:2), 15 (1:2), 5 (3:3)
n.e
20 (2:2), 32 (3:3), 12 (4:3), 20 (4:4), 16 (3:4)
40 (1:1), 60 (2:2)
n.e
100 (2:2)
35 (2:2); 5 (3:2), 20 (3:3), 5 (2:3), 30 (4:4), 5 (3:4)
60 (2:2); 5 (3:2), 25 (3:3), 5 (4:3), 5 (4:4)
10 (1:1), 90 (2:2)
P
P
P
NP
P
P
P
P
P
P
P
P
P
P
P
NP
NP
NP
P
P
P
P
D
D
D
A
D
D
D
A
A
D
D
D
D
D
D
A
A
A
A
D
D
D
38
39
40
near-4n
near-4n
near-4n
NA
NA
NA
29 (2:2), 6 (3:3), 8 (4:3), 37 (4:4), 20 (3:4)
49 (2:2), 37 (3:3), 9 (2:3), 5 (3:4)
6 (2:2), 20 (3:3), 5 (4:3), 46 (4:4), 18 (5:5), 5 (4:5)
NP
NP
P
A
A
A
n.e = not evaluable results. MYCN amplification status: NA = not amplified, A = amplified. Disease status: NP = no disease progression, P =
disease progression. Survival status: A = alive, D = dead. FISH: results are displayed as percentage of cells exhibiting the observed number of DNA
probe signals, and exact number of signals for the DNA probes used: chromosome 1 (LSI 1p36 and LSI 1q25 DNA probes) and chromosome 17(LSI
17p13.1 and CEP 17 DNA probes). Array CGH: p and q = chromosome arms, cen. = centromeric; G = chromosome gain, L = chromosome loss.
Q-PCR: gene copy number fold changes are determined by the ΔΔCT relative quantification method.
sible for the design of this manuscript, including the original draft and subsequent revisions and design of this
manuscript. CdT assisted with the initial concept and was
involved with the draft and revisions of this manuscript;
provided guidance for many of the experiments. NKC and
WLG are responsible for the procurement and cryopreser-
vation of NBT tissue specimens derived from MSKCC. ER,
IG, SA, HB and JM were responsible for the procurement
and cryopreservation of NBT tissue specimens derived
from the Spanish institutions. WLG and NP evaluated all
tumour specimens for tumour staging classification and
to assess tumour content. CL, NKC, WLG, and JM are
Page 12 of 15
(page number not for citation purposes)
BMC Medical Genomics 2008, 1:36
/>
Figure
FISH
analysis
4
FISH analysis. Intra-tumoural cell heterogeneity, cancer cells exhibit different alterations of chromosome 17.
FISH analysis using probes for chromosome 17 (red, LSI p53; green, CEP 17) showing different cellular populations within the
same NBT in terms of probe signal numbers. In the panels are reported two representative NBT cases; A. near-triploid NBT;
B. near-diploid case. Five signal cells in this sample were very rare populations (< 5%) and are not displayed in Table 3.
responsible for patient clinico-biological database management and for microarrays studies. NKC and WLG were
involved in the drafting and revision of this manuscript.
IG and CL are responsible for the quantitative PCR experiments. CM and EdA are responsible for the FISH and
aCGH analyses and were also involved with the interpretation of data, draft and revision of this manuscript. ET
performed the flow cytometry DNA analysis. CL, GD, JR
and IG performed the statistical analysis and interpreta-
tion of the data derived from all the samples. HB and SA
assisted with valuable technical assistance for experiments
associated with this manuscript. All were also involved in
the drafting and revisions for this manuscript. All authors
read and approved the final manuscript.
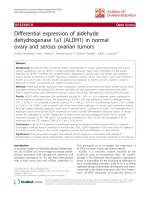
Figure 5
Array-Comparative
Genomic Hybridization (aCGH) results of 13 NBTs obtained from HSJD
Array-Comparative Genomic Hybridization (aCGH) results of 13 NBTs obtained from HSJD. Results are displayed according to tumour ploidy status. Chromosome alterations are visualized as a graded colour code adjusted to the log2
rank of each individual plot assigned to define chromosomal segment alterations. Filled boxes: from orange to pink colour
shades represent increasing chromosomal copy number gains, whereas, from light blue to dark blue colour shades indicate
chromosome losses. White colour boxes represent no detected chromosome change. Grey colour boxes represent not evaluable results.
Page 13 of 15
(page number not for citation purposes)
BMC Medical Genomics 2008, 1:36
Additional material
Additional file 1
Quantitative Real-time Polymerase Chain Reaction Analysis. List of genes
analyzed to determine expression levels and DNA copy number of genes
located on chromosomes 1 and 17.
Click here for file
[ />
/>
Madrid, for kindly providing annotated samples, and T. Hernández (Centro
de Investigación del Cáncer-IBMCC, Salamanca) for FISH hybridizations.
Dr. J. San Miguel (Centro de Investigación del Cáncer-IBMCC, Salamanca)
for kindly providing the BAC/PAC isolated DNA and Dr. JC Cigudosa
(Centro Nacional de Investigaciones Oncológicas, Spain) for providing
enriched medium-coverage set.
References
1.
2.
Additional file 2
Gene expression profiling of NBTs with different ploidy status. List of differentially expressed genes identified applying different multiple testing
corrections. Differentially expressed genes are displayed according to
tumour ploidy and chromosomal location. A. List of 6 differentially
expressed genes [FDR P < 0,01]; B. List of 12 differentially expressed
genes [SDP P < 0,1]; C. List of 51 differentially expressed genes [FDR P
< 0,05];.D. List of 254 differentially expressed genes [FDR P < 0,1].
Click here for file
[ />
3.
4.
5.
6.
Additional file 3
Quantitative Real-time Polymerase Chain Reaction gene copy number
analysis and array CGH analysis results. n.e = not evaluable results; n.d.
= not done. MYCN amplification status: NA = not amplified, A = amplified. Disease status: NP = no disease progression, P = disease progression.
Survival status: A = alive, D = dead. Q-PCR: gene copy number fold
changes are determined by the ΔΔCT relative quantification method.
Array CGH: p and q = chromosome arms, cen. = centromeric; G = chromosome gain, L = chromosome loss; - = no alteration observed.
Click here for file
[ />
7.
8.
9.
10.
11.
Additional file 4
Array CGH images of NBT with different DNA content. A. Near-triploid
NBT; B. Near-diploid tumour and C. Near-tetraploid NBT.
Click here for file
[ />
Acknowledgements
This work was supported by: Career Development Award 2001 (to J. M.)
from the American Society of Clinical Oncology (ASCO) and grants from
the Spanish Ministry of Health (Instituto de Salud Carlos III, Fondo de Investigación Sanitaria, 2007; PI070286) (CL) and Spanish Society against Cancer
(Asociación Espola Contra el Cáncer, 2007) (JM and CL). The Developmental tumour biology laboratory, Hospital Sant Joan de Déu in Barcelona,
is additionally supported by the Catalan government (AGAUR, Generalitat
de Catalunya, 2005SGR00605; 2006FI00404), and the donation from Margarita del Pozo Fund. Supported in part by the National Cancer Institute
grant CA106450 (NKC and WG), The Robert Steel Foundation (NKC),
Hope Street Kids (NKC), and Katie's Find A Cure Fund (NKC) and the
Government of Castilla y León (EdA).
We would like to thank Dr. R. Noguera, Department of Pathology, University of Valencia; and Dr. J. Alonso and Dr. P. García Miguel, Hospital La Paz,
12.
13.
14.
15.
16.
17.
18.
Brodeur GM, Sawada T, Tsuchida Y, Voûte PA: Neuroblastoma.
Amsterdam: Elsevier Science; 2000.
Mora J, Gerald WL, Qin J, Cheung VNK: Evolving significance of
prognostic markers associated with treatment improvement in patients with stage 4 neuroblastoma. Cancer 2002,
94:2756-65.
Look AT, Hayes FA, Shuster JJ, Douglass EC, Castleberry RP, Bowman LC, Smith EI, Brodeur GM: Clinical relevance of tumour cell
ploidy and N-myc gene amplification in childhood neuroblastoma. J Clin Oncol 1991, 9:581-91.
Brodeur GM, Seeger RC, Schwab M, Varmus HE, Bishop JM: Amplification of N-myc in untreated human neuroblastomas correlates with advanced disease stages. Science 1984, 224:1121-4.
Kaneko Y, Cohn SL: Ploidy and cytogenetics of neuroblastoma.
In Neuroblastoma Edited by: Brodeur GM, Sawada T, Tsuchida Y,
Voûte PA. Amsterdam: Elsevier Science; 2000:41-56.
Pui CH, Raimondi SC, Dodge RK, Rivera GK, Fuchs LA, Abromowitch
M, Look AT, Furman WL, Crist WM, Williams DL: Prognostic
importance of structural chromosomal abnormalities in children with hyperdiploid (> 50 chromosomes) acute lymphoblastic leukaemia. Blood 1989, 73:1963-67.
Kilpatrick SE, Teot LA, Geisinger KR, Martin PL, Shumate DK, Zbieranski N, Russell GB, Fletcher CD: Relationship of DNA ploidy to
histology and prognosis in rhabdomyosarcoma. Cancer 1994,
74:3227-33.
Hedley DW: Flow cytometry using paraffin-embedded tissue:
five years on. Cytometry 1989, 10:229-241.
Mora J, Gerald WL, Cheung NK: Evolving significance of prognostic markers associated with new treatment strategies in
neuroblastoma. Cancer Lett 2003, 197:119-124.
Westfall PH, Young SS: Resampling-based Multiple Testing:
Examples and Methods for p-value Adjustment. New York:
John Wiley & Sons Inc; 1993.
Benjamini Y, Hochberg Y: Controlling the False Discovery Rate:
a Practical and Powerful Approach to Multiple Testing. Journal of the Royal Statistical Society B 1995, 57:289-300.
Vandesompele J, De Preter K, Pattyn F, Poppe B, Van Roy N, De
Paepe A, Speleman F: Accurate normalization of real-time
quantitative RT-PCR data by geometric averaging of multiple internal control genes.
Genome Biology 2002,
3(7):research0034.1-0034.11.
Fischer M, Skowron M, Berthold F: Reliable transcript quantification by real-time transcriptase-polymerase chain reaction in
primary neuroblastoma using normalization to averaged
expression levels of the control genes HPRT1 and SDHA.
Journal of Molecular Diagnostics 2005, 7(1):89-96.
De Preter K, Speleman F, Combaret V, Lunec J, Laureys G, Eussen B,
Francotte N, Board J, Pearson A, De Paepe A, Van Roy N, Vandesompele J: Quantification of MYCN, DDX1, and NAG gene copy
number in neuroblastoma using a real-time quantitative
PCR assay. Modern Pathology 2002, 15(2):159-166.
Ladenstein R, Ambros IM, Pötschger U, Amann G, Urban C, Fink FM,
Schmitt K, Jones R, Slociak M, Schilling F, Ritter J, Berthold F, Gadner
H, Ambros PF: Prognostic significance of DNA di-tetraploidy
in neuroblastoma. Medical Pediatric Oncology 2001, 36(1):83-92.
Spitz R, Betts DR, Simon T, Boensch M, Oestreich J, Niggli FK, Ernestus K, Berthold F, Hero B: Favorable outcome of triploid neuroblastomas: a contribution to the special oncogenesis of
neuroblastoma. Cancer Genetics and Cytogenetics 2006, 167:51-56.
Plantaz D, Mohapatra G, Matthay KK, Pellarin M, Seeger RC, Feuerstein BG: Gain of chromosome 17 is the most frequent abnormality detected in neuroblastoma by comparative genomic
hybridization. Am J Pathol 1997, 150:81-9.
Janoueix-Lerosey I, Hupé P, Maciorowski Z, La Rosa P, Schleiermacher G, Pierron G, Liva S, Barillot E, Delattre O: Preferential
Page 14 of 15
(page number not for citation purposes)
BMC Medical Genomics 2008, 1:36
19.
20.
21.
22.
23.
24.
25.
26.
/>
occurrence of chromosome breakpoints within early replicating regions in neuroblastoma. Cell Cycle 2005, 4(12):1842-6.
Keim D, Hailat N, Melhem R, Zhu XX, Lascu I, Veron M, Strahler J,
Hanash SM: Proliferation-related expression of p19/nm23
nucleoside diphosphate kinase. J Clin Invest 1992, 89:919-24.
Valentijn LJ, Koppen A, van Asperen R, Root HA, Haneveld F, Versteeg R: Inhibition of a new differentiation pathway in neuroblastoma by copy number defects of N-myc, Cdc42, and nm23
genes. Cancer Res 2005, 65:3136-45.
Kahlem P, Sultan M, Herwig R, Steinfath M, Balzereit D, Eppens B,
Saran NG, Pletcher MT, South ST, Stetten G, Lehrach H, Reeves RH,
Yaspo ML: Transcript level alterations reflect gene dosage
effects across multiple tissues in a mouse model of down syndrome. Genome Res 2004, 14:1258-67.
FitzPatrick DR, Ramsay J, McGill NI, Shade M, Carothers AD, Hastie
ND: Transcriptome analysis of human autosomal trisomy.
Hum Mol Genet 2002, 11:3249-56.
Jones PA, Laird PW: Cancer epigenetics comes of age. Nat Genet
1999, 21:163-167.
Godfried MB, Veenstra M, v Sluis P, Boon K, v Asperen R, Hermus
MC, v Schaik BD, Voûte TP, Schwab M, Versteeg R, Caron HN: The
N-myc and c-myc downstream pathways include the chromosome 17q genes nm23-H1 and nm23-H2. Oncogene 2002,
21:2097-2101.
Mora J, Cheung NKV, Gerald WL: Genetic heterogeneity and
clonal evolution in neuroblastoma.
Br J Cancer 2001,
85:182-189.
Mora J, Lavarino C, Alaminos M, Cheung NK, Ríos J, de Torres C, Illei
P, Juan G, Gerald WL: Comprehensive analysis of tumoural
DNA content reveals clonal ploidy heterogeneity as a
marker with prognostic significance in locoregional neuroblastoma. Genes, Chromosomes and Cancer 2007, 46:385-396.
Pre-publication history
The pre-publication history for this paper can be accessed
here:
/>
Publish with Bio Med Central and every
scientist can read your work free of charge
"BioMed Central will be the most significant development for
disseminating the results of biomedical researc h in our lifetime."
Sir Paul Nurse, Cancer Research UK
Your research papers will be:
available free of charge to the entire biomedical community
peer reviewed and published immediately upon acceptance
cited in PubMed and archived on PubMed Central
yours — you keep the copyright
BioMedcentral
Submit your manuscript here:
/>
Page 15 of 15
(page number not for citation purposes)