cd44 expression positively correlates with foxp3 expression and suppressive function of cd4 treg cells
Bạn đang xem bản rút gọn của tài liệu. Xem và tải ngay bản đầy đủ của tài liệu tại đây (634.66 KB, 13 trang )
Biology Direct
BioMed Central
Open Access
Research
CD44 expression positively correlates with Foxp3 expression and
suppressive function of CD4+ Treg cells
Tie Liu†1, Lynn Soong†1, Gang Liu2, Rolf König1 and Ashok K Chopra*1
Address: 1Department of Microbiology and Immunology, University of Texas Medical Branch, Galveston, TX, USA and 2Department of Medicine,
Feinberg School of Medicine, Northwestern University, Chicago, IL, USA
Email: Tie Liu - ; Lynn Soong - ; Gang Liu - ; Rolf König - ;
Ashok K Chopra* -
* Corresponding author †Equal contributors
Published: 23 October 2009
Biology Direct 2009, 4:40
doi:10.1186/1745-6150-4-40
Received: 8 April 2009
Accepted: 23 October 2009
This article is available from: />© 2009 Liu et al; licensee BioMed Central Ltd.
This is an Open Access article distributed under the terms of the Creative Commons Attribution License ( />which permits unrestricted use, distribution, and reproduction in any medium, provided the original work is properly cited.
Abstract
Background: CD4+CD25+ regulatory T (Treg) cells develop in the thymus and can suppress T cell
proliferation, modulated by Foxp3 and cytokines; however, the relevance of CD44 in Treg cell
development is less clear. To address this issue, we analyzed Foxp3 expression in CD44+ Treg cells
by using multiple parameters, measured the levels of the immunoregulatory cytokine interleukin
(IL)-10 in various thymocyte subsets, and determined the suppressor activity in different splenic
Treg cell populations.
Results: Within mouse thymocytes, we detected Treg cells with two novel phenotypes, namely the
CD4+CD8-CD25+CD44+ and CD4+CD8-CD25+CD44- staining features. Additional multiparameter analyses at the single-cell and molecular levels suggested to us that CD44 expression
positively correlated with Foxp3 expression in thymocytes, the production of IL-10, and Treg
activity in splenic CD4+CD25+ T cells. This suppressive effect of Treg cells on T cell proliferation
could be blocked by using anti-IL-10 neutralizing antibodies. In addition, CD4+CD25+CD44+ Treg
cells expressed higher levels of IL-10 and were more potent in suppressing effector T cell
proliferation than were CD4+CD25+CD44- cells.
Conclusion: This study indicates the presence of two novel phenotypes of Treg cells in the thymus,
the functional relevance of CD44 in defining Treg cell subsets, and the role of both IL-10 and Foxp3
in modulating the function of Treg cells.
Reviewers: This article was reviewed by Dr. M. Lenardo, Dr. L. Klein & G. Wirnsberger
(nominated by Dr. JC Zungia-Pfluker), and Dr. E.M. Shevach.
Background
Treg cells are important in the control of self-reactive T
cells, contributing to the maintenance of immunological
self-tolerance [1]. Treg cells develop in the thymus through
a process involving the recognition of self-peptides presented by major histocompatibility complex (MHC) molecules and driven by high-affinity interactions between
the T cell receptor (TCR) on developing thymocytes and
self peptide-MHC complexes on thymic epithelial cells [25]. Forkhead box P3 (Foxp3), an X-chromosome-linked
factor that controls Treg cell development and function, is
generally thought to also control positively the functions
of Treg cells in a binary fashion, as Foxp3 expression is sufficient to specify immune-suppressive activities in conPage 1 of 13
(page number not for citation purposes)
Biology Direct 2009, 4:40
ventional T cells [6]. Although Foxp3 is considered as a
specific marker for the Treg cell lineage [7,8], its expression
pattern during thymocyte development remains less clear.
Treg-mediated suppression is cell contact dependent [9],
but the immunosuppressive cytokines transforming
growth factor (TGF)-β and IL-10 also play an important
role [10-12]. The collective activity of TGF-β and IL-10
ensures a controlled inflammatory response specifically
targeting pathogens without evoking excessive immunopathology to self-tissues [13]. IL-10 is a cytokine which
is an essential molecule in the mechanism underlying
suppression mediated by Treg cells. It has anti-inflammatory activity and indirectly suppresses cytokine production and proliferation of antigen-specific CD4+ T effector
cells. IL-10 is produced by subsets of CD4+ cells with regulatory function [14]. More specifically, it has been shown
that IL-10 produced by Treg cells is essential for in vivo suppression, as IL-10-deficient Treg cells can not regulate T cell
induced colitis [15,16]. TGF-β and IL-10 are potent mediators of immune suppression, and Treg cells can not only
use TGF-β and IL-10 to perform their immunosuppression function, but also to educate other CD4+CD25-cells
to become Treg cells [12].
The adhesion molecule CD44 (synonymous with Pgp1,
HUTCH-1, or ECM-III) is the principal receptor for
hyaluronic acid. Multiple functions and cellular responses
have been attributed to the activation of CD44, including
the induction of cell motility, activation of cell survival
responses, and promotion of cell adhesion [17]. Although
CD44 has a wide tissue distribution, its expression during
a particular stage or in a subset of thymocyte progenitors
suggests a functional involvement of CD44 in homing
and thymic colonization of precursor cells [18]. Although
differential expression levels of CD44 among different
subsets of thymocytes have been reported [19], its biological relevance in T cell differentiation is unclear.
In this study, we used naïve C57BL/6 mice and performed
six-color flow cytometry and real-time reverse transcriptase (RT)-polymerase chain reaction (PCR) analyses,
as well as in vitro T cell suppression assays. We present
herein the following key findings: 1) the surface expression of CD44 in mouse thymocytes positively correlated
with that of Foxp3; 2) CD4+CD25+CD44+ Treg cells
expressed higher levels of IL-10 and were more potent in
suppressing effector T cell proliferation than were
CD4+CD25+CD44- cells; and 3) blocking IL-10 aborogated suppressive mechanisms of CD4 Treg cells. Our data
suggest that Treg cells could be further divided into three
subsets based on CD44 expression levels, with
CD4+CD25+CD44high cells displaying the highest levels of
IL-10 production and having regulatory functions.
/>
Methods
Mice
Female C57BL/6 mice (Taconic Farms, Germantown, NY)
were maintained under specific pathogen-free conditions,
and used for experimentation at 4 to 6 weeks of age,
according to protocols approved by the UTMB Institutional Animal Care and Use Committee and NIH guidelines.
Flow cytometric analysis
Thymocytes and splenocytes were obtained from naïve
mice and suspended in phosphate-buffered saline (PBS)
and 1% fetal calf serum (FCS). To avert non-specific binding to mouse Fcγ receptors, cells were blocked with mouse
CD16/CD32 mAb (0.25 μg/100 μl) (BD Biosciences,
Franklin Lakes, NJ) for 15 min. After washing, cells were
stained for the expression of CD4 (PE-Cy7, clone RM 4-5),
CD8α (FITC, clone 53-6.7), CD44 (PE, clone 1M7), CD25
(APC-Alexa Fluor755, clone PC-61.5), or TCR-β (PerCp,
clone H57-597) at 4°C for 60 min. In some cases, the surface-stained cells were fixed/permeabilized with a
Cytofix/Cytoperm kit (BD Biosciences) and then stained
with Foxp3 (PE-Cy5, clone FJK-16s) or IL-10 (PerCP,
clone JESS-16E3) at 4°C for 45 min. The corresponding
isotype controls (rat IgG1, IgG2a, and IgG2b) were purchased from eBioscience (San Diego, CA) and BD Bioscience, respectively. Cells were analyzed using a FACScan
(BD Biosciences) and BD FACSDiva software (BD Biosciences).
Isolation of CD4+ T subsets
Splenocytes were collected from C57BL/6 mice, treated
with RBC lysis buffer (Sigma, St. Louis, MO), and T cells
were enriched by passage through nylon-wool columns
and subsequently purified. Briefly, splenocytes (108) were
incubated in the column at 37°C in the presence of 5%
CO2 for 1 h before eluting the cells with RPMI medium.
Cells were then stained for the surface expression of CD4,
CD8, CD44, and CD25 by incubating with the appropriate antibodies at 4°C for 60 min. After washing, the following subsets of CD4+ T cells were isolated by using a
FACSAria
(BD
Biosciences):
CD4+CD25+CD44+,
CD4+CD25+CD44high,
CD4+CD25+CD44-,
CD4+CD25+CD44med, and CD4+CD25+CD44low cells.
Purified T cell subsets were immediately used for subsequent analyses.
RT-PCR and real-time RT-PCR
Total RNA was extracted from purified T cell subsets. The
first-strand cDNA was synthesized from 2 μg of RNA using
reverse transcriptase (SuperScript III, Invitrogen). An aliquot of first-strand cDNA was amplified by Ampli-Taq (Perkin-Elmer Cetus, Norwalk, CT) in a total volume of 50 μl
reaction buffer consisting of 10 mM Tris-HCl (pH 8.3), 50
mM KCl, 1.5 mM MgCl2, 0.001% gelatin, and 0.2 mM
Page 2 of 13
(page number not for citation purposes)
Biology Direct 2009, 4:40
deoxynucleoside triphosphate. The primers for RT-PCR
were: IL-10 forward 5'-CAGACTCTTAAACACCGAGCCG3', reverse 5'-GACTTAGCAAGACACGATGCGA-3'; and βactin forward 5'-TGGAATCCTGTGGCATCCATGAAAC-3',
reverse 5'-TAAAACGCAGCTCAGTAACAGTCCG-3'. The
PCR reaction included one cycle of initial amplification
(at 94°C for 5 min, 56°C for 3 min, 72°C for 2 min), followed by 22 to 32 cycles at 94°C for 1 min, annealing at
56°C for 1 min, and extension at 72°C for 0.5 min. The
final extension reaction was prolonged to 10 min at 72°C.
After amplification, PCR products were separated by electrophoresis through 1-2% agarose gels.
Quantitative RT-PCR was performed at the Real-Time PCR
Core Facility, Sealy Center for Cancer Cell Biology, UTMB.
We used Applied Biosystems (Foster City, CA) assay-bydesign and assay-on-demand 20× assay mixes of primers
and TaqMan MGB probes (FAM™ dye-labeled) for our target genes (IL-10) and a pre-developed 18S rRNA (VIC™dye labled probe) TaqMan® assay reagent for an endogenous control. Real-time RT-PCR was performed with 40
ng cDNA, using a universal PCR master mix reagent kit
(Applied Biosystems) and the following cycling parameters: Uracil-N-glycosylase (UNG) activation at 50°C for 2
min, AmpliTaq activation at 95°C for 10 min, denaturation at 95°C for 15 sec and annealing/extension at 60°C
for 1 min (repeat 40 times) on ABI7000. Duplicate CT values were analyzed via an in Microsoft Excel program using
the comparative CT (ΔΔCT) method, as described by the
manufacturer (Applied Biosystems). The amount of target
(2-ΔΔCT) was obtained and normalized to the endogenous
reference (18s) and relative to a calibrator (one of the
experimental samples).
In vitro T cell suppression assay
Splenic T cells were prepared by passing splenocytes
through nylon-wool columns (108 splenocytes were incubated in the column at 37°C in the presence of 5% CO2
for 1 h before eluting the cells with RPMI medium). Effector T cells were pre-cultured with Concanavalin A (Con A,
20 μg/ml) for 2 h, washed, and then seeded in 96-well Ubottom microtiter plates (2 × 10⁵/well), to which Treg cells
were added at Treg-to-effector cells in a ratio of 1:2. After
cultivation in the presence of Con A (2 μg/ml) for 72 h,
cells were pulsed with [3H]-thymidine for the last 10 h,
and incorporation of radioactivity was measured by liquid
scintillation counting in triplicate. Data were expressed as
the arithmetic means ± standard deviation (S.D.).
To assess the involvement of IL-10 in reversing T cell suppression, we sorted CD4+ CD25- and CD4+ CD25+ CD44+
(or CD4+CD25+ CD44-) cells via FACS. T cells (in RPMI
medium) were incubated alone or co-cultured with Treg
cells at a 2:1 ratio with 1 μg/ml plate-bound anti-CD3
(145.2C11, BD Bioscience) in 96-well U-bottom plates. In
/>
some cases, blocking anti IL-10 antibodies (1B1.3a, 100
ng/ml, BD Bioscience) or rat IgG1 isotype control (R3-34,
100 ng/ml, BD Bioscience) were added, and the above
mixture of cells were incubated at 37°C in the presence of
5% CO2 for 72 h. Subsequently, cells were pulsed with
[3H]-thymidine for the last 10 h, and incorporation of
radioactivity was measured by liquid scintillation counting in triplicate. Data were expressed as the arithmetic
means ± S.D.
Statistical analysis
At least three independent experiments were performed,
and the difference between two groups was determined
using Student's t-test. One- or two-way ANOVA was used
for multiple group comparisons (GraphPad Software v
4.0, San Diego, CA). Statistically significant values were
referred to as follows: *, p < 0.05; **, p < 0.01; ***, p <
0.001.
Results
Detection of CD4+CD8-CD25+CD44- and CD4+CD8CD25+CD44+ T cells in the thymus
CD4+CD25+ cells are members of a unique lineage of T
cells that are selected during the process of T cell development in the thymus; however, the location and sequence
of Treg cell development remain unclear [20-22]. To
address this issue, we first examined the profile of thymocytes in naïve mice using multi-color flow cytometry for
the simultaneous detection of CD4, CD8, CD25, and
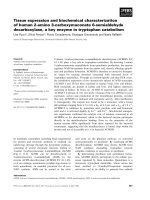
CD44 cells. As shwon in Figure 1A, live thymocytes were
gated as P1, and these thymocytes were subsequently
divided into four populations based on CD44 and CD8
expression (identified by quadrants Q1-Q4), yielding the
CD4+CD8-CD25+CD44- population from Q3 and the
CD4+CD8-CD25+CD44+ population from Q4. These populations of CD4+CD8-CD25+CD44- and CD4+CD8CD25+CD44+ single positive (SP) cells were comprised of
only 0.4% and 0.8% of total thymocytes, respectively (Figure 1B). Furthermore, Foxp3 expression was detacted in
63% of CD4+CD8-CD25+CD44+ cells and 26% of
CD4+CD8-CD25+CD44- cells (Figure 1C). These staining
and gating approaches allowed us to detect 16 distinct
subsets of cells.
TCR-β expression in subsets of Treg cells in the thymus
Since a productive TCR-β gene rearrangement is a critical
event in thymocyte development and proliferation
[23,24], we then examined TCR-β expression in different
subsets of thymocytes. For Figure 2A, total live thymocytes
(P1) were gated, as described for Figure 1. Based on
expression of CD4 and CD8, we defined subpopulations
of CD4-CD8- as P4, CD4+CD8+ as P3, and CD4+CD8- cells
as P5, respectively. Each of these subpopulations was further analyzed for expression of CD25 and CD44. Finally,
for each of the resulting nine subpopulations, we meas-
Page 3 of 13
(page number not for citation purposes)
Biology Direct 2009, 4:40
/>
A
Q2
SSC
P1
CD8
Q1
P2
P3
P4
P5
CD44
FSC
Q4
CD44
B
C
CD4+CD8-CD25+CD44-
CD4+CD8-CD25+CD44-
0.4
26
CD4+CD8-CD25+CD44+
CD4+CD8-CD25+CD44+
0.8
CD25
Foxp3
63
CD4
+ CD44
- T +cells
- the thymus
+ CD44+ and CD4 + CD8Figure
Detection
CD25
1 of CD4
reg CD8inCD25
Detection of CD4+ CD8- CD25+ CD44+ and CD4 +
CD8- CD25+ CD44- Treg cells in the thymus. (A) Cell
gating strategy and staining patterns. Thymocytes were
obtained from naïve C57BL/6 mice and stained with specific
antibodies against CD4 (Cy7-PE), CD8 (FITC), CD44 (PE),
and CD25 (APC-Alexa Fluor755). Cells in P1 were gated as
live thymocytes. (B) Based on CD44 and CD8 expression,
CD4+CD8-CD25+CD44+ and CD4+CD8-CD25+CD44- cells
were defined. (C) Foxp3 expression in CD4+CD8CD25+CD44+ and CD4+CD8-CD25+CD44- cells. The data
are shown as the percentage of total, live thymocytes (population P1) in each cell subset, and are presented as mean ±
S.D. from four independent experiments.
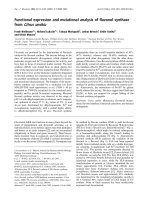
ured TCR-β expression. We observed that CD4+CD8CD25+CD44+ cells contained a higher percentage of TCRβ+ cells than did CD4+CD8-CD25+CD44- cells (Figure 2B).
To further define the role of CD44 expression in the development of CD4+CD25+ cells, we subdivided CD4+CD8CD25+CD44+ SP cells into CD4+CD8-CD25+CD44low,
and
CD4+CD8CD4+CD8-CD25+CD44med,
+
high
CD25 CD44
cells (Figure 2A). We then analyzed the
percentage of TCR-β-expressing cells in each subpopulation (Figure 2C). Among CD4+CD8-CD25+cells, the
B
**
100
80
60
40
20
0
+
CD4+CD25+CD44 cells
C
**
TCR -positive cells (%)
Q2
CD8
Q1
CD4
low med high
CD4
Q3
P1
TCR -positive cells (%)
SSC
FSC
+
CD25
A
*
100
*
80
60
40
20
0
Low
med
high
CD44 levels in CD4+CD25+ cells
Figure
mouse
2
TCR-β thymus
expression
on CD4+ CD8- CD25+ CD44+ T reg cells in
TCR-β expression on CD4+ CD8- CD25+ CD44+ T reg
cells in mouse thymus. Thymocytes were collected from
naïve mice, stained with antibodies against CD4 (PE-Cy7),
CD8 (FITC), CD44 (PE), CD25 (APC-Alexa Fluor755), and
TCR-β(PerCp), and analyzed by flow cytometry. (A) CD4CD8- (P4), CD4+CD8+ (P3), and CD4+CD8- cells (P5) were
gated from total, live thymocytes (P1). Cells from each of the
quadrants (designated as P3-P5) were subgated into
CD25+CD44- and CD25+CD44+ (In Figure 2A, - and + mean
CD25+CD44- and CD25+CD44+ cells [analysis described in
panel B]). In addition, CD4+CD8- SP cells were subgated into
CD25+CD44low, CD25+CD44med, and CD25+CD44high cells
(analysis described in panel C). (B) The percentages of TCRβ cells in CD4+CD8- SP cells (mean ± S.D., n = 3). (C) The
percentages of TCR-β cells among CD4+CD25+CD44low,
CD4+CD25+CD44med, and CD4+CD25+CD44high cells. Statistical significance in panels B and C is indicated by * p < 0.05
and ** p < 0.01.
CD44high subpopulation expressed TCR-β at the highest
frequency and intensity, whereas the CD44low subpopulation displayed the lowest expression levels of TCR-β. Thus,
the surface expression of CD44 was positively correlated
with TCR-β expression, suggesting that the CD4+CD25+
CD44high cells represent a more mature subset of T cells.
Foxp3 and CD44 expression in mouse thymocytes and
splenocytes
To test whether there are functional differences between
different subsets of CD44-expressing cells, we examined
the expression profile of Foxp3. Thymocytes derived from
naïve mice were stained with antibodies against CD4,
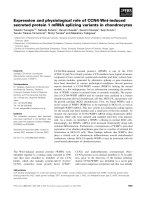
CD8, CD25, CD44, and Foxp3 (Figure 3). In three independently performed experiments, we consistently found
that
a
significantly
higher
proportion
of
CD4+CD25+CD44+ cells expressed Foxp3 as compared to
CD4+CD25+CD44- cells (63% vs. 26%, p < 0.01, Figure
3A). We also observed a positive correlation between
Page 4 of 13
(page number not for citation purposes)
Biology Direct 2009, 4:40
60
Foxp3 %
40
20
0
***
**
100
80
60
**
40
20
+
0
-
CD4+CD25+CD44 cells
C
high
med
low
CD44 levels in CD4+CD25+ cells
D
40
20
0
E
100
CD44 %
***
+
CD25 cells
***
***
30
Foxp3 %
Foxp3 %
60
20
10
0
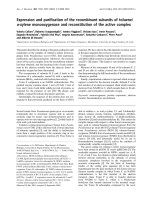
To validate these findings, we also stained splenocytes
with antibodies against CD4, CD8, CD25, CD44, and
Foxp3. We found a significantly higher proportion of
CD4+CD25+ CD44+ cells expressed Foxp3 than that of
CD4+CD25+CD44- cells (61% vs. 25%, Figure 4A), suggesting a positive correlation between CD44 and Foxp3
expression among CD4+CD25+ cells. Foxp3 was detected
in 72% of the CD4+CD25+CD44high cells, 42% of the
and
13%
of
the
CD4+CD25+CD44med cells,
CD4+CD25+CD44low cells (Figure 4B).
*
high
med
low
CD44 levels in CD4+ cells
**
A
80
60
40
20
0
+
Foxp3 cells
Figureexpression
Foxp3
3
in different subsets of thymocytes
Foxp3 expression in different subsets of thymocytes.
Thymocytes were stained with antibodies against CD4 (PECy7), CD8 (FITC), CD44 (PE), CD25 (APC-Alexa Fluor755),
and Foxp3 (PE-Cy5). CD4-CD8- DN, CD4+CD8- SP, CD4CD8+ SP, and CD4+CD8+ DP thymocytes were gated for
subsequent analyses. (A) Foxp3 expression (%) in
CD4+CD25+ cells that was either positive or negative for
CD44. (B) Foxp3 expression (%) in CD4+CD25+ cells that
expressed high, medium, or low levels of CD44. (C) Foxp3
expression (%) in CD4+ cells that was either positive or negative for CD25. (D) Foxp3 expression (%) in CD4+ cells that
expressed high, medium, or low levels of CD44. (E) CD44
expression (%) in CD4+ cells that was either positive or negative for Foxp3. Panels A to E show representative results
with mean ± S.D. from three independent experiments (* p <
0.05, ** p < 0.01, *** p < 0.001).
Foxp3 %
Foxp3 %
B
**
80
**
70
60
50
40
30
20
10
0
+
-
CD44 levels in CD4+CD25+ cells
B
***
100
**
Foxp3 %
A
/>
80
**
60
40
20
CD44 and Foxp3 expression among CD4+CD25+ cells.
Foxp3 was detected in 87% of the CD4+CD25+CD44high
cells, 41% of the CD4+CD25+CD44med cells, and 5.9% of
the CD4+CD25+CD44low cells (Figure 3B). Consistent
with another report [2], a higher proportion of
CD4+CD25+cells expressed Foxp3 compared to
CD4+CD25- cells (52% vs. 3.2%, p < 0.01, Figure 3C).
Again, the CD4+CD44high population contained the highest proportion of Foxp3-expressing cells (Figure 3D). Most
of the CD4+Foxp3+cells also expressed CD44 (78%),
whereas 31% of CD4+Foxp3- cells expressed CD44 (Figure
3E). Thus, we found a positive correlation between Foxp3
and CD44 expression, suggesting that CD44 may be an
additional marker for the maturation of regulatory thymocytes.
0
high
med
CD44 levels in
low
CD4+CD25+ cells
Figureexpression
Foxp3
4
in different subsets of splenocytes
Foxp3 expression in different subsets of splenocytes.
Splenocytes were stained with antibodies against CD4 (PECy7), CD8 (FITC), CD44 (PE), CD25 (APC-Alexa Fluor755),
Foxp3 (PE-Cy5) and analyzed by flow cytometry. (A) Foxp3
expression (%) in CD4+CD25+ cells that was either positive
or negative for CD44. (B) Foxp3 expression (%) in
CD4+CD25+ cells that expressed high, medium, or low levels
of CD44. Shown are representative results with mean ± S.D.
from three independent experiments (** p < 0.01, *** p <
0.001).
Page 5 of 13
(page number not for citation purposes)
Biology Direct 2009, 4:40
Functional assessment of Treg cell subsets in the thymus and
spleen
To
examine
whether
CD4+CD25+CD44+ and
+
+
CD4 CD25 CD44 cells differ in their ability to suppress
effector T cells, we sorted CD4+CD25+CD44+ and
CD4+CD25+CD44- cells from the spleen by FACS. Isolated
cell populations were then co-cultured with naïve T cells
pre-activated with Con A for 2 h. After co-culture of effector T cells (2 × 10⁵/well) with Treg cells in the presence of
Con A (2 μg/ml) for 72 h, T cell proliferation was measured. As shown in Figure 5A, although CD4+CD25+CD44+
and CD4+CD25+CD44- cells were capable of suppressing
T cell proliferation, CD4+CD25+CD44+ cells were significantly
more
potent
suppressors
than
were
CD4+CD25+CD44- cells. Because the expression of IL-10
is a hallmark of Treg cells [12,16], we examined via RT-PCR
the levels of IL-10 mRNA in purified CD4+CD25+CD44+
and CD4+CD25+CD44- cells. The levels of IL-10 were 2 to
2.4-fold higher in CD4+CD25+CD44+ cells than in
CD4+CD25+CD44- cells, as determined by densitometry
scanning of the gels (Figure 5B and 5C) and the data were
pooled from three independent experiments and shown
in a plot (Figure 5D). To confirm these findings, we sorted
CD4+CD25+CD44med,
and
CD4+CD25+CD44high,
CD4+CD25+CD44low cells from the spleens and measured
the levels of IL-10 mRNA by real-time RT-PCR. As shown
in Figure 5E, CD4+CD25+ CD44high Treg cells expressed 5fold higher levels of IL-10 than did CD4+CD25+CD44low
cells. Thus, the CD44 expression levels and Treg function
were positively correlated. To further examine the intrathymic development of Treg cells, we sorted CD4+CD8CD25+CD44+, CD4+CD8-CD25+CD44-, CD4+CD8-CD25CD44+, and CD4+CD8-CD25-CD44- cells from the thymus and measured the levels of IL-10 by real-time RTPCR. It was noted in Figure 5F that among these four
CD4+ cell subsets, CD25+CD44+ cells expressed the highest levels of IL-10 mRNA, and therefore represented the
Treg cell population with the highest suppressive activity.
There were no major differences with regard to IL-10
expression for CD25+CD44- and CD25-CD44+ cells. Thus,
CD4+CD25+CD44+ and CD4+CD25+CD44- cells both displayed regulatory functions, but the former displayed
more potent Treg activity than the latter.
CD44 Treg cells produce IL-10 that suppresses T cell
proliferation
To determine that IL-10 was produced by Foxp3+ T cells
but not by other cells, we isolated thymocytes and splenocytes from naïve mice and stained them with antibodies
against CD4, CD8, CD25, CD44, IL-10. As shown in Figure 6A and 6C, we found that a significantly higher proportion of CD4+CD25+CD44+ cells produced IL-10 in the
splenocytes and thymocytes (6.0% and 3.2%, respectively) as compared to CD4+CD25+CD44- cells in splenocytes and thymocytes (0.6% and 0.4%, respectively, p <
/>
+ CD44
- splenocytes
CD25
Figure
5 function
Regulatory
of CD4+ CD25+ CD44+ and CD4+
Regulatory function of CD4+ CD25+ CD44+ and CD4+
CD25+ CD44- splenocytes. (A) CD4+CD25+CD44+ and
CD4+CD25+CD44-cells were sorted from the splenocytes of
C57BL/6 mice, and these cells (1 × 10⁵/well) were co-cultured with naïve T cells (2 × 10⁵/well) in the presence of Con
A for 72 h. T cell proliferation was measured by incorporation of [3H]-thymidine. Data are presented as counts per
min, and shown are the mean ± S.D. from three independent
experiments. (B) Total RNA was extracted from purified
CD4+CD25+CD44+ and CD4+CD25+CD44- cells for RTPCR analysis of IL-10 expression. (C) The integrated density
values (IDV) for the IL-10 transcripts were quantitated and
normalized to those of β-actin. Shown are representative
results from one of three independent experiments. (D) The
data were pooled from three independent experiments and
shown in the plot. (E) The levels of IL-10 mRNA among different subsets of CD44+ expressing cells.
CD4+CD25+CD44high, CD4+CD25+CD44med and
CD4+CD25+CD44low cells were sorted from the spleens of
naïve mice. (F) CD4+CD8-CD25+CD44+, CD4+CD8CD25+CD44-, CD4+CD8-CD25-CD44+, and CD4+CD8CD25+CD44- cells were sorted from the thymus of naive
mice. Total RNA was isolated for measuring IL-10 mRNA by
real-time RT-PCR. Data are presented as fold-induction relative to the levels of β-actin. Shown are representative results
one of three independent experiments.(* p < 0.05, ** p <
0.01, *** p < 0.001).
Page 6 of 13
(page number not for citation purposes)
Biology Direct 2009, 4:40
spleen
CD4+CD25+
CD25
CD8
A
/>
B%
30
CD44-
IL-10+ cells
*
CD44+
20
tion of radioactivity was measured by liquid scintillation
counting in triplicate. As shown in Figure 7A, the suppressive activity of Treg cells was aborated when an anti-IL-10
antibody was used.
10
CD4
CD44
0.6
0
CD44+ CD44CD4+CD25+Foxp3+
IL-10
6.0
CD8
D
thymus
C
CD8
CD25
CD4+CD25+
CD44- CD44+
%
35
IL-10+ cells
**
25
15
CD44
CD4
CD44+ CD44CD4+CD25+Foxp3+
3.2
IL-10
0.4
0
It is known that Foxp3 controls Treg cell development and
function. To validate the contribution of IL-10 in regulating T cell development and function, we obtained splenocytes from naïve mice and treated them with an IL-10
neutralizing antibody or an isotype control (rat IgG1) in
the presence or absence of Con A (5 μg/ml) for 24 h, with
GolgiPlug in the medium for the last 3 h. Cells were
stained with antibodies against CD4, CD8, CD25, CD44,
and Foxp3 and analyzed by FACS. As shown in Figure 7B,
Foxp3 expression levels were much lower (1.4%) in
CD4+CD25+cells treated with anti-IL-10 antibody than
those treated with an isotype control (17.3%) or without
antibody (28%).
CD8
Intracelluler
Figure 6 IL-10 levels in Treg cells of thymocytes and splenocytes
Intracelluler IL-10 levels in Treg cells of thymocytes
and splenocytes. Splenocytes (A and B) and thymocytes
(C and D) were obtained from naïve C57BL/6 mice, stained
with mAbs against CD4 (PE-Cy7), CD8 (FITC), CD44 (PE),
CD25 (APC-Alexa Fluor755), Foxp3 (APC) and IL-10
(PerCP), and analyzed by flow cytometry. (A and C) The
percentages of IL-10+ cells in CD4+CD25+CD44- and
CD4+CD25+CD44+ cells. (B and D) The percentages of IL10+ cells in CD4+CD25+CD44-FoxP3+ and
CD4+CD25+CD44+ FoxP3+ cells. Shown are representative
results from one of four independent experiments. Data in B
and D are presented as mean ± S.D.
Next, we sorted CD4+CD25high cells and incubated them
alone or togather with IL-10 blocking antibody or isotype
control. After 24 h of incubation, the cells were harvested
and anayzed. As shown in Figure 7C, Foxp3 expression
were signficnatly decreased by the addition of anti-IL-10
in the CD4+CD25+ population of the cells (8%) than
those treated with an isotype control (19%) or without
antibody (23%). These data suggested an invovlment of
IL-10 in suppressive mechanisms of Treg cells.
Discussion
0.01). Likewise, the percentages of IL-10+ cells in
CD4+CD25+CD44+ Foxp3+ T cells derived from the spleen
and thymus (27% and 31%, respectively) were signficnatly higher than those in CD4+CD25+CD44- Foxp3+ cells
(18% and 15%, respectively, Figure 6B and 6D).
In this study, we have provided evidnece that
CD4+CD25+CD44+Treg cells expressed high levels of
Foxp3, IL-10, and displayed a potent suppressive function
in vitro. Our results are consistant with those reported by
Bookimin et al. [26] and Bollyky et al. [27], suggesting that
CD4+CD25+CD44high cells display more potent Treg functions than do CD4+CD25+CD44low cells. As expected,
these Treg cells suppress effector T cell proliferation via the
production of IL-10. The significance of this study is that
it highlights the functional relevence of CD44 in defining
Treg cell subsets and may explain the unique developmental pathway of CD4+Treg cells in the mouse thymus and the
subtle differences between various Treg cell subsets.
IL-10 plays a pivotal role in maintaining homestasis via
direct or indirect control of activation, proliferation, but
also via its effects on regulatory T cells [25]. To further
confirm whether blocking IL-10 aborogated suppressive
mechanisms of CD4 Treg cells, CD4+CD25- and
CD4+CD25+CD44+(or CD4+CD25+CD44-) cells were
sorted by FACSAria and were incubated alone or co-cultured (CD4+CD25-: CD4+ CD25+) at a 2:1 ratio in the
presence of anti-CD3 antibody. In some experiments,
blocking antibodies to IL-10 or isotype rat IgG1 control
were also used, and after 72 h of incubation, incorpora-
The use of better markers or marker combinations in
multi-color flow cytometry has made it possible to resolve
and define many very small populations of lymphoid progenitors and mature cells. For example, Seddiki et al. used
38 surface markers and revealed the persistence of naïve
CD45RA+ Treg cells in infant thymus, cord or adult peripheral blood, lymph nodes, and spleen [28]. In this study,
the simultaneous use of mAbs specific for CD4, CD8,
CD25 and CD44 allowed us to detect 16 subtypes of thymocytes, with 80% of the thymocytes as being CD4+CD8+
cells (data no shown). Of note, CD4+CD8-CD25+CD44+
Page 7 of 13
(page number not for citation purposes)
Biology Direct 2009, 4:40
Thymidine incorporation
(cpm x 1000)
A
/>
**
18
16
***
**
CD25+CD44+ cells expressed Foxp3, only 28% of
CD4+CD8-CD25+CD44- cells expressed Foxp3 (Figure
1C).
**
12
8
4
0
Naïve T cells
CD4+CD25+cells
+
+
-
-
+
+
+
+
+
+
CD44- CD44- CD44- CD44+ CD44+ CD44+
Anti-IL-10
-
+
-
-
+
-
-
+
Isotype
-
-
-
+
-
-
+
-
Foxp3
CD25
B
CD4
Rat IgG1
28
17.3
IL-10 block
1.4
CD4
CD25
C
Medium
Foxp3
Medium
23
CD4
Rat IgG1
19
IL-10 block
8
CD4
Figure
7
IL-10
T
neutralizing
antibody reversed suppressive activities of
reg cells
IL-10 neutralizing antibody reversed suppressive
activities of Treg cells. (A) CD4+CD8-CD25+CD44+ and
CD4+CD8- CD25+CD44- cells were sorted from splenocytes
from C57BL/6 mice and cultured with naïve CD4+CD25- T
cells in the presence of anti-CD3/anti-CD28 for 72 h. In
some cases, anti-IL-10 or isotype control Ab was added. Cell
proliferation was measured by [3H]-thymidine incorporation.
Data are presented as counts for min, and shown are the
mean ± S.D. from three independent experiments (** p <
0.01, *** p < 0.001). (B) Splenocytes from naïve mice were
treated with either the IL-10 neutralizing antibodies or an
isotype control (rat IgG1) in the presence or absence of Con
A (5 μg/ml) for 24 h. Cells were stained with antibodies
against CD4, CD8, CD25, CD44, and Foxp3 and analyzed by
flow cytometry. (C) CD4+CD25high cells were sorted from
splenocytes of C57BL/6 mice and cultured with anti-IL-10 or
isotype control Abs for 24 h. Cells were stained with antibodies against Foxp3 and CD4 and analyzed by flow cytometry. Data are presented as the percentage of total
splenocytes and shown are representative results of one of
four independent experiments.
and CD4+CD8-CD25+CD44- Treg cells in the thymus constituted only 0.4% and 0.8%, respectively, of the total thymocytes (Figure 1B). While 72% of CD4+CD8-
The TCR-β locus plays an important role in the development of T cells [23,24]. Although in TCR transgenic mice,
exposure of the developing T cells to the cognate peptide
in the thymus causes an increase in the CD4+CD25+ Treg
cell population [3,29], it is unclear how the TCRβ-chain
regulates Treg cells. We examined TCR-β expression in
thymic Treg cell development. Cells in these transition
stages begin to express TCR genes. We found that
CD4+CD8-CD25+CD44+ cells expressed higher levels of
TCR-β than did CD4+CD8-CD25+CD44- cells (Figure 2B),
and that CD44high Treg cells from the thymus displayed
higher levels of TCR-β than did CD44med or CD44low cells.
Almost 100% of CD44high Treg cells expressed the TCR-βchain, whereas the frequency of TCR-β-expressing cells
was significantly lower in Treg cells with reduced CD44
expression (Figure 2C). Thus, our data suggest that the levels of TCR-β expression indicate the maturation status of
Treg cells and correlate with the suppressive function of Treg
cells. It is possible that CD4+CD25+ T cells require activation via their TCR to differentiate into suppressive cells
[30]. Here, it should be mentioned that at the CD4 SP
stage, thymocytes have already passed positive selection
by virtue of TCR mediated signaling events. Nevertheless,
our data implies that ~60% of CD4 SP CD25+CD44- cells
do not express a TCR-β chain. It is not clear whether TCRβ- cells might reflect a "spillover" from the double negative (DN) compartment and this possibility will be examined in the future.
It is known that Foxp3 is a conserved transcription factor
that programs the development and the suppressive function of CD4+CD25+ Treg cells. However, less is known
about the Foxp3 expression pattern during thymocyte
development. To address this issue, we examined the
inter-relationship among the expression profiles of CD25,
Foxp3, and CD44 and found several trends (Figure 3).
Since CD4+CD8-CD44+ SP or CD4+CD8-CD44high SP cells
expressed high levels of Foxp3, our data suggest a positive
correlation between Foxp3 expression and expression of
CD44 and the TCR-β-chain. Additional precursor progeny
studies are needed to further test/validate this hypothesis.
Because functional assays are critical parameters for
assessing Treg cell function, we used CD4, CD8, CD25, and
CD44 markers and the FACSAria sorter to carefully isolate
T cell subsets from the spleens of naïve mice. In vitro T cell
co-culture and RT-PCR assays indicated stronger suppressive function and higher mRNA levels of IL-10 in
CD4+CD8-CD25+CD44+ cells than in CD4+CD8CD25+CD44- cells (Figure 5). Because CD4+CD8CD25+CD44high cells displayed the highest suppressive
Page 8 of 13
(page number not for citation purposes)
Biology Direct 2009, 4:40
function and the highest mRNA levels of IL-10 (Figure
5E), we suggest that CD44 can be considered a complementary marker for the functional potential of Treg cells.
To further support this conclusion, we isolated four subsets of CD4+ thymocytes and examined their IL-10 mRNA
levels via real-time RT-PCR analysis. We provided two
lines of evidence indicating the role of IL-10 in Treg cellmediated
suppression.
First,
CD4+CD25+CD44+
Foxp3+cells expressed much higher levels of intracellular
IL-10 than did CD4+CD25+CD44- Foxp3+ cells (Figure 6).
Second, the addition of an IL-10 neutralizing antibody
reversed this suppression (Figure 7A), and affected Foxp3
expression in the splenocytes (Figures 7B and 7C).
Whether, IL-10 neutralizing antibody reversed this suppression through regulating Foxp3 expression is currently
not known and will be explored in the future. One possibility exists that our cell population might contain IL-10
producing non-Foxp3+ T cells, so called Tr1-like cells, that
could cause reduction in Treg cell suppressive effect using
anti-IL-10 antibodies; however, this possibility seemed
highly unlikely but will be examined in our future studies.
Our results suggest that the regulatory/suppressive potential of these cells can be ranked in the following order:
CD4+CD8-CD25+CD44+ cells > CD4+CD8-CD25+CD44cells > CD4+CD8-CD25-CD44+ cells. Thus, one would predict that naïve CD4+ T cells may have a higher possibility
to convert into Treg cells in the periphery than do their
counterparts. Additional experiments are warranted to test
this possibility, because a better understanding of Treg cell
conversion and acquisition has potential therapeutic utility for autoimmunity and transplantation.
In summary, we found two novel phenotypes of Treg cells
in the thymus. While both CD4+CD25+CD44+ and
CD4+CD25+CD44- cells display suppressive activities,
CD4+CD25+CD44high cells are the most potent Treg cells.
The expression levels of CD44 positively correlate with
the expression of IL-10 and Foxp3, as well as with the regulatory potential of Treg cells which suppresses T cell proliferation function by producing IL-10.
Competing interests
The authors declare that they have no competing interests.
Authors' contributions
TL and LS contributed equally to the design of the study
and writing of the manuscript; TL performed the experiments and analyzed data; GL and RK participated in
experimental design, data analysis, and manuscript preparation; AKC provided support for this research, contributed in designing the study and manuscript writing and
revisions, as well as in responding to reviewers' comments. All authors substantially contributed to the redac-
/>
tion of the manuscript and have given final approval on
the version to be published.
Reviewer's Comments
Reviewers' report 1
Dr. Lenardo
Liu et al., demonstrate CD44 as a new marker for Tregs in
their manuscript entitled "The development of
CD4+CD25+CD44+ regulatory T cells in mouse thymus".
The authors have clearly shown that Foxp3 expression and
enhanced suppressive activity of Tregs are associated with
CD44 molecule. The authors have presented a concise
report of their findings in a well-written manuscript and
clearly presented data. They have also speculated that
Tregs may develop from DN2 or DN3 stage T cells separately before development of naïve cells.
Authors' response: We were very pleased to read your supporting
comments on our study and felt that your suggestions were very
helpful in assisting us to improve the quality of the revised manuscript. Based upon your suggestions, we have performed new
experiments and presented these data in new Figures 6and 7.
In addition, we have addressed your specific comments pointby-point.
1) The authors have not shown any evidence with regards
to the Treg development other than CD25 and CD44
staining. Therefore, the title is misleading and changes the
focus of the actual content of the paper i.e., CD44 correlates with Foxp3+ expression. There is no scientific evidence presented in the paper, showing that Treg cells
actually arise from DN3 or 2/DN3 cell stage cells. The possibility that Treg cells could develop from DN4 cell stage
cells by reacquiring CD44 and CD25 during negative
selection and maturation processes has not been formally
excluded. There is a school of thought that Treg cells
escape negative selection even-though they have high
affinity self-ligands. The authors should therefore address
these points if they want to discuss about developmental
aspects of Tregs in this paper. Otherwise, the authors
should change the title of the manuscript and speculate
the developmental aspects of Tregs only in the "discussion" section.
Authors' response: To address question 1, we have changed the
title to "CD44 expression positively correlates with Foxp3
expression and suppressive function of CD4+Treg cells", as suggested by the reviewer. We have also removed the original Figure Seven from the revised manuscript and provided a brief
discussion on the development of Treg cells in the revised discussion of the manuscript.
2) It is interesting that CD44 expression is coupled to the
TGF-β and IL-10 expression. However, it has been shown
Page 9 of 13
(page number not for citation purposes)
Biology Direct 2009, 4:40
previously that TGF-β and IL-10 are not necessary for in
vitro suppression. Therefore, if authors claim CD44
expression positively correlates with higher suppression
and these suppressive cytokines, the authors should demonstrate if CD44 high subset of Tregs suppress predominantly by these suppressive cytokines. It would be
interesting to test whether the suppressive activity of
CD44+ subset is blocked by neutralizing these cytokines. It
is possible that CD44- subset and CD44+ subset of CD25+
Tregs suppress in different manner, which is why one cannot abrogate suppression by neutralizing TGF-β and IL-10
in cultures with both the subsets so far.
Authors' response: To address question 2, our new data showed
that suppressive function of CD4 Treg cells on T cell proliferation
could be reversed by neutralizing anti-IL-10 antibodies (Figure
7A). Further, our data provided evidence that IL-10 might regulate suppression of T cell proliferation function by modulating
Foxp3 (Figure 7B).
Reviewers' report 2
Dr Klein & Dr Wirnsberger (nominated by Dr JC ZungiaPfluker)
The manuscript "CD44 expression positively correlates
with Foxp3 expression and suppressive function of CD4+
Treg cells" by Liu et al. proposes a subdivision of thymic
and splenic Treg into populations characterized by different levels of CD44 expression. Although the revised ms
deals with the functional properties of these subpopulations rather than focusing on developmental aspects of
Treg cell biology, several major concerns remain as to the
characterization of these cells and the interpretation of the
reported experiments. Because the focus of the ms has
profoundly changed, we have looked at it as if it were a
first submission.
1) Introduction: "...the surface expression of CD44 in mouse
thymocytes preceded that of Foxp3" - this statement implies
a direct precursor/progeny relationship between the
described subpopulations and "mature" Treg that is not
experimentally addressed at all in this manuscript.
Authors' response: Since our data indicated that CD44 expression positively correlated with Foxp3 expression, we have
revised this line in the introduction to correctly reflect our data.
2) Figure 1: The authors claim that "...location and sequence
of Treg development remain unclear." Significant progress
has been made in terms of a delineation of critical events
during the earliest phase(s) of Treg differentiation and
also in terms of the localization of their differentiation,
which are not referenced here (Lio et al., 2008, Lee et al.,
2009, Fontenot et al., 2005).
/>
The following characterization of thymocyte subpopulations is based upon CD4/8/25/44 staining. Although the
authors avoid calling these populations Treg at that point,
the subsequent experiments are done using this staining
scheme and cells are referred to as "thymic Treg cells" later
on. The only specific Treg marker to date is Foxp3, hence
- especially given the already reported heterogeneity of
CD4 SP CD25+ cells - Foxp3 staining would be essential
for these types of analyses.
Authors' response: As suggested by the reviewer, we have added
the following references: Lio et al., 2008, Lee et al., 2009, Fontenot et al., 2005 in the revised manuscript. In addition, we
have performed new experiments and added data showing
"Foxp3
expression
in
CD4+CD8-CD25+CD44+and
+
+
CD4 CD8 CD25 CD44 cells (see new Figure 1C).
3) Figure 2: At the CD4 SP stage, thymocytes have already
passed positive selection by virtue of TCR mediated signaling events. Additionally, as stated in the introduction,
Treg differentiation is thought to rely on thymic antigen
encounter/TCR signaling. Nevertheless, Figure 2 implies
that ~60% of CD4 SP CD25+CD44- ("Treg") cells do not
express a TCR-β chain. This discrepancy is not discussed in
the manuscript at all and might reflect a "spillover" from
the DN compartment.
Authors' response: We agree with the reviewer that our original
Figure 2was not very clear and that it may cause some confusion. The revised Figure 2now only focuses on TCR-β expression
among CD4+CD25+CD44-and CD4+CD25+CD44+SP cells.
We have expanded the discussion section and included
reviewer's point in this section.
4) Figure 3: The authors also claim to detect both different
percentages of TCR-β+ cells and different levels of TCR-β
expression among the described populations. Staining
showing different levels of TCR-β expression among the
described subsets are not provided, however. The suggestion that "...CD4+CD25+CD44+cells represent a more mature
subset of Treg cells..." based upon the presented staining
(lacking Foxp3 staining) and lacking any experiments providing evidence for a precursor/progeny relationship is
daring.
Authors' response: We think that the reviewer meant Figure
2and not Figure 3. We found that CD4+CD25+CD44+cells
expressed the highest level TCR-β in thymocytes. So we believe
that CD4+CD25+CD44+cells were more mature T cells. We
meant mature T cells and not Treg cells.
5) Data in Figure 3 show that essentially all Foxp3+ cells
are also CD44+/high, but that only a "small" fraction of
CD4+CD25+CD44+ cells - as classified by the authors - are
Foxp3+. These results clearly necessitate a re-examination
Page 10 of 13
(page number not for citation purposes)
Biology Direct 2009, 4:40
of the results and interpretation of Figure 1 and 2. The
results presented also argue for a relatively low percentage
of CD25+/high cells being Foxp3+, which is not consistent
with the literature on Foxp3+ cells in the (adult) thymus
(Fontenot et al., 2005).
Authors' response: We appreciate for reviewer's insightful comments. In more than 10 independent repeats, we sometimes
detected higher frequencies and sometimes lower frequencies of
Foxp3+cells. To confirm the trends, we carefully performed
additional experiments. After careful reviewing all of our data,
especially the new data, we decided to present a revised Figure
3, showing our new data. This is not to say that the old data
were wrong, since it is a cellular staining, Foxp3 expression varied in different samples. Importantly, however, the rate of
Foxp3 expression in CD44+and CD44-subset was similar in all
of the data analyzed.
6) Figure 4: The authors claim to have done a "functional
assessment of Treg cell subsets in mouse thymus and spleen."
The data presented only show the suppressive activity of
splenocytes. (For thymocytes: only Real Time PCR data
are provided). The differences in suppressive potency (Figure 4A) are very modest. Additionally the authors show,
that the described populations differ in their TGF-beta
and IL-10 mRNA expression levels. The differences are
modest and probably not too informative, however.
Authors' response: The only ways to show "functional assessment of Treg cell subsets in mouse thymus and spleen" are by
RT-PCR, real Time RT-PCR and intercellular staining, and we
obtained similar results with these different assays. Our experiments were limited by cell sorting conditions, as we could not
sort enough of CD44 Treg cells, which influenced our results.
However, we have provided new data in which Treg: effector
cells were used in a ratio of 1:2, and the suppressive potency was
impressive (new Figure 5A).
7) Figures 4 and 5 are redundant. It might not be necessary to show Figure 4 at all. RT PCR (Figure 5) and Realtime data (Figure 6A) are redundant. Assessing cytokine
mRNA expression levels does not allow any statements on
the suppressive potential of thymocyte populations (6B).
Authors' response: We agree that the original Figures 4and
5are redundant and have deleted Figure 5. We feel that Figure
6Bcan help readers understand cytokine expression of Treg cells
in the thymus, and have decided to have new Figures 5Eand
5F.
8) Figure 7: The authors claim that "CD44 Treg cells produce IL-10 and TGF-beta cytokines that suppress T cell proliferation". The expression of TGF-beta by the described
populations is not shown, however. Data on a role for
/>
TGF-beta in in vitro suppression assays is also not provided.
Authors' response: We could not detect TGF-beta expression in
both CD44+and CD44- cells with flow cytometry assay and the
TGF-beta mRNA data were modest. We decided to delete TGFbeta data and to focus on IL-10 in Treg cells in later experiments.
9) Figure 8B: involvement of IL-10 in direct regulation of
Foxp3 expression seems to be problematic. Studies on a
role of IL-10 and TGF-beta in Treg cell induction/homeostasis and suppressor function (Li and Flavell 2008,
amongst many others) and a possible role for CD44 and
Foxp3+ cells can - via intracellular staining - be visualized
as a distinct population among CD4+ cells. The CD4/
Foxp3 plots in Figure 8B do not really allow for gating on
Foxp3+ cells. Due to the experimental setup and the lack
of "resolution" provided by the Foxp3 staining shown an
interpretation suggesting an low/high molecular weight
hyaluronic-acid in Treg function (Bollyky et al., 2007)
have been reported elsewhere and are not sufficiently referenced in this section.
In aggregate, this manuscript provides some insights into
how Treg can be subdivided into subpopulations differing
in their suppressive potency based upon the expression of
the hyaluronic-acid receptor CD44. However, the concerns mentioned above should be addressed in order to
clarify the validity of the given interpretations and conclusions. We hope that these comments are helpful to
improve the quality of this manuscript.
Authors' response: In this study, we have used anti-IL-10 antibody to block IL-10 in splenocytes, and we found that IL-10
induced Foxp3 expression was decreased. Furthermore, we
sorted CD4CD25highcells from spleen of C57BL/6 mice, cultured themwith anti-IL-10 or rat IgG1 antibody for 24 hours,
and analyzed data by Flow cytometry (revised Figure 7C). We
found IL-10 induced Foxp3 expression was decreased in
CD4CD25highcells after blocking this cytokine with IL-10 neutralizing antibody. These results suggest that Treg cell suppressive effect on T cell proliferation could be reversed by IL-10
blocking antibody through regulation of the Foxp3 expression.
Finally, we have added Li, Ming O and Richard A Flavell 2008
reference and that of Bollyky et al. 2007 in the revised manuscript
Reviewers' report 3
Dr Shevach
The authors have changed the title of the paper and this
does improve the focus of the manuscript. However,
Page 11 of 13
(page number not for citation purposes)
Biology Direct 2009, 4:40
numerous issues remain to be resolved with this manuscript:
1) The authors now accept that Foxp3 is the marker for
Treg in the mouse, yet the data presented in figures 1, 2, 3
add absolutely nothing to our understanding of the development of Foxp3+ T cells in the thymus. Although they
appear to perform competent staining, the level of Foxp3
expressing cells even in the CD44high pool is only 20%. It
is not clear what new information is conveyed in these figures.
Authors' response: Although much is known about T cell development in the thymus, there is limited information on Treg cell
markers in the thymus. Figure 1showsCD4+CD8CD25+CD44+and CD4+CD8-CD25+CD44-cells in thymus,
and Foxp3 expression in CD4+CD8-CD25+CD44+and
CD4+CD8-CD25+CD44-cells. Figure 2shows that TCR-β locus
plays an important role in the development of T cells. We compared the expression of TCR-β in both CD4+CD25+CD44+and
CD4+CD25+CD44cells,
and
found
that
CD4+CD25+CD44+cells are mature cells. Our data in Figure
3show that Foxp3 is positively correlated with CD44. Based on
our new data, we have revised Figure 3.
2) The authors need to quantitate by intracellular staining
the percentage of Foxp3 expressing cells in each of their
so-called Treg populations in figure 4. As pointed out in
my previous review, the magnitude of suppression in this
figure is not great (compared to other published studies)
and the differences between the CD44+ and the CD44populations could easily be accounted by minor differences in percentage of Foxp3+ T cells. The same criticism
applies to the data in figure 5.
Authors' response: We have quantitated by intracellular staining, the percentage of Foxp3 expressing cells in splenocytes (Figure 4). Our experiments were limited by cell sorting conditions,
as we could not get sufficient numbers of CD44 Treg cells. However, we have provided new data in which Treg: effector cells
were used in a ratio of 1:2, and the suppressive potency was
impressive (new Figure 5A).
3) The authors rely heavily on PCR data in figure 6. As
suppression requires TCR activation, they need to stimulate the populations to determine how much of these
cytokines they are capable of producing. Elisa assays and
intracellular staining are needed. MOST IMPORTANTLY,
they need to do simultaneous staining for IL-10 and
Foxp3. We agree that this it is difficult to analyze TGF-beta
by IC staining.
Authors' response: We have performed this study in Figure 6.
The most critical step for detection of intracellular accumulation of cytokines by intracellular staining is activation of a cell
/>
population to induce production of cytokines of interest. We
used Con A as an activator to co-culture with GolgiPlug in the
medium. There was no IL-10 expression in control cells which
were not activated by Con A.
4) The same criticism holds for the data in figure 7. Are the
cells that stain for IL-10 Foxp3+? CD44 and CD25 are surrogate markers that mean little.
Authors' response: Yes, we have added data on IL-10 levels in
CD4+CD8CD4+CD8-CD25+CD44+Foxp3+and
CD25+CD44-Foxp3+cells in the revised Figures 6Band 6D.
5) The suppression data in figure 8 lacks an important
control. The authors need to add the anti-IL-10 to the
naïve T cells alone. Anti-IL-10 will frequently increase the
response of this population as well. In general, anti-CD28
reverses suppression in the mouse model and it is very difficult to suppress mouse T cell activation in the presence
of anti-CD28 (the authors might review some of the
papers published years ago which address this point). It is
unclear why the authors see a reversal of suppression with
anti-IL-10 as other groups using highly purified Foxp3+ T
cells have not seen this. There seems to be no difference in
the susceptibility of the high versus the low population to
anti-IL-10 reversal, so one would assume that their data
should not differ from the published data using Tregs that
are not fractionated based on CD44 expression. One possibility is that the cell populations contain IL-10 producing non-Foxp3+ T cells, so called Tr1-like cells.
Authors' response: Anti-IL-10 with naïve T cell data have been
added (only anti-CD3 and not anti-CD28 in the medium) as
a control. We have sorted CD4CD25highcells from spleen of
C57BL/6 mice and cultured them with anti-IL-10 or Rat IgG1
for 24 hours, and analyzed by Flow cytometry (revised Figure
7C). Our data clearly and very reproducibly indicated that
anti-IL-10 antibodies reversed the suppressive ability of Treg
cells. Therefore, we are convinced that our data is accurate.
However, it is possible that the Foxp3+cells isolated from transgenic mice might behave differently compared to Foxp3+ cells
from normal mice. The reviewer brought up an interesting point
regarding Tr1-like cells. We have added this statement in the
revised manuscript to cover all points.
6) a) Panel B of figure 8 is simply fantasy. I see no physiologic relevance to studying an unseparated population of
thymocytes and splenocytes. b) Why do the authors add
Con A? IL-10 deficient mice have normal numbers of
Foxp3+ T cells. c) Why is there a difference between the
medium control and the control IgG? d) This study needs
to be performed with purified Foxp3+ cells from thymus
and spleen. Considerable cell death occurs when thymocytes are cultured under these conditions, yet cell survival
is not mentioned.
Page 12 of 13
(page number not for citation purposes)
Biology Direct 2009, 4:40
/>
Authors' response: a) In this study, we have used anti-IL-10 to
block IL-10 in splenocytes and found that IL-10 induced Foxp3
expression was decreased. Furthermore, we sorted
CD4CD25highcells from spleen of C57BL/6 mice and cultured
them with anti-IL-10 or Rat IgG1 for 24 hours, and analyzed
samples by Flow cytometry (revised Figure 7C). We found IL10 induced Foxp3 expression was decreased in
CD4CD25highcells. b) In panel B of Figure 7, our data showed
different level of Foxp3 expression between anti-IL-10 treatedversus control-cells and medium alone. However, more significant difference in Foxp3 expression between anti-IL-10 treatedand control-cells in the presence of ConA was noted. ConA may
increase activity of T cells to influence Foxp3 expression on Treg
cells. However, we did not use ConA in our new Figure 7C. c)
We believe that this antibody might not be highly purified; however, it did not influence the accuracy of our results. d) Spleen
samples but not thymus were used and the cells did not die in
these experiments.
13.
14.
15.
16.
17.
18.
19.
20.
Acknowledgements
21.
We thank Mardelle Susman for assisting in manuscript preparation. This
study was supported in part by NIH grants AI064389 and N01-30065 (to
A.K. Chopra) and NIH grant AI043003 (to L. Soong).
22.
24.
References
1.
2.
3.
4.
5.
6.
7.
8.
9.
10.
11.
12.
23.
CD4+CD25+
Bluestone JA, Tang Q: How do
regulatory T cells
control autoimmunity? Curr Opin Immunol 2005, 17:638-42.
Fontenot JD, Gavin MA, Rudensky AY: Foxp3 programs the
development and function of CD4+CD25+ regulatory T cells.
Nat Immunol 2003, 4:330-6.
Apostolou I, Sarukhan A, Klein L, von Boehmer H: Origin of regulatory T cells with known specificity for antigen. Nat Immunol
2002, 3:756-63.
Jordan MS, Boesteanu A, Reed AJ, Petrone AL, Holenbeck AE, Lerman MA, Naji A, Caton AJ: Thymic selection of CD4+CD25+ regulatory T cells induced by an agonist self-peptide. Nat Immunol
2001, 2:301-6.
Cabarrocas J, Cassan C, Magnusson F, Piaggio E, Mars L, Derbinski J,
Kyewski B, Gross DA, Salomon BL, Khazaie K, et al.: Foxp3+ CD25+
regulatory T cells specific for a neo-self-antigen develop at
the double-positive thymic stage. Proc Natl Acad Sci USA 2006,
103:8453-8.
Wan YY, Flavell RA: Regulatory T-cell functions are subverted
and converted owing to attenuated Foxp3 expression. Nature
2007, 445:766-70.
Fontenot JD, Rudensky AY: A well adapted regulatory contrivance: regulatory T cell development and the forkhead family
transcription factor Foxp3. Nat Immunol 2005, 6:331-7.
Gavin MA, Rasmussen JP, Fontenot JD, Vasta V, Manganiello VC,
Beavo JA, Rudensky AY: Foxp3-dependent programme of regulatory T-cell differentiation. Nature 2007, 445:771-5.
Kretschmer K, Apostolou I, Hawiger D, Khazaie K, Nussenzweig MC,
von Boehmer H: Inducing and expanding regulatory T cell populations by foreign antigen. Nat Immunol 2005, 6:1219-27.
Presser K, Schwinge D, Wegmann M, Huber S, Schmitt S, Quaas A,
Maxeiner JH, Finotto S, Lohse AW, Blessing M, et al.: Coexpression
of TGF-beta1 and IL-10 enables regulatory T cells to completely suppress airway hyperreactivity. J Immunol 2008,
181:7751-8.
Dieckmann D, Bruett CH, Ploettner H, Lutz MB, Schuler G Human:
CD4+CD25+ regulatory, contact-dependent T cells induce
interleukin 10-producing, contact-independent type 1-like
regulatory T cells [corrected]. J Exp Med 2002, 196:247-53.
Zheng SG, Wang JH, Gray JD, Soucier H, Horwitz DA: Natural and
induced CD4+CD25+ cells educate CD4+CD25- cells to
develop suppressive activity: the role of IL-2, TGF-beta, and
IL-10. J Immunol 2004, 172:5213-21.
25.
26.
27.
28.
29.
30.
Li MO, Flavell RA: Contextual regulation of inflammation: a
duet by transforming growth factor-beta and interleukin-10.
Immunity 2008, 28:468-76.
Roncarolo MG, Gregori S, Battaglia M, Bacchetta R, Fleischhauer K,
Levings MK: Interleukin-10-secreting type 1 regulatory T cells
in rodents and humans. Immunol Rev 2006, 212:28-50.
Uhlig HH, Coombes J, Mottet C, Izcue A, Thompson C, Fanger A,
Tannapfel A, Fontenot JD, Ramsdell F, Powrie F: Characterization
of Foxp3+ CD4+ CD25+ and IL-10-secreting CD4+ CD25+ T
cells during cure of colitis. J Immunol 2006, 177:5852-60.
Rubtsov YP, Rasmussen JP, Chi EY, Fontenot J, Castelli L, Ye X, Treuting P, Siewe L, Roers A, Henderson WR Jr, et al.: Regulatory T cellderived interleukin-10 limits inflammation at environmental
interfaces. Immunity 2008, 28:546-58.
Nandi A, Estess P, Siegelman MH: Hyaluronan anchoring and regulation on the surface of vascular endothelial cells is mediated through the functionally active form of CD44. J Biol Chem
2000, 275:14939-48.
Khaldoyanidi S, Denzel A, Zoller M: Requirement for CD44 in
proliferation and homing of hematopoietic precursor cells. J
Leukoc Biol 1996, 60:579-92.
Ceredig R, Rolink T: A positive look at double-negative thymocytes. Nat Rev Immunol 2002, 2:888-97.
Fontenot JD, Dooley JL, Farr AG, Rudensky AY: Developmental
regulation of Foxp3 expression during ontogeny. J Exp Med
2005, 202:901-6.
Lio CW, Hsieh CS: A two-step process for thymic regulatory T
cell development. Immunity 2008, 28:100-11.
Lee HM, Hsieh CS: Rare development of Foxp3+ thymocytes in
the CD4+CD8+ subset. J Immunol 2009, 183:2261-6.
Germain RN: T-cell development and the CD4-CD8 lineage
decision. Nat Rev Immunol 2002, 2:309-22.
Bosselut R: CD4/CD8-lineage differentiation in the thymus:
from nuclear effectors to membrane signals. Nat Rev Immunol
2004, 4:529-40.
Chen W, Perruche S, Li J: CD4+ CD25+ T regulatory cells and
TGF-beta in mucosal immune system: the good and the bad.
Curr Med Chem 2007, 14:2245-9.
Min B, Thornton A, Caucheteux SM, Younes SA, Oh K, Hu-Li J, Paul
WE: Gut flora antigens are not important in the maintenance
of regulatory T cell heterogeneity and homeostasis. Eur J
Immunol 2007, 37:1916-23.
Bollyky PL, Lord JD, Masewicz SA, Evanko SP, Buckner JH, Wight TN,
Nepom GT: Cutting edge: high molecular weight hyaluronan
promotes the suppressive effects of CD4+ CD25+ regulatory
T cells. J Immunol 2007, 179:744-7.
Seddiki N, Santner-Nanan B, Tangye SG, Alexander SI, Solomon M,
Lee S, Nanan R, Fazekas de Saint Groth B: Persistence of naive
Blood 2006,
CD45RA+ regulatory T cells in adult life.
107:2830-8.
Kawahata K, Misaki Y, Yamauchi M, Tsunekawa S, Setoguchi K, Miyazaki J, Yamamoto K: Generation of CD4+ CD25+ regulatory T
cells from autoreactive T cells simultaneously with their
negative selection in the thymus and from nonautoreactive
T cells by endogenous TCR expression. J Immunol 2002,
168:4399-405.
Coutinho A, Caramalho I, Seixas E, Demengeot J: Thymic commitment of regulatory T cells is a pathway of TCR-dependent
selection that isolates repertoires undergoing positive or
negative selection. Curr Top Microbiol Immunol 2005, 293:43-71.
Page 13 of 13
(page number not for citation purposes)