a system dynamics computer model to assess the effects of developing an alternate water source on the water supply systems management
Bạn đang xem bản rút gọn của tài liệu. Xem và tải ngay bản đầy đủ của tài liệu tại đây (357.58 KB, 8 trang )
Available online at www.sciencedirect.com
ScienceDirect
Procedia Engineering 119 (2015) 753 – 760
13th Computer Control for Water Industry Conference, CCWI 2015
A system dynamics computer model to assess the effects of
developing an alternate water source on the water supply systems
management
Suwan Park*, Vahideh Sahleh, and So-Yeon Jung
Pusan National University, Busan 609-735, South Korea
Abstract
The purpose of developing alternate water sources is to secure water sources of sufficient quantity and high quality
due to water quality and/or quantity problems of an existing water source and, thereby, raise the level of consumer
satisfaction. Considering the enormous costs and the effects to the consumers and operation of water supply
enterprises, a technique to support long term management of water supply systems is needed. In this paper a System
Dynamics computer simulation model was developed to evaluate the effects of alternate water source development.
The System Dynamics model was used for the simulation of the effects of the alternate water source development
project in Busan, South Korea.
©2015
2015The
The
Authors.
Published
by Elsevier
Ltd.
©
Authors.
Published
by Elsevier
Ltd. This
is an open access article under the CC BY-NC-ND license
( />Peer-review under responsibility of the Scientific Committee of CCWI 2015.
Peer-review under responsibility of the Scientific Committee of CCWI 2015
Keywords: alternate water source; computer model; simulation; system dynamics; water supply
1. Introduction
Due to the nature of water as public goods, many water supply services globally have been confronted with
various problems, such as difficulties in the efficient operation of their systems, problems with management
structure, and a lack of competence in the technical skills of the personnel. The water supply services in South
Korea have also faced these problems and suffered from inefficient operation and poor finance. Therefore, it is
considered that understanding the components of the working mechanism of the systems, as well as the correlations
between them, is essential to appropriately analyze the problems associated with water supply systems and establish
policies that are appropriate for the problems of interest.
* Corresponding author: Suwan Park
E-mail address:
1877-7058 © 2015 The Authors. Published by Elsevier Ltd. This is an open access article under the CC BY-NC-ND license
( />Peer-review under responsibility of the Scientific Committee of CCWI 2015
doi:10.1016/j.proeng.2015.08.929
754
Suwan Park et al. / Procedia Engineering 119 (2015) 753 – 760
The purpose of developing alternate water sources is to secure water sources of sufficient quantity and high
quality due to water quality and/or quantity problems of an existing water source and, thereby, raise the level of
consumer satisfaction. In South Korea seven inter-regional water supply systems are planned to be constructed by
2017 with a budget of US $1.5 billion. Considering the enormous costs and the effects to the consumers and
operation of water supply enterprises, a technique to support long term management of water supply systems
including the period of before and after alternate water source development is needed.
A very useful and efficient methodology suited for modeling such multiple component systems, where these
components influence each other, is the System Dynamics (SD). In this paper, a SD computer simulation model has
been developed in this paper to aid the efficient management of water supply systems. To develop the SD computer
model the conceptual framework for the working mechanism of water supply systems was established and, then, the
causal feedback loop relationships among the components of the systems management including the management of
water pipes were identified. In this paper a SD computer simulation model was developed to evaluate the effects of
alternate water source development by improving the system dynamics model by [1]. The SD model was used for
the simulation of the effects of the alternate water source development project in Busan, South Korea, which is to
develop the riverbank water storage in Nak-Dong River as an alternate water source.
2. The Method
The System Dynamics Methodology developed by [2] is a simulation methodology based on systems theory. It
deals with the interpretation of the dynamic nature of systems in which information and material feedbacks are
present. The characteristics of systemic approaches adopted in the systems theory were well presented by [3] in
which 14 systemic ideas were provided, with each idea explained in terms of the associated philosophical concepts.
The methodology can facilitate understanding of a system by extracting structures essential to its working
mechanisms, and, based on an analysis of feedback structures inherent to the system, lead to development of
efficient management strategies.
Computer simulation models that are developed based on a system dynamics methodology are composed of four
basic components: stocks, flows, converters, and interrelations among them, which are graphically represented as
arrows and mathematically modelled as the finite difference equations. The value of each component is calculated at
each delta time (DT) for a specified simulation time period defined in a model, starting at the initial values of the
stocks, and based on the functional relations among components. Computer simulation experiments using a system
dynamics methodology are realized using object-oriented modelling software such as Vensim, Powersim Studio,
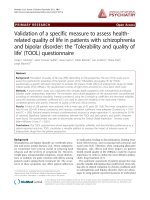
AnyLogic, STELLA, etc. Figure 1 provides an example of a system dynamics computer model that shows a causal
feedback loop diagram of a reservoir system with outflows and the corresponding stock-and-flow representation of
the model using STELLA.
F low R ate
W ater V olume
Water Volume
-
+
Outflow
+
Flow Rate
O utflow
Fig. 1. A causal diagram and the corresponding stock-and-flow model using STELLA.
755
Suwan Park et al. / Procedia Engineering 119 (2015) 753 – 760
3. The Developed System Dynamics Model
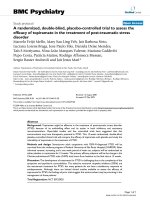
Figure 2 shows the stock and flow diagram of the computer model constructed using STELLA. The model is
composed of four sub-models: a water supply sub-model, pipe maintenance sub-model, water supply business, and
alternate water source sub-model. The water supply sub-model modelled the changes in the ‘supply ratio’ due to
population changes and pipeline extension, as well as the long-term changes in the ‘total (volume of) water
produced (per year) [m3/yr]’, which are affected by the changes in ‘leakage’ due to pipe deterioration. In the pipe
maintenance sub-model, the conditions of pipes were defined as ‘deteriorated pipes [km]’, ‘non-deteriorated pipes
[km]’ and ‘disposed-of pipes [km]’. In the water supply business finance sub-model, the indicators able to represent
the financial status of a water supply system were modelled, and included the ‘income’, ‘production costs’,
‘investment costs for pipe rehabilitation’ and ‘investment costs for pipe extension’. The simulation period used for
the model was from year 1999 to 2058.
water s upply
pipe maintanance
accumulated leakage deteriorated pipes
yearly leakage per
unit deteriorated
pipe length
income per
unit dis pos ed of pipe
yearly
extended
length of pipe
leakage
total water
produced
yearly cons umed
water
non revenue water
dis pos ed lengths of
non deteriorated pipe
~
total population
water price
income
yearly price increas es
TAG 3
recognition of
profitability
inves tment cos ts
for pipe extens ion
yearly income
for disposed of pipe
delay time
inves tment
cos ts
recognition of changes
total balance ratio
revenue water
ratio
Alternate Water P roduction C os ts
target revenue
water ratio
total water
produced
Yrly NWP Activator
Yearly AO C
required length of
pipe rehabilitation
production cos ts
TAG 2
yearly consumed
water
yearly extended
length of pipe
Alternate Water S ource
C P I trend
yearly consumed
water
capital
yearly deteriorated
pipe length
investment costs
unit cos t of for pipe extension
pipe extens ion
water s upply bus ines s
prime cos t
deterioration rate of
non deteriorated pipe
non deteriorated
pipes
dis pos al rate for
non deteriorated pipe
daily cons umed water
per pers on
target price increas e
yearly rehabilitated
pipe length
yearly income
for dis pos ed of pipe
s erviced
population
investment costs for
pipe rehabilitation
dis pos ed lengths
of deteriorated pipe
rehabilitatied
pipe length
s upply ratio
improvement ratio
accumulated
non revenue water
deteriorated pipes
dipos ed of pipes
s upply ratio
accumulated total
water produced
unit cos t of
pipe rehabilitation
dis pos al rate for
deteriorated pipe
yearly s upply ratio changes
total water
produced
TAG 1
inves tment cos ts for
pipe rehabilitation
Yearly NWP
revenue water
improvement ratio
required cos ts
for pipe rehabilitation
unit cost of
pipe rehabilitation
Alternate Water P roduction
U nit C os ts for Alternate
Water P roduction
Total S ubs trate after
New D evelopment
supply ratio
required cos ts
supply ratio
improvement ratio for s upply ratio increas e
unit cost of
pipe extension
target s upply ratio
Net Mixed BO D after Alternate
Water S ource D evelopment
total exis ting
water produced
Yrly BO D E xceeding E xpected BO D
E xis ting Average
BO D
Bottled Water S ales
Alternate Water Average BO D
Fig. 2. The stock and flow diagram of the SD computer simulation model.
756
Suwan Park et al. / Procedia Engineering 119 (2015) 753 – 760
Table 1 ~ Table 4 show the initial values of the stock variables and the values or trend equations of the
exogenous variables used for the developed Water Supply Sector, Pipe Maintenance Sector, Water Supply Business
Finance Sector and Alternate Water Source Sector SD model. The initial values were obtained from [4] and the
values or trend equations of the exogenous variables were established based on the statistics reported in [4].
Table 1. Stock and exogenous variables of the Water Supply Sector
Variable Type
Stock
Converter
Variable Name
Initial Value/Function of Time
Unit
Supply rate
0.981
-
Accumulated leakage
81,378,000
m3
Accumulated metering under registration
75,982,000
m3
Accumulated Non-revenue water
79,323,000
m3
Accumulated total water produced
526,154,210
m3
Daily consumed water (volume) per person
254.96
ℓ/capita·day
Supply rate improvement ratio
1.75E-7·ln(time)+6.622E-6
(1/yr)/km
Yearly leakage per unit deteriorated pipe length
-0.10×time
27985·e
(/yr)/km
Table 2. Stock and exogenous variables of the Pipe Maintenance Sector
Variable Type
Stock
Converter
Variable Name
Initial Value/Function of Time
Unit
Non-deteriorated lengths
5504.2
km
Deteriorated lengths
2963.8
km
Accumulated disposed pipe
84.68
km
Unit cost of pipe rehabilitation
53548·time0.524
1,000 Won/km
Deterioration rate of non-deteriorated pipe
If time ≤ 5 then 0.075 else 0.03
1/year
Unit cost of service expansion
8176.47·ln(time)+113965.34
1,000 Won/km
Disposal rate of non-deteriorated pipe
If time ≤ 5 then 0.07 else if time > 13 then
0.010 else 0.004
1/year
Disposal rate of deteriorated pipe
If time ≤ 5 then 0.03 else 0.01
1/year
Income per unit disposed pipe
200
1,000 Won/km
Table 3. Stock and exogenous variables of the Water Supply Business Finance Sector
Variable Type
Stock
Converter
Variable Name
Initial Value/Function of Time
Unit
Capital
212,918,197
1,000 Won
Average unit water price
0.4754
1,000 Won/m3
Recognition of profitability
0.4
-
TAG 3
17
Year
Prime cost
0.018·time+0.603
1,000 Won/m3
Delay time
1
Year
TAG 1
10
Year
Target revenue water ratio
1
-
Revenue water improvement ratio
5451.66
km/%
TAG 2
4.5
Year
Unit Payback Price
0.223
1,000 Won/m3
Target service ratio
1
-
757
Suwan Park et al. / Procedia Engineering 119 (2015) 753 – 760
Table 4. Stock and exogenous variables of the Alternate Water Source Sector
Variable Type
Stock
Converter
Variable Name
Initial Value/Function of Time
Unit
Alternate Water Production Costs
0
1,000 Won
Alternate Water Production
0
m3
Existing Average BOD
-256.20·ln(time)+2635.62
mg/m3
Unit Costs for Alternate Water Production
0.0491
1,000 Won/m3
Alternate Water Average BOD
1000
mg/m3
Bottled Water Sales
if time ≤ 5 then -6077.2·time2 +
53225·time + 54555 else
101425·ln(time) - 5971
m3/yr
4. The Results of the Model Simulations
The results of the simulation were compared to the case of ‘No Alternate Water Source Development’. During
the simulation period the water supply rate was estimated to be slightly higher than the case of ‘No Alternate Water
Source Development’. The water revenue rate was close to the case of the ‘No Alternate Water Source Development’
scenario. The water rate was expected to become about half of that of the ‘No Alternate Water Source Development’
case from year 2041. These model simulations results are shown in Figure 3 ~ Figure 5.
The curves with the designation of ‘1’ and ‘2’ in Figure 3 ~ Figure 4 represent the model simulation results for
the case of ‘Alternate Water Source Development’ and ‘No Alternate Water Source Development’, respectively. If
the alternate water source is developed, the supply rate is expected to be increased slightly more than the case of ‘No
Alternate Water Source Development’ as shown in Figure 3 due to the low total water production costs in the case
of alternate water development and alternate water development costs. This results from the structure of the model
in which the water production costs at the water treatment plant is reduced due to the reduction of total volume of
water treated as much as the volume of the alternate water source developed. Since the reduction of the total costs
for water treatment is less than the payment for the alternate water source development to the K-Water, the causal
structure of the model inevitably leads to the improved budget balance ratio and subsequently increased pipe
network expansion, which is the main cause of the supply rate increase.
The length of deteriorated pipes in Busan, as shown in Figure 4, for the case of ‘Alternate Water Source
Development’ is predicted to be about 250 km less than the case of ‘No Alternate Water Source Development’ in
year 2040. This is due to the causal structure of the model in which the budget balance ratio gets improved for the
case of ‘Alternate Water Source Development’ and the investment for pipe maintenance is increased subsequently
due to the improved budget balance ratio.
Figure 5 shows the results of the various simulation scenarios regarding the water rate in Busan. The curve
number ‘1’ represents the expected changes in the water rate for the case of ‘No Alternate Water Source
Development’, 2’ the case of ‘Alternate Water Source Development’ with the reduction of water production in the
existing water treatment facility in Busan as much as the volume of the developed alternate water source production,
‘3’ the case of ‘Alternate Water Source Development’ with the reduction of water production in the existing water
treatment facility in Busan as much as 50% of the volume of the developed alternate water source production, ‘4’
the case of ‘Alternate Water Source Development’ without any reduction of water production in the existing water
treatment facility in Busan, respectively.
G
758
Suwan Park et al. / Procedia Engineering 119 (2015) 753 – 760
Fig. 3. Simulation results of the supply rate.
Fig. 4. Simulation results of the deteriorated pipe length.
Suwan Park et al. / Procedia Engineering 119 (2015) 753 – 760
Fig. 5. Simulation results of the unit water price.
5. Conclusions
In this paper, an SD computer simulation model was presented to predict the long-term effects of developing an
alternate water source at Nak-Dong river bank storage in Busan, South Korea based on the causal feedback
relationships inherent in water supply systems management. The model simulation results indicated that major water
supply systems management index such as the water supply rate and revenue water ratio will be improved over the
simulation periods of 60 years from year 1999.
The aim of the model calibration in this study was to simulate the reported data as closely as possible. The
historical data reported in Busan Water Supply Authority [5] were used to calibrate and verify the constructed
computer model. The calibration process also took into account expert opinions of managerial personnel of the case
study system. During calibration, a comparison of the simulated results and historical data of the model variables
showed that the constructed model reasonably simulated the historical trends of the case study system.
Comparisons between the simulated results and historical data of the variables in the model during the
calibration showed that the constructed model reasonably simulated the historical trends of the case study system.
Through the scenario analyses illustrated in this paper, the SD model developed for water supply systems was
shown to be sufficient in identification of policy leverage, leading to efficient water supply system management; the
model could also be utilized to determine long-term effects of policy change on the status of a water supply system.
The principles associated with establishing the causal relationships used in the SD computer modeling and the
sensitivity analysis methods for exogenous variables used for identifying policy leverages are also expected to work
as prototypical methods for modeling and solving the management problems of other water supply systems.
Acknowledgements
This research was supported by Basic Science research Program through the National Research Foundation of
Korea(NRF) funded by the Ministry of Education (NRF-2013R1A1A2012099).
759
760
Suwan Park et al. / Procedia Engineering 119 (2015) 753 – 760
References
[1] S. Park, K. Kim, B.J. Kim, K. Lim, Development of a System Dynamics Model to Support the Decision Making
Processes in the Operation and Management of Water Supply Systems, Journal of Korea Water Resources
Association, 43(7) (2010) 609 – 623. (in Korean)
[2] J. W. Forrester, Industrial dynamics, Pegasus Communications, Waltham, MA, 1961.
[3] A.N. Beard. Some Ideas on a Systemic Approach. Civil Engineering and Environmental Systems. 16(3) (1999)
197-209.
[4] Busan Water Supply Authority, 1999 Statistics on Water Supply Services. Busan, Republic of Korea, 2000.
[5] Busan Water Supply Authority, 2013 Statistics on Water Supply Services. Busan, Republic of Korea, 2014.