analysis of chromobacterium sp natural isolates from different brazilian ecosystems
Bạn đang xem bản rút gọn của tài liệu. Xem và tải ngay bản đầy đủ của tài liệu tại đây (661.59 KB, 9 trang )
BMC Microbiology
BioMed Central
Open Access
Research article
Analysis of Chromobacterium sp. natural isolates from different
Brazilian ecosystems
Cláudia I Lima-Bittencourt1, Spartaco Astolfi-Filho2, Edmar ChartoneSouza1, Fabrício R Santos1 and Andréa MA Nascimento*1
Address: 1Departamento de Biologia Geral, Instituto de Ciências Biológicas, Universidade Federal de Minas Gerais, Belo Horizonte, Minas Gerais,
Brazil. Av. Antônio Carlos, 6627, CEP: 31.270-901, Brazil and 2Universidade Federal do Amazonas, Manaus, Amazonas, Brazil
Email: Cláudia I Lima-Bittencourt - ; Spartaco Astolfi-Filho - ; Edmar ChartoneSouza - ; Fabrício R Santos - ; Andréa MA Nascimento* -
* Corresponding author
Published: 21 June 2007
BMC Microbiology 2007, 7:58
doi:10.1186/1471-2180-7-58
Received: 1 November 2006
Accepted: 21 June 2007
This article is available from: />© 2007 Lima-Bittencourt et al; licensee BioMed Central Ltd.
This is an Open Access article distributed under the terms of the Creative Commons Attribution License ( />which permits unrestricted use, distribution, and reproduction in any medium, provided the original work is properly cited.
Abstract
Background: Chromobacterium violaceum is a free-living bacterium able to survive under diverse
environmental conditions. In this study we evaluate the genetic and physiological diversity of
Chromobacterium sp. isolates from three Brazilian ecosystems: Brazilian Savannah (Cerrado),
Atlantic Rain Forest and Amazon Rain Forest. We have analyzed the diversity with molecular
approaches (16S rRNA gene sequences and amplified ribosomal DNA restriction analysis) and
phenotypic surveys of antibiotic resistance and biochemistry profiles.
Results: In general, the clusters based on physiological profiles included isolates from two or more
geographical locations indicating that they are not restricted to a single ecosystem. The isolates
from Brazilian Savannah presented greater physiologic diversity and their biochemical profile was
the most variable of all groupings. The isolates recovered from Amazon and Atlantic Rain Forests
presented the most similar biochemical characteristics to the Chromobacterium violaceum ATCC
12472 strain. Clusters based on biochemical profiles were congruent with clusters obtained by the
16S rRNA gene tree. According to the phylogenetic analyses, isolates from the Amazon Rain Forest
and Savannah displayed a closer relationship to the Chromobacterium violaceum ATCC 12472.
Furthermore, 16S rRNA gene tree revealed a good correlation between phylogenetic clustering
and geographic origin.
Conclusion: The physiological analyses clearly demonstrate the high biochemical versatility found
in the C. violaceum genome and molecular methods allowed to detect the intra and inter-population
diversity of isolates from three Brazilian ecosystems.
Background
Chromobacterium violaceum is a Gram-negative bacterium
found in the environment as a saprophyte, in a wide variety of tropical and subtropical ecosystems, primarily in
water and soil [1]. It is a β-Proteobacterium that is of great
biotechnological interest due to its wide potential for
industrial, pharmacological and ecological use [2].
This free-living bacterium presents a high flexibility to survive in the most diverse environments [3]. Its biological
Page 1 of 9
(page number not for citation purposes)
BMC Microbiology 2007, 7:58
characteristics make C. violaceum a major component of
the microbiota in tropical ecosystems. In Brazil, C. violaceum is present in three main ecosystems: the Amazon
Rain Forest (AmF) [4], the Brazilian Savannah (BS), also
called Cerrado, and the Atlantic Rain Forest (AtF), which
are considered biodiversity hotspots [5]. These three ecosystems encompass altogether almost 50% of the total
area in the Neotropical region.
The complete genome of C. violaceum strain ATCC 12472
confirmed its considerable potential for several biotechnological applications [6]. However, it should be pointed
out that the genome was sequenced from a laboratory
strain, which does not necessarily reflect the diversity of
natural isolates of the same species. Besides, the
sequenced strain ATCC 12472 was isolated from soil in
Malaysia, and it has been maintained in the laboratory for
many years. Therefore, the aims of this study are focused
in the evaluation of the genetic and physiological diversity
of C. violaceum isolated from three Brazilian ecosystems.
In addition, we performed phylogenetic analyses of the
isolates along with other members of the Neisseriaceae
family by using 16S rRNA gene sequences and amplified
ribosomal DNA restriction analysis (ARDRA). We have
also compared the phylogenetic trees with the phenogram
based on the antimicrobial resistance and biochemical
tests of the isolates.
Results
Phenotypic characterization
Forty three isolates (26, 11 and 6 from Brazilian Savannah, Amazon and Atlantic Rain Forests, respectively) were
analyzed in this study. None of the isolates was able to
grow at 4°C and all grew at 15°C,25°C and 37°C.
Although in early stages all isolates showed violet pigmentation, either on solid or liquid medium, the color intensity was variable. In addition, after several subcultures,
some isolates stopped presenting the typical pigmentation.
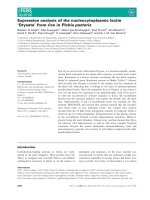
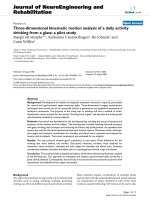
Data from API 20E and additional tests are summarized in
Table 1 and Fig. 1. The API 20E system failed to identify
any isolate including the ATCC 12472 strain as being C.
violaceum. The isolates recovered from Amazon and Atlantic Rain Forests were the most similar to the ATCC 12472
strain characteristics (Table 1). The ATCC 12472 strain fermented neither glucose nor sucrose, and only 9% of isolates from Amazon Rain Forest fermented the two
substrates simultaneously. On the other hand, all the isolates from Atlantic Rain Forest fermented glucose and
none fermented sucrose. In addition, no isolate from
Atlantic and Amazon Rain Forests used citrate as carbon
source, in accordance with Bergey's manual of systematic
bacteriology [7]. The isolates from Brazilian Savannah
presented greater physiologic diversity. Only two out of
/>
22 biochemical tests performed (H2S and TDA) did not
produce a reaction in the Brazilian Savannah's isolates.
The phenogram derived from biochemical profiles data is
shown in Fig. 1. Four main clusters were found. Cluster 1
comprised four isolates from Brazilian Savannah, and its
biochemical profile was the most dissimilar of all groupings. Cluster 2 consisted of eight isolates from Atlantic
and Amazon Rain Forests. In this clustering analysis, the
isolates from Amazon Rain Forest showed the same biochemical profile and five isolates from Atlantic Rain Forest also shared a common biochemical profile. Cluster 3
included 11 isolates from Amazon Rain Forest and Brazilian Savannah and also the ATCC 12472 strain. Three isolates presented the same biochemical profile as the ATCC
12472 strain. The third and largest cluster was formed by
20 isolates from Amazon Rain Forest and Brazilian Savannah, the majority of isolates was coming from the later
ecosystem.
The degree of resistance in the three populations of the
isolates is given by MIC for 50% (MIC50) and 90%
(MIC90) of isolates (Table 2). Analysis of MIC revealed
that, as expected, there was a wide range in the inhibitory
concentration to a particular antimicrobial agent as well
as among the populations. As expected, β-lactam-resistant
isolates were predominant. The isolates 12BS and 59AtF
were the only ones to be inhibited by < 2 μg/ml of ampicillin. In order to analyze β-lactamase production, a colorimetric assay was performed in the isolates resistant to
ampicillin. We found that all isolates were β-lactamase
producers.
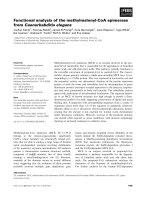
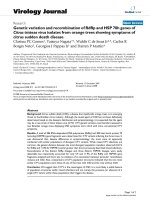
A phenogram based on the MIC profiles revealed that
almost all isolates exhibited a distinct profile for a combination of the used antibiotics. However, some isolates
presented identical patterns (Fig. 2). The main clusters
were defined with a cut off similarity of about 50%. Cluster 3 was exclusively formed by isolates from Brazilian
Savannah. Clusters 1, 2, 4 and 5 grouped isolates from the
three ecosystems whereas the type strain was included in
cluster 2. Cluster 4, the largest group formed by 13 isolates, mainly from Brazilian Savannah with two pairs of
isolates showing identical MIC profiles.
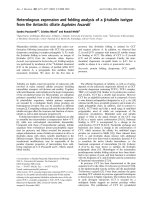
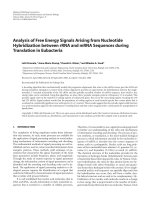
16S rRNA gene analysis
The sequences analyzed in this study ranged from positions 99 to 483 of the 16S rRNA gene. The phylogenetic
tree showed that isolates usually clustered according to
their geographic origin. The only exception was the Amazon isolate 52ERF, which grouped with Atlantic Rain Forest isolates (Fig. 3). In order to compare the association
between genetic similarity and specific features of the ecosystems, we used the UniFrac metric analysis. This analysis
revealed three main clusters of related isolates that match
Page 2 of 9
(page number not for citation purposes)
BMC Microbiology 2007, 7:58
/>
Table 1: Phenotypic characteristics of Chromobacterium sp. isolates.
Biochemical Characteristics
Percentage of positive bacterial isolates
Geographic Regions
β-galactosidase (ONPG)
Arginine dihydrolase (ADH)
Lysine decarboxylase (LDC)
Ornithine decarboxylase (ODC)
Citrate (CIT)
H2S production (H2S)
Urease (URE)
Tryptophanane deaminase (TDA)
Indole production (IND)
Acetoin production (VP)
Gelatinase (GEL)
Fermentation/oxidation:
Glucose (GLU)
Mannitol (MAN)
Inositol (INO)
Sorbitol (SOR)
Rhamnose (RHA)
Sucrose (SAC)
Melibiose (MEL)
Amygdalin (AMY)
Arabinose (ARA)
Motility (MOT)
MacConkey (McC)
Type strain
ERF (11)*
AF (6)
BS (26)
+
+
0
91
0
0
0
0
0
0
64
36
100
0
100
0
0
0
0
0
0
100
100
83
19
50
15
12
46
0
19
0
8
69
73
+
+
9
0
0
0
0
9
0
0
0
100
82
100
0
0
0
0
0
0
0
0
83
83
19
19
4
19
8
12
15
15
8
81
85
* number of isolates; + positive; - negative.
the geographic origin. The robustness of the inferred UniFrac tree topology to the presence of specific isolates represented was confirmed by jackknife analysis (P < 0.001).
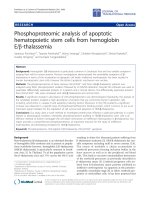
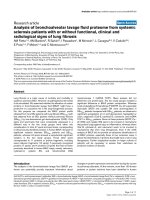
Principal components analyses also suggested that there
are significant differences among ecosystems (P < 0.001,
Fig. 4). The average similarity of 16S rRNA gene sequences
between the type strain and the isolates was of 98.5%. The
highest degree of similarity observed was between type
strain and Amazon Rain Forest isolates (99.6%). Indeed,
nine out of eleven Amazon Rain Forest isolates shared
identical 16S rRNA gene sequences with the type strain.
The lowest degree of average similarity observed was
between the type strain and Atlantic Rain Forest isolates
with a value of 99.1%, and an individual from Brazilian
Savanah (1BS – Fig. 3) presented the highest divergence.
According to the phylogenetic analysis, isolates from
Amazon Rain Forest and Brazilian Savannah seemed to
have a closer relationship with the type strain than isolates
from Atlantic Rain Forest.
ARDRA analysis
The complete 16S rRNA gene amplicon was digested separately with three restriction enzymes. Each endonuclease
generated three to five profiles: BfaI (three profiles), AflIII
(four profiles) and NlaIV (five profiles). In this study,
ARDRA profiles were obtained for 31 isolates and four
main clusters were identified (Fig. 5). Brazilian Savannah
isolates were grouped in two separate clusters that were
previously identified as cluster 1 in the 16S rRNA
sequence tree (Fig. 2). Cluster 2 assembled all isolates
from Atlantic Rain Forest, found in 16S rRNA gene cluster,
plus 40BS and 47AmF belonging to clusters 1 and 3,
respectively, of 16S rRNA gene tree. Cluster 3 presented a
similar grouping as presented by the 16S rRNA gene
sequence phylogeny (Fig. 3).
Discussion
The isolates in this study used more different substrates
than the type strain. In agreement with the specifications
of the API 20E kit for identification of the C. violaceum
species, 99% of the strains express the enzyme arginine
dihydrolase, and they are gelatinase positive, glucose fermenters, mobile, and grow in MacConkey agar. Seventy
five percent of the strains use citrate as a source of carbon.
Only 14% produce indol, and 10% ferment sucrose.
However, Holt and Krieg [6], in Bergey's Manual of Systematic Bacteriology, require other positive tests to consider a microorganism as C. violaceum. For instance, 60%
Page 3 of 9
(page number not for citation purposes)
BMC Microbiology 2007, 7:58
/>
tive genomic analyses revealed a large number of antibiotic resistance genes. Among the 57 genes found, the most
important ones were those related to β-lactam and multidrug resistance [10]. In the present study, we observed a
great variety of susceptibility profiles in the environmental isolates. As expected, the isolates were more resistant to
β-lactam antibiotics. However, the resistance to aminoglycosides was also high, but no resistance genes for these
antibiotics were identified in C. violaceum genome so far.
Again, the isolates from Brazilian Savannah were distinguished from the other ecosystems as they presented
higher values of MIC90 for ten antibiotics and for mercury. The only exception was the resistance for tetracycline, which was higher in Amazon Rain Forest isolates. In
contrast, the isolates from Atlantic Rain Forest were more
divergent, presenting lower MIC90 values.
FigureATCC
Cluster
aceum
1
analysis
12472
of Chromobacterium
according to API
sp.20E
isolates
profiles
and of C. violCluster analysis of Chromobacterium sp. isolates and
of C. violaceum ATCC 12472 according to API 20E
profiles. A distance matrix of simple similarity coefficients
was clustered with the UPGMA algorithm.
of the described strains ferment sorbitol and 50% ferment
rhamanose, whereas the API 20E testing kit manual
affirms that no strain use those two substrates.
It is also important to consider that environmental isolates can modify their physiological characteristics
because of nutrients availability. In addition, changes in
gene expression can occur to reduce the energy expenses
[8]. Thus, the physiological variation found in the isolates
in this study can be explained by the differences in the
nutrient supply of this environment causing changes in
phenotype expression or acquisition of inherited adaptive
characteristics by horizontal gene transfer or selective
pressure. Furthermore, the similar physiological characteristics found in the isolates from the Amazon and Atlantic Rain Forests can be related to the slightly resemblance
of the two environments. Both are forests with high precipitation rate and comparable ecological characteristics.
C. violaceum is a free-living bacterium which can rarely
become an opportunist pathogen infecting humans. Antimicrobial susceptibility data usually are obtained from
clinical cases [9]. After the genome sequencing, compara-
Although the 16S rRNA gene is not usually suitable for
analysis of intraspecific diversity, the chosen region
presents the most heterogeneous part of the entire gene
[11]. The data obtained herein demonstrated that this
method allowed grouping the Chromobacterium sp. isolates according to geographical regions. In contrast, other
bacteria (Escherichia coli, Salmonella enterica, Bacillus cereus
and B. anthracis) present lower 16S rRNA genetic diversity,
particularly considering the single cluster observed in B.
cereus and B. anthracis (100% similarity, data not shown).
These data are interesting since the E. coli complete
genomes [12] reveal a large genomic variability as length
and gene content, although the genetic diversity in 16S
rRNA genes is not as high in the E. coli sequenced
genomes, as in Chromobacterium sp. Therefore, for Chromobacterium sp. isolates we could expect the same or more
genome variability due to its apparently high genetic and
phenotypic diversity. In addition, the physiological methods revealed similar genetic diversity to 16S rRNA data.
Clusters based on biochemical profiles were congruent
with clusters obtained by the 16S rRNA gene tree.
The biochemical phenogram and the phylogenetic tree
indicated a high genetic and phenotypic diversity of the
Brazilian Savannah isolates, which were quite distinct
from the reference strain. The ARDRA method demonstrated to be useful for intraspecific analysis. This method
revealed a remarkable diversity of Brazilian Savannah isolates which formed two clusters, while these isolates were
identical in the 16S rRNA gene sequence analysis. On the
other hand, Atlantic Rain Forest isolates demonstrated
lower genetic diversity as illustrated by ARDRA, biochemical and MIC profiles. Interestingly, these isolates demonstrated to be more susceptible to aminoglycosides. It
should be pointed out that one of the resistance mechanisms to aminoglycosides relies on mutations in the 16S
rRNA gene, which could be related to the lower genetic
diversity found in the isolates from Atlantic Rain Forest.
Page 4 of 9
(page number not for citation purposes)
BMC Microbiology 2007, 7:58
/>
Table 2: Minimum inhibitory concentration which 50% and 90% of Chromobacterium sp. isolates in the population overall are inhibited
(μgml-1).
Origin
BS
AF
ERF
Antimicrobial
s
Range
Type strain
MIC50
MIC90
MIC50
MIC90
MIC50
MIC90
Ap
Am
Cf
Ak
Gm
Km
Sm
Cm
Rf
Nx
Tc
Hg
2–1024
2–1024
2–128
2–128
2–128
2–128
2–128
2–128
2–128
2–128
2–128
2–16
1024
256
> 128
<2
<2
4
16
32
32
<2
<2
8
> 1024
1024
> 128
16
4
16
32
32
16
4
≤2
≤2
> 1024
> 1024
> 128
64
64
64
128
128
128
16
4
8
512
16
≤2
16
4
32
16
4
≤2
8
≤2
≤2
> 1024
256
≤2
16
8
32
16
16
≤2
8
≤2
≤2
1024
256
> 128
16
4
8
32
16
16
≤2
≤2
≤2
> 1024
1024
> 128
16
16
16
64
128
32
32
32
4
Conclusion
The physiological analyses clearly demonstrate the high
biochemical versatility found in C. violaceum genome.
Besides, the molecular methods revealed the genetic
diversity found within and between populations from
three Brazilian ecosystems investigated.
Methods
Study area
Serra do Cipó National Park (Brazilian Savannah or Cerrado) and Rio Doce State Park (Atlantic Rain Forest) are
located in the Minas Gerais State. Brazilian Savannah
presents vegetation composed mainly by grasses and
bushes, and the sampled river is located in high altitude
fields (> 1,200 m). The Atlantic Rain Forest site consists of
a State reserve that includes around 50 lagoons surrounded by primary and secondary forests. The Negro
River, the third sampling site, is a large tributary (1,750
Km) of the Amazon basin that presents dark transparent
water, located in the Amazon Rain Forest.
profilesATCC
Cluster
aceum
Figure
2
analysis
12472
of Chromobacterium
according to antimicrobial
sp. isolates susceptibility
and of C. violCluster analysis of Chromobacterium sp. isolates and
of C. violaceum ATCC 12472 according to antimicrobial susceptibility profiles. A distance matrix of simple
similarity coefficients was clustered with the UPGMA algorithm.
Water sampling
The water samples were collected in sterilized glass bottles
and stored on ice for until six hours, before subsequent
procedures in the laboratory. Each sample was collected at
a depth of approximately 15–20 cm from the surface.
Bacterial isolation and reference strain
Aliquots of 0.1 ml of sampled water were inoculated without dilution in Petri dishes containing 1/4 nutrient agar
(NA, Difco Laboratories) and incubated at 25°C up to
seven days. Bacterial isolates used for further studies were
Page 5 of 9
(page number not for citation purposes)
BMC Microbiology 2007, 7:58
/>
Figure
Phylogenetic
including3C. violaceum
tree based
ATCC
on 16S
12472
rDNA partial sequences of Chromobacterium sp.isolates and of strains used as references,
Phylogenetic tree based on 16S rDNA partial sequences of Chromobacterium sp. isolates and of strains used as
references, including C. violaceum ATCC 12472. One thousand bootstrap resamplings were used to evaluate robustness
of the inferred trees. AE016922, C. violaceum ATCC 12472; AB017487, Chromabacterium sp. MBIC3901; X07714, Neisseria gonorrhoeae and Y08846 and AF326087, Janthinobacterium lividum.
Page 6 of 9
(page number not for citation purposes)
BMC Microbiology 2007, 7:58
Figuregene
Principal
rRNA
4components analysis ordination plot for the 16S
Principal components analysis ordination plot for the
16S rRNA gene. The percent of variation explained by
each principal component is indicated on the axis labels. Ecosystems are represented by the following symbols: AmF ■,
AtF ●, and BS ▲.
/>
FigureATCC
Cluster
aceum
5
analysis
12472
of Chromobacterium
according ARDRA
sp.isolates
profilesand of C. violCluster analysis of Chromobacterium sp. isolates and
of C. violaceum ATCC 12472 according ARDRA profiles. A distance matrix of simple similarity coefficients was
clustered with the UPGMA algorithm. Numbers 1 to 3 identify the 16S rDNA sequence based phylogeny clusters
obtained with the Chromobacterium sp. isolates.
antimicrobials were obtained from Sigma Chemical Co.
and mercury was obtained from Merck Co.
purified from single violet colonies. Following, isolates
were incubated at 4°C, 15°C and 37°C on 1/4 NA [13].
C. violaceum ATCC 12472 was used as reference strain in
all analyses.
Detection of β-lactamase production
Beta-lactamase activity was tested with nitrocefin (Calbiochem, San Diego, Calif., USA) as described by Braga et. al
[14].
Biochemical and susceptibility testing
Clustering analysis of phenotypical tests
For cluster analysis, the data were converted into a binary
matrix, where the digit 1 represents the presence of a phenotypic character, and the digit 0 its absence. The similarity matrix was generated by Euclidean distances, which
were used to build a tree with the unweighted pair group
mean averages (UPGMA) algorithm. Analysis of phenotypic data was performed using the software PAST [15].
API20E (BioMérieux, Marcy l'Etoile, France) testing was
performed following the manufacturer's instructions. The
results were interpreted with the Analytical Profile Index
(API) database of the ApiLab Plus software (version 3.3.3;
BioMérieux, Marcy l'Etoile, France). Other tests were performed to detect motility using Motility Test Medium
(Difco Laboratories) and ability to grow in MacConkey
Agar (Difco Laboratories). The minimum inhibition concentration (MIC) was determined by the agar dilution
method performed in Mueller-Hinton medium (MH;
Difco Laboratories). Antimicrobial susceptibilities to
ampicillin (Ap), amoxicillin-clavulanic acid (Am), tetracycline (Tc), chloramphenicol (Cm), nalidixic acid (Nx),
rifampicin (Rf), amikacin (Ak), gentamicin (Gm), kanamycin (Km), streptomycin (Sm) cefotaxime (Cf) and the
heavy metal – mercury bichloride (Hg) were tested. All
16S ribosomal RNA gene amplification
The complete 16S rRNA gene was amplified by PCR using
the primers PA [16] and U2 [17]. Polymerase chain reaction mixtures (20 μl) consisted of 0.4 mM of each dNTP,
0.5 μM of each primer, 1 unit of Taq DNA polymerase
(Phoneutria, Brazil), and 40 ng of bacterial DNA. The
thermal cycling conditions consisted in one cycle at 95°C
for 10 min followed by 30 cycles of 30 s of denaturation
at 95°C, 40 s of annealing at 48°C, and 2 min of exten-
Page 7 of 9
(page number not for citation purposes)
BMC Microbiology 2007, 7:58
sion at 72°C, and a final extension step of 15 min at
72°C.
Amplified ribosomal RNA restriction analysis (ARDRA)
The amplicons were digested separately with BfaI, AflII
and NlaIV (New England BioLabs Inc.), according to the
supplier's instructions. BfaI, AflII and NlaIV were previously selected using the NEBcutter V2.0 software (New
England BioLabs Inc.). Restriction fragments were
resolved by 8% polyacrylamide gel electrophoresis and
the band patterns were compared in order to define operational taxonomic units (OTUs).
16S ribosomal RNA gene sequence analysis
The 16S rRNA gene partial sequencing was made utilizing
the primers PA and CFV1 (5' -TTAACGCTYGCACCCTACG- 3'). Sequencing reactions were performed by
using standard protocols with DYEnamic ET dye terminator kit (Amersham Biosciences) and the MegaBACE 1000
capillary sequencer (Amersham Biosciences). Each
sequence in forward and reverse directions was repeated
at least three times for every bacterial isolate. The 16S
rRNA gene sequences were basecalled, checked for quality, aligned and analyzed using Phred v.0.20425 [18],
Phrap v.0.990319 [19] and Consed 12.0 [20] software.
Phylogenetic analysis was inferred by MEGA 3 software
[21] using the neighbor-joining method [22] calculated
by the Kimura method [23]. One thousand bootstrap
resamplings were used to evaluate robustness of the
inferred trees. Additional 16S rRNA gene sequences of C.
violaceum (AE016922 and AB017487), Neisseria gonorrhoeae (X07714) and Janthinobacterium lividum (Y08846
and AF326087) were obtained from GenBank Database.
N. gonorrhoeae and J. lividum were used as outgroups. UniFrac [24] was used to test for statistical differences
between isolates from distinct ecosystems. First, a phylogenetic tree was built for the 16S rRNA gene sequences
using the neighbor-joining method as implemented in
MEGA 3. Second, a test was carried out to detect differences between isolates from distinct ecosystems and collecting times, using the UniFrac statistics software that
performed a principal components analyses.
/>
coordinated the project, and helped to write the final
manuscript. All authors have read and approved the final
manuscript.
Acknowledgements
We appreciate the financial support given by CAPES (Brazil) in the form of
a scholarship to C.I.Lima-Bittencourt. This work was supported by CNPq
(Brazil) grants 680220/00-5, 505730/2004-9 and FAPEMIG (Brazil). The
authors are especially grateful to Andréa Reis for laboratory assistance and
Daniela Pontes for sampling Chromobacterium sp in the Atlantic Forest.
References
1.
2.
3.
4.
5.
6.
7.
8.
9.
10.
11.
12.
13.
Nucleotide sequence accession number
The individual 16S rRNA gene sequences were deposited
in the GenBank Data Library under accession numbers
EF077669–EF077711.
14.
Authors' contributions
16.
CIL-B carried out laboratory work and wrote the draft of
manuscript. SAF was responsible for the Chromobacterium
sp. samples from the Amazon Rain Forest. FRS and ECS
helped to conceive the design of the study and to write the
final manuscript, as well as the sampling in the Savannah
together CIL-B. AMAN conceived the design of the study,
15.
17.
Duran N, Menck CF: Chromobacterium violaceum : a review of
pharmacological and industiral perspectives. Crit Rev Microbiol
2001, 27:201-222.
Carepo MS, Azevedo JS, Porto JI, Bentes-Sousa AR, Batista Jda S, Silva
AL, Schneider MP: Identification of Chromobacterium violaceum
genes with potential biotechnological application in environmental detoxification. Genet Mol Res 2004, 3:181-194.
Creczynski-Pasa TB, Antonio RV: Energetic metabolism of Chromobacterium violaceum . Genet Mol Res 2004, 3:162-166.
Hungria M, Astolfi-Filho S, Chueire LM, Nicolas MF, Santos EB, Bulbol
MR, Souza-Filho A, Nogueira Assuncao E, Germano MG, Vasconcelos
AT: Genetic characterization of Chromobacterium isolates
from black water environments in the Brazilian Amazon.
Lett Appl Microbiol 2005, 41:17-23.
Myers N, Mittermeier RA, Mittermeier CG, da Fonseca GA, Kent J:
Biodiversity hotspots for conservation priorities. Nature 2000,
403:853-858.
Brazilian National Genome Project Consortium: The complete
genome sequence of Chromobacterium violaceum reveals
remarkable and exploitable bacterial adaptability. Proc Natl
Acad Sci U S A 2003, 100:11660-11665.
Holt JG, Krieg NR: Bergey's manual of systematic bacteriology Baltimore/
Londres.: Oxoford Williams & Wilkins; 1984.
Palkova Z: Multicellular microorganisms: laboratory versus
nature. EMBO Rep 2004, 5:470-476.
Aldridge KE, Valainis GT, Sanders CV: Comparison of the in vitro
activity of ciprofloxacin and 24 other antimicrobial agents
against clinical strains of Chromobacterium violaceum . Diagn
Microbiol Infect Dis 1988, 10:31-39.
Fantinatti-Garboggini F, Almeida R, Portillo Vdo A, Barbosa TA,
Trevilato PB, Neto CE, Coelho RD, Silva DW, Bartoleti LA, Hanna ES,
Brocchi M, Manfio GP: Drug resistance in Chromobacterium violaceum . Genet Mol Res 2004, 3:134-147.
Patel JB: 16S rRNA gene sequencing for bacterial pathogen
identification in the clinical laboratory. Mol Diagn 2001,
6:313-321.
Binnewies TT, Motro Y, Hallin PF, Lund O, Dunn D, La T, Hampson
DJ, Bellgard M, Wassenaar Ussery DW: Ten years of bacterial
genome sequencing:comparative-genomics-based discoveries. Funct Integr Genomics 2006, 6:165-185.
Logan NA, Moss MO: Identification of Chromobacterium, Janthinobacterium and Iodobacterspecies. In Identification Methods in
Applied and Environmental Microbiology Edited by: Board RG. Oxford:
Blackwell Scientific Publications; 1992:183-192.
Braga LC, Leite AA, Xavier KG, Takahashi JA, Bemquerer MP, Chartone-Souza E, Nascimento AM: Synergic interaction between
pomegranate extract and antibiotics against Staphylococcus
aureus . Can J Microbiol 2005, 51:541-547.
Hammer Ø, Harper DAT, Ryan PD: PAST: paleontological statistics software package for education and data analysis. Palaeont Electr 2001, 4:1-9.
Kuske CR, Barns SM, Busch JD: Diverse uncultivated bacterial
groups from soils of the arid southwestern United States
that are present in many geographic regions. Appl Environ
Microbiol 1997, 63:3614-3621.
Lu JJ, Perng CL, Lee SY, Wan CC: Use of PCR with universal
primers and restriction endonuclease digestions for detection and identification of common bacterial pathogens in
cerebrospinal fluid. J Clin Microbiol 2000, 38:2076-2080.
Page 8 of 9
(page number not for citation purposes)
BMC Microbiology 2007, 7:58
18.
19.
20.
21.
22.
23.
24.
/>
Ewing B, Green P: Base-calling of automated sequencer traces
using phred. II. Error probabilities.
Genome Res 1998,
8:186-194.
Green P: Phrap.
1994 [ />UWGC/].
Gordon D, Abajian C, Green P: Consed: a graphical tool for
sequence finishing. Genome Res 1998, 8:195-202.
Kumar S, Tamura K, Nei M: MEGA3: Integrated software for
Molecular Evolutionary Genetics Analysis and sequence
alignment. Brief Bioinform 2004, 5:150-163.
Saitou N, Nei M: The neighbor-joining method: a new method
for reconstructing phylogenetic trees. Mol Biol Evol 1987,
4:406-425.
Kimura M: A simple method for estimating evolutionary rates
of base substitutions through comparative studies of nucleotide sequences. J Mol Evol 1980, 16:111-120.
Lozupone C, Hamady M, Knight R: UniFrac – An online tool for
comparing microbial community diversity in a phylogenetic
context. BMC Bioinformatics 2006, 7:371-384.
Publish with Bio Med Central and every
scientist can read your work free of charge
"BioMed Central will be the most significant development for
disseminating the results of biomedical researc h in our lifetime."
Sir Paul Nurse, Cancer Research UK
Your research papers will be:
available free of charge to the entire biomedical community
peer reviewed and published immediately upon acceptance
cited in PubMed and archived on PubMed Central
yours — you keep the copyright
BioMedcentral
Submit your manuscript here:
/>
Page 9 of 9
(page number not for citation purposes)