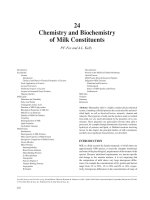
8 food biochemistry and food phần 84
Bạn đang xem bản rút gọn của tài liệu. Xem và tải ngay bản đầy đủ của tài liệu tại đây (239.91 KB, 5 trang )
P1: SFK/UKS
BLBS102-c22
P2: SFK
BLBS102-Simpson
March 21, 2012
13:41
Trim: 276mm X 219mm
Printer Name: Yet to Come
22
Application of Proteomics to Fish
Processing and Quality
H´olmfr´ıður Sveinsd´ottir, Samuel A. M. Martin, and Oddur T. Vilhelmsson
Proteomics Methodology
Two-Dimensional Electrophoresis
Basic 2DE Methods Overview
Sample Extraction and Cleanup
First-Dimension Electrophoresis
Equilibration
Second-Dimension Electrophoresis
Staining
Analysis
Some Problems and Their Solutions
Identification by Peptide Mass Fingerprinting
Seafood Proteomics and Their Relevance to Processing and
Quality
Early Development and Proteomics of Fish
Changes in the Proteome of Early Cod Larvae in
Response to Environmental Factors
Tracking Quality Changes Using Proteomics
Antemortem Effects on Quality and Processability
Species Authentication
Identification and Characterization of Allergens
Impacts of High Throughput Genomic and Proteomic
Technologies
References
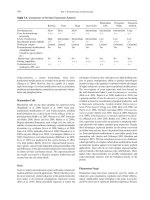
Abstract: Proteomics involves the study of proteins, with regards to
proteins, their expression by genomes, their structures and functions.
The entire set of proteins or proteome expressed by a genome display
variations in tissues and organisms, and can be used as the basis for
evaluating the status and changes in the proteins in living organisms
including fish and shellfish. This feature can be useful for developing
standards for fish and other food materials and assessing their quality
and/or safety. This chapter discusses current uses of proteomics for
establishing the attributes of fish and fish products.
Proteomics is most succinctly defined as “the study of the entire
proteome or a subset thereof,” the proteome being the expressed
protein complement of the genome. Unlike the genome, the
proteome varies among tissues, as well as with time in reflection of the organism’s environment and its adaptation thereto.
Proteomics can, therefore, give a snapshot of the organism’s
state of being and, in principle at least, map the entirety of its
adaptive potential and mechanisms. As with all living matter,
foodstuffs are in large part made up of proteins. This is especially true of fish and meat, where the bulk of the food matrix
is constructed from proteins. Furthermore, the construction of
the food matrix, both on the cellular and tissue-wide levels, is
regulated and brought about by proteins. It stands to reason,
then, that proteomics is a tool that can be of great value to the
food scientist, giving valuable insight into the composition of
the raw materials, quality involution within the product before,
during, and after processing or storage, the interactions of proteins with one another or with other food components, or with
the human immune system after consumption. In this chapter,
a brief overview of “classical” proteomics methodology is presented, and their present and future application in relation to fish
and seafood processing and quality is discussed.
PROTEOMICS METHODOLOGY
Unlike nucleic acids, proteins are an extremely variegated group
of compounds in terms of their chemical and physical properties. It is not surprising, then, that a field that concerns itself
with “the systematic identification and characterization of proteins for their structure, function, activity and molecular interactions” (Peng et al. 2003) should possess a toolkit containing
a wide spectrum of methods that continue to be developed at
a brisk pace. While high-throughput, gel-free methods, for example, based on liquid chromatography tandem mass spectrometry (LC-MS/MS) (Peng et al. 2003), surface-enhanced laser
desorption/ionization (Hogstrand et al. 2002), or protein arrays
(Lee and Nagamune 2004), hold great promise and are deserving of discussion in their own right, the “classic” process of
Food Biochemistry and Food Processing, Second Edition. Edited by Benjamin K. Simpson, Leo M.L. Nollet, Fidel Toldr´a, Soottawat Benjakul, Gopinadhan Paliyath and Y.H. Hui.
C 2012 John Wiley & Sons, Inc. Published 2012 by John Wiley & Sons, Inc.
406
P1: SFK/UKS
BLBS102-c22
P2: SFK
BLBS102-Simpson
March 21, 2012
13:41
Trim: 276mm X 219mm
Printer Name: Yet to Come
22 Application of Proteomics to Fish Processing and Quality
407
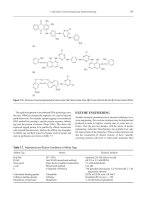
Figure 22.1. An overview over the “classic approach” in proteomics. First, a protein extract (crude or fractionated) from the tissue of choice is
subjected to two-dimensional polyacrylamide gel electrophoresis (2D-PAGE). Once a protein of interest has been identified, it is excised from
the gel, subjected to degradation by trypsin (or other suitable protease) and the resulting peptides analyzed by mass spectrometry (MS),
yielding a peptide mass fingerprint. In many cases, this is sufficient for identification purposes, but if needed, peptides can be dissociated into
smaller fragments and small partial sequences obtained by tandem mass spectrometry (MS/MS). See text for further details.
two-dimensional electrophoresis (2DE) followed by protein
identification via peptide mass fingerprinting of trypsin digests
(Fig. 22.1) remains the workhorse of most proteomics work,
largely because of its high resolution, simplicity, and mass accuracy. This “classic approach” will, therefore, be the main focus of
this chapter. A number of reviews on the advances and prospects
of proteomics within various fields of study are available. Some
recent ones include: Andersen and Mann (2006), Balestrieri
et al. (2008), Beretta (2009), Bogyo and Cravatt (2007), Drabik
et al. (2007), Ikonomou et al. (2009), Issaq and Veenstra (2008),
Jorrin-Novo et al. (2009), Latterich et al. (2008), L´opez (2007),
Mamone et al. (2009), Malmstrom et al. (2007), Premsler et al.
(2009), Smith et al. (2009), Wang et al. (2006), Wilm (2009),
Yates et al. (2009).
Two-Dimensional Electrophoresis
2DE, the cornerstone of most proteomics research, is the simultaneous separation of hundreds, or even thousands, of proteins on a two-dimensional polyacrylamide slab gel. The potential of a two-dimensional protein separation technique was
realized early on, with considerable development efforts taking
place in the 1960s (Margolis and Kenrick 1969, Kaltschmidt
and Wittmann 1970). The method most commonly used today
was developed by Patrick O’Farrell. It is described in his seminal
and thorough 1975 paper (O’Farrell 1975) and is outlined briefly
later. It is worth emphasizing that great care must be taken that
the proteome under investigation is reproducibly represented on
the 2DE gels, and that individual variation in specific protein
P1: SFK/UKS
BLBS102-c22
P2: SFK
BLBS102-Simpson
March 21, 2012
13:41
408
Trim: 276mm X 219mm
Printer Name: Yet to Come
Part 3: Meat, Poultry and Seafoods
abundance is taken into consideration by running gels from a
sufficient number of samples and performing the appropriate
statistics. Pooling samples may also be an option, depending on
the type of experiment.
67 kDa
Basic 2DE Methods Overview
43 kDa
30 kDa
21 kDa
14 kDa
4
pI
7
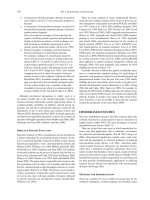
Figure 22.2. A two-dimensional electrophoresis protein map of
rainbow trout (Oncorhynchus mykiss) liver proteins with pI between
4 and 7 and molecular mass about 10–100 (S. Martin, unpublished).
The proteins are separated according to their pI in the horizontal
dimension and according to their mass in the vertical dimension.
Isoelectro focussing was by pH 4–7 immobilized pH gradient (IPG)
strip and the second dimension was in a 10–15% gradient
polyacrylamide slab gel.
O’Farrell’s original 2DE method first applies a process called
isoelectric focusing (IEF), where an electric field is applied to
a tube gel on which the protein sample and carrier ampholytes
have been deposited. This separates the proteins according to
their molecular charge. The tube gel is then transferred onto
a polyacrylamide slab gel and the isoelectrically focused proteins are further separated according to their molecular mass
by conventional sodium dodecyl sulfate–polyacrylamide gel
electrophoresis (SDS-PAGE), yielding a two-dimensional map
(Fig. 22.2) rather than the familiar banding pattern observed in
one-dimensional SDS-PAGE. The map can be visualized and
individual proteins quantified by radiolabeling or by using any
of a host of protein dyes and stains, such as Coomassie blue,
silver stains, or fluorescent dyes. By comparing the abundance
of individual proteins on a number of gels (Fig. 22.3), upregulation or downregulation of these proteins can be inferred. Although a number of refinements have been made to 2DE since
O’Farrell’s paper, most notably, the introduction of immobilized
pH gradients (IPGs) for IEF (Găorg et al. 1988), the procedure
Figure 22.3. A screenshot from the two-dimensional electrophoresis analysis program Phoretix 2-D (NonLinear Dynamics, Gateshead, Tyne
& Wear, UK) showing some steps in the analysis of a two-dimensional protein map. Variations in abundance of individual proteins, as
compared with a reference gel, can be observed and quantified.
P1: SFK/UKS
BLBS102-c22
P2: SFK
BLBS102-Simpson
March 21, 2012
13:41
Trim: 276mm X 219mm
Printer Name: Yet to Come
22 Application of Proteomics to Fish Processing and Quality
remains essentially as outlined earlier. In the following sections,
a general protocol is outlined briefly with some notes of special
relevance to the seafood scientist. For more detailed, up-to-date
protocols, the reader is referred to any of a number of excellent
reviews and laboratory manuals such as Berkelman and Stenstedt (1998), Găorg et al. (2000, 2004), Kraj and Silberring (2008),
Link (1999), Simpson (2003), Walker (2005) and Westermeier
and Naven (2002).
Sample Extraction and Cleanup
For most applications, sample treatment prior to electrophoresis
should be minimal in order to minimize in-sample proteolysis
and other sources of experimental artifacts. We have found direct
extraction into the gel reswelling buffer (7-M urea, 2-M thiourea,
4% (w/v) CHAPS [3-(3-chloramidopropyl)dimethylamino1-propanesulfonate], 0.3% (w/v) DTT [dithiothreitol], 0,5%
Pharmalyte ampholytes for the appropriate pH range), supplemented with a protease inhibitor cocktail, to give good
results for proteome extraction from whole Atlantic cod larvae
(Guðmundsd´ottir and Sveinsd´ottir 2006, Sveinsd´ottir et al.
2008) and Arctic charr (Salvelinus alpinus) liver (Coe and
Vilhelmsson 2008). Thorough homogenization is essential to
ensure complete and reproducible extraction of the proteome.
Cleanup of samples using commercial two-dimensional sample
cleanup kits may be beneficial for some sample types.
First-Dimension Electrophoresis
The extracted proteins are first separated by IEF, which is most
conveniently performed using commercial dry IPG gel strips.
These strips consist of a dried IPG-containing polyacrylamide
gel on a plastic backing. Ready-made IPG strips are currently
available in a variety of linear and sigmoidal pH ranges. This
method is thus suitable for most 2DE applications and has all
but completely replaced the older and less reproducible method
of IEF by carrier ampholytes in tube gels. Broad-range linear
strips (e.g., pH 3–10) are commonly used for whole-proteome
analysis of tissue samples, but for many applications narrowrange and/or sigmoidal IPG strips may be more appropriate as
these will give better resolution of proteins in the fairly crowded
pI 4–7 range. Narrow-range strips also allow for higher sample
loads (since part of the sample will run off the gel) and thus may
yield improved detection of low-abundance proteins.
Before electrophoresis, the dried gel needs to be reswelled to
its original volume. A recipe for a typical reswelling buffer is
presented earlier. Reswelling is normally performed overnight
at 4◦ C. Application of a low-voltage current may speed up the
reswelling process. Optimal conditions for reswelling are normally provided by the IPG strip manufacturer. If the protein
sample is to be applied during the reswelling process, extraction
directly into the reswelling buffer is recommended.
IEF is normally performed for several hours at high voltage
and low current. Typically, the starting voltage is about 150
V, which is then increased step-wise to about 3500 V, usually
totaling about 10,000 to 30,000 Vh, although this will depend
on the IPG gradient and the length of the strip. The appropriate
409
IEF protocol will depend not only on the sample and IPG strip,
but also on the equipment used. The manufacturer’s instructions
should be followed. Găorg et al. (2000) reviewed IEF for 2DE
applications.
Equilibration
Before the isoelectrofocused gel strip can be applied to the
second-dimension slab gel, it needs to be equilibrated for 30–45
minutes in a buffer containing SDS and a reducing agent such as
DTT. During the equilibration step, the SDS–polypeptide complex that affords protein-size-based separation will form and the
reducing agent will preserve the reduced state of the proteins. A
tracking dye for the second electrophoresis step is also normally
added at this point. A typical equilibration-buffer recipe is as
follows: 50 mM Tris-HCl at pH 8.8, 6-M urea, 30% glycerol,
2% SDS, 1% DTT, and trace amount of bromophenol blue. A
second equilibration step in the presence of 2.5% iodoacetamide
and without DTT (otherwise identical buffer) may be required
for some applications. This will alkylate thiol groups and prevent
their reoxidation during electrophoresis, thus reducing vertical
streaking (Găorg et al. 1987).
Second-Dimension Electrophoresis
Once the gel strip has been equilibrated, it is applied to the
top edge of an SDS-PAGE slab gel and cemented in place using a molten agarose solution. Optimal pore size depends on
the size of the target proteins, but for most applications gradient gels or gels of about 10% or 12% polyacrylamide are
appropriate. Ready-made gels suitable for analytical 2DE are
available commercially. While some reviewers recommend alternative buffer systems (Walsh and Herbert 1999), the Laemmli
method (Laemmli 1970), using glycine as the trailing ion and
the same buffer (25-mM Tris, 192-mM glycine, 0.1% SDS) at
both electrodes, remains the most popular one. The gel is run
at a constant current of 25 mA until the bromophenol blue dye
front has reached the bottom of the gel.
Staining
Visualization of proteins spots is commonly achieved through
staining with colloidal Coomassie Blue G-250 due to its low
cost and ease of use. A typical staining procedure includes fixing
the gel for several hours in 50% ethanol/2% ortho-phosphoric
acid, followed by several 30-minute washing steps in water, followed by incubation for 1 hour in 17% ammonium sulfate/34%
methanol/2% ortho-phosphoric acid, followed by staining for
several days in 0.1% Coomassie Blue G-250/17% ammonium
sulfate/34% methanol/2% ortho-phosphoric acid, followed by
destaining for several hours in water. There are, however, commercially available colloidal Coomassie staining kits that do not
require fixation or destaining.
A great many alternative visualization methods are available,
many of which are more sensitive than colloidal Coomassie
and thus may be more suitable for applications where visualization of low-abundance proteins is important. These include
P1: SFK/UKS
BLBS102-c22
P2: SFK
BLBS102-Simpson
March 21, 2012
13:41
Trim: 276mm X 219mm
410
Printer Name: Yet to Come
Part 3: Meat, Poultry and Seafoods
radiolabeling, such as with [35 S]methionine, and staining with
fluorescent dyes such as the SYPRO or Cy series of dyes. Multiple staining with dyes fluorescing at different wavelengths offers
the possibility of differential display, allowing more than one
proteome to be compared on the same gel, such as in difference
gel electrophoresis (DIGE). Patton published a detailed review
of visualization techniques for proteomics (Patton 2002).
97 kDa
84 kDa
66 kDa
55 kDa
Analysis
Although commercial 2DE image analysis software, such as
ImageMaster (Amersham), PDQuest (BioRad), or Progenesis
(Nonlinear Dynamics), has improved by leaps and bounds in
recent years, analysis of the 2DE gel image, including protein
spot definition, matching, and individual protein quantification,
remains the bottleneck of 2DE-based proteome analysis and still
requires a substantial amount of subjective input by the investigator (Barrett et al. 2005). In particular, spot matching between
gels tends to be time consuming and has proved difficult to
automate (Wheelock and Goto 2006). These difficulties arise
from several sources of variation among individual gels, such
as protein load variability due to varying IPG strip reswelling
or protein transfer from strip to slab gel. Also, gene expression
in several tissues varies considerably among individuals of the
same species, and therefore individual variation is a major concern and needs to be accounted for in any statistical treatment
of the data. Pooling samples may also be an option, depending
on the type of experiment. These multiple sources of variation has led some investigators (Barrett et al. 2005, Karp et al.
2005, Wheelock and Goto 2006) to cast doubt on the suitability of univariate tests such as the Student’s t-test, commonly
used to assess the significance of observed protein expression
differences. Multivariate analysis has been successfully used by
several investigators in recent years (Gustafson et al. 2004, Karp
et al. 2005, Kjaersgard et al. 2006b).
Some Problems and Their Solutions
The high resolution and good sensitivity of 2DE are what make
it the method of choice for most proteomics work, but the
method nevertheless has several drawbacks. The most significant of these have to do with the diversity of proteins and
their expression levels. For example, hydrophobic proteins do
not readily dissolve in the buffers used for isoelectrofocussing.
This problem can be overcome, though, using nonionic or
zwitterionic detergents, allowing for 2DE of membrane- and
membrane-associated proteins (Chevallet et al. 1998, Herbert
1999, Henningsen et al. 2002, Babu et al. 2004). Vilhelmsson
and Miller (2002), for example, were able to use “membrane protein proteomics” to demonstrate the involvement of membraneassociated metabolic enzymes in the osmoadaptive response of
the foodborne pathogen Staphylococcus aureus. A 2DE gel image of S. aureus membrane-associated gels is shown in Figure
22.4.
Similarly, resolving alkaline proteins, particularly those with
pI above 10, on two-dimensional gels has been problematic in the
45 kDa
36 kDa
24 kDa
3
pI
10
Figure 22.4. A two-dimensional electrophoresis membrane
proteome map from Staphylococcus aureus, showing proteins with
pI between 3 and 10 and molecular mass about 15–100
(O. Vilhelmsson and K. Miller, unpublished). Isoelectrofocussing was
in the presence of a mixture of pH 5–7 and pH 3–10 carrier
ampholytes and the second dimension was in a 10%
polyacrylamide slab gel with a 4% polyacrylamide stacker.
past. Although the development of highly alkaline, narrow-range
IPGs (Bossi et al. 1994) allowed reproducible two-dimensional
resolution of alkaline proteins (Găorg et al. 1997), their representation on wide-range 2DE of complex mixtures such as cell
extracts remained poor. Improvements in resolution and representation of alkaline proteins on wide-range gels have been made
(Găorg et al. 1999), but nevertheless an approach that involves
several gels, each of a different pH range, from the same sample is advocated for representative inclusion of alkaline proteins
when studying entire proteomes (Cordwell et al. 2000). Indeed,
Cordwell and coworkers were able to significantly improve the
representation of alkaline proteins in their study on the relatively highly alkaline Helicobacter pylori proteome using both
pH 6–11 and pH 9–12 IPGs (Bae et al. 2003).
A second drawback of 2DE has to do with the extreme difference in expression levels of the cell’s various proteins, which
can be as much as 10,000-fold. This leads to swamping of
low-abundance proteins by high-abundance ones on the twodimensional map, rendering analysis of low-abundance proteins
difficult or impossible. For applications such as species identification or study of the major biochemical pathways, where
the proteins of interest are present in relatively high abundance,