The prevalence and characteristics of metabolic syndrome according to diferent definition in China: A nationwide cross-sectional study, 2012–2015
Bạn đang xem bản rút gọn của tài liệu. Xem và tải ngay bản đầy đủ của tài liệu tại đây (951.75 KB, 11 trang )
(2022) 22:1869
Huang et al. BMC Public Health
/>
Open Access
RESEARCH
The prevalence and characteristics
of metabolic syndrome according
to different definitions in China: a nationwide
cross‑sectional study, 2012–2015
Yilin Huang1, Linfeng Zhang1*, Zengwu Wang1*, Xin Wang1, Zuo Chen1, Lan Shao1, Ye Tian1, Congying Zheng1,
Lu Chen1, Haoqi Zhou1, Xue Cao1, Yixin Tian1, Runlin Gao2 and for the China Hypertension Survey investigators
Abstract
Background: Metabolic syndrome (MetS) is characterized by a cluster of signs of metabolic disturbance and has
caused a huge burden on the health system. The study aims to explore the prevalence and characteristics of MetS
defined by different criteria in the Chinese population.
Methods: Using the data of the China Hypertension Survey (CHS), a nationally representative cross-sectional study
from October 2012 to December 2015, a total of 28,717 participants aged 35 years and above were included in the
analysis. The MetS definitions of the International Diabetes Federation (IDF), the updated US National Cholesterol
Education Program Adult Treatment Panel III (the revised ATP III), and the Joint Committee for Developing Chinese
Guidelines (JCDCG) on Prevention and Treatment of Dyslipidemia in Adults were used. Multivariable logistic regression was used to identify factors associated with MetS.
Results: The prevalence of MetS diagnosed according to the definitions of IDF, the revised ATP III, and JCCDS was
26.4%, 32.3%, and 21.5%, respectively. The MetS prevalence in men was lower than in women by IDF definition (22.2%
vs. 30.3%) and by the revised ATP III definition (29.2% vs. 35.4%), but the opposite was true by JCDCG (24.4%vs 18.5%)
definition. The consistency between the three definitions for men and the revised ATP III definition and IDF definition
for women was relatively good, with kappa values ranging from 0.77 to 0.89, but the consistency between the JCDCG
definition and IDF definition (kappa = 0.58) and revised ATP III definition (kappa = 0.58) was poor. Multivariable logistic
regression showed that although the impact and correlation intensity varied with gender and definition, area, age,
education, smoking, alcohol use, and family history of cardiovascular disease were factors related to MetS.
Conclusions: The prevalence and characteristics of the MetS vary with the definition used in the Chinese population. The three MetS definitions are more consistent in men but relatively poor in women. On the other hand, even if
estimated according to the definition of the lowest prevalence, MetS is common in China.
*Correspondence: ;
1
Division of Prevention and Community Health, National Center
for Cardiovascular Disease, National Clinical Research Center of Cardiovascular
Diseases, State Key Laboratory of Cardiovascular Disease, Fuwai Hospital,
Peking Union Medical College & Chinese Academy of Medical Sciences, No.
15 (Lin), Fengcunxili, Mentougou District, Beijing 102308, China
Full list of author information is available at the end of the article
© The Author(s) 2022. Open Access This article is licensed under a Creative Commons Attribution 4.0 International License, which
permits use, sharing, adaptation, distribution and reproduction in any medium or format, as long as you give appropriate credit to the
original author(s) and the source, provide a link to the Creative Commons licence, and indicate if changes were made. The images or
other third party material in this article are included in the article’s Creative Commons licence, unless indicated otherwise in a credit line
to the material. If material is not included in the article’s Creative Commons licence and your intended use is not permitted by statutory
regulation or exceeds the permitted use, you will need to obtain permission directly from the copyright holder. To view a copy of this
licence, visit http://creativecommons.org/licenses/by/4.0/. The Creative Commons Public Domain Dedication waiver (http://creativeco
mmons.org/publicdomain/zero/1.0/) applies to the data made available in this article, unless otherwise stated in a credit line to the data.
Huang et al. BMC Public Health
(2022) 22:1869
Page 2 of 11
Keywords: Metabolic syndrome, Prevalence, China
Background
MetS is a syndrome clustering, including fat metabolism
disorder, obesity, diabetes, insulin resistance, and other
risk factors, increasing cardiovascular diseases (CVDs)
[1]. Convincing evidence shows that metabolic syndrome
(MetS) has been a growing public health problem worldwide. The prevalence of MetS is high and is expected
to continue rising in developed and developing countries [2–4]. Exploring the characteristics and prevalence
of metabolic syndrome may provide important public
health implications for preventing and managing CVDs.
In the past few decades, several international organizations had provided the definitions of MetS. The World
Health Organization (WHO) 1998 first attempted to put
forward a diagnostic criterion of metabolic syndrome [5]
the US National Cholesterol Education Program Adult
Treatment Panel III (NCEP-ATP III) proposed diagnostic criteria of 5 components in 2001 to facilitate clinical diagnosis of high-risk individuals [6], the American
Heart Association/National Heart, Lung, and Blood
Institute updated the ATP III definition in 2005 (the
revised ATP III) [7], and International Diabetes Federation (IDF) recommended a new definition in 2006 [8].
In China, the Joint Committee for Developing Chinese
Guidelines (JCDCG) on Prevention and Treatment of
Dyslipidemia in Adults suggested a Chinese definition
for MetS in 2016 [9].
Depending on the definition used, estimates of the
prevalence of MetS vary worldwide [10–12], and there
is a clear difference. In recent studies, the MetS was
prevalent in 24.6% of men and 23.8% of women in China
according to ATP III criteria [13], 21.8% of men and
45.6% of women in Iran in 2021 according to IDF definition [14], 32.8% of men and 36.6% women according to
ATP III criteria in 2011–2012 in the United States [15].
Using various criteria, the prevalence in China ranged
from 9.82% to 48.8% [13, 16, 17], which led to confusion
and a lack of comparability among studies. Therefore, it is
necessary to report and compare the prevalence of MetS
by different criteria, which may be helpful for researchers
to understand MetS better and formulate a more scientific definition.
Although many epidemiological studies on MetS were
conducted on the Chinese population in recent years,
there is little national information on the prevalence of
different MetS definitions. In the WHO definition, insulin resistance is regarded as a prerequisite, which limits
its use [5]. Therefore, in this study, we will use the data
of the China Hypertension Survey (CHS) to explore the
prevalence and characteristics of MetS according to IDF,
the revised ATP III, and JCDCG criteria.
Methods
Design and study population
The CHS was a cross-sectional study conducted between
October 2012 and December 2015, and the study design
was published previously [18, 19]. Briefly, A nationally
representative sample of the general Chinese population
across all 31 provinces in mainland China was obtained
using a stratified multistage random sampling method.
In this sub-study, 262 sampled urban cities and rural
counties in the CHS were stratified into eastern, central,
and western regions according to geographical location
and economic level, and 16 cities and 17 counties were
selected with a simple random sampling method, including 7 cities and 7 counties from the eastern regions, 6 cities and 6 counties from the central regions, and 3 cities
and 4 counties from the western regions. Then, at least
three communities or villages were randomly selected
from each city or county. To meet the designed sample
size of 35,000 participants aged ≥ 35 years and take nonresponses into account, 56,000 subjects were randomly
selected from the eligible sites. Finally, 34,994 participants completed the survey, with an overall response
rate of 62.5%. After excluding the pregnant or lactating
(n = 163) women and the subjects with incomplete demographic data (n = 925) and laboratory tests(n = 5189),
28,717 subjects aged ≥ 35 years were included in the final
analysis. The comparison of the characteristics of the
subjects participating in the study and those not participating in the analysis can be found in Appendix Table 1.
Written informed consent was obtained from each participant. The Ethics Committee of Fuwai Hospital (Beijing, China) approved this study.
Data collection
All study investigators and staff members were trained
according to the study protocol. A standardized questionnaire developed by the coordinating center, Fuwai
Hospital, was administered to obtain information on
demographic characteristics factors, such as age, area,
education level, smoking status and alcohol use, and
family history of cardiovascular disease (CVD). Smoking status was defined as participants who had smoked at
least 20 packs of cigarettes in their lifetime and currently
smoked cigarettes. Alcohol use was defined as consuming at least one alcoholic beverage per week in the past
month. Family history of cardiovascular disease (CVD)
Huang et al. BMC Public Health
(2022) 22:1869
referred to that at least one of the parents and siblings
had a history of hypertension, dyslipidemia, diabetes,
coronary heart disease, or stroke.
Anthropometry data (weight, height, and waist circumference) and blood pressure were measured at the
local medical centers. Fasting blood samples were collected in the morning after 10-12 h fasting and were
processed properly and refrigerated immediately. Serum
glucose, triglycerides (TG) and high-density lipoprotein
cholesterol (HDL-C) were determined by automatic biochemical analyzer (Beckman Coulter AU 680). The serum
glucose was measured by the hexokinase method, serum
TG by GPO-POD method, and HDL-C by automated
homogeneous direct measurement method. All samples were analyzed in the central laboratory. Body mass
index (BMI) was classified according to the recommendations of Working Group of Obesity in China, < 18.5 kg/
m2 (underweight), 18.5–23.9 kg/m2 (normal range),
24–27.9 kg/m2 (overweight), ≥ 28 kg/m2 (obesity) [20].
Diagnosing standard
According to the IDF definition, MetS was defined
as central obesity (WC
≥
90 cm for Chinese men
and ≥ 80 cm for Chinese women) along with two or more
of the following abnormalities: (1) Elevated triglyceride (TG) > 1.7 mmol/L or receipt of specific treatment
for this lipid abnormality; (2) High-density lipoproteins cholesterol (HDL-C) level of 1.03 mmol/L in men
and 1.29 mmol/L in women or receipt of specific treatment for this lipid abnormality; (3) Systolic blood pressure ≥ 130 mmHg or diastolic blood pressure ≥ 85 mmHg
or receipt of treatment of previously diagnosed hypertension; (4) Fasting plasma glucose (FPG) level of
5.6 mmol/L or previously diagnosed type 2 diabetes [8].
According to the revised ATP III definition, MetS
was defined as if there were more than three or more
of the following abnormalities: (1) Central obesity (WC
≥ 90 cm for men and ≥ 80 cm for women); (2) Elevated
triglyceride level ≥ 1.7 mmol/L or on drug treatment
for elevated triglycerides; (3) Reduced HDL-C < 40 mg/
dL (1.03 mmol/L) in men; < 50 mg/dL (1.3 mmol/L) in
women or receipt of drug treatment for reduced HDLC; (4) Systolic blood pressure ≥ 130 mmHg or diastolic
blood pressure ≥ 85 mmHg or receipt of treatment of
previously diagnosed hypertension; (5) Elevated plasma
glucose (FPG) ≥ 5.6 mmol/dL or receipt of drug treatment for elevated glucose [7].
According to the JCDCG definition, MetS was
defined as if there were three or more of the following abnormalities: (1) Central obesity (WC ≥ 90 cm for
men and ≥ 85 cm for women); (2) Elevated triglyceride level ≥ 1.7 mmol/L) or receipt of specific treatment
for this lipid abnormality; (3) Reduced HDL-C level
Page 3 of 11
(< 1.0 mmol/l) or specific treatment for this lipid abnormality; (4) Systolic blood pressure ≥ 130 mmHg or diastolic blood pressure ≥ 85 mmHg or current treatment for
hypertension or previously diagnosed hypertension; (5)
Elevated fasting plasma glucose level (FPG ≥ 6.1 mmol/L
or 2 h postprandial PG ≥ 7.8 mmol/L) or previously diagnosed diabetes mellitus [9].
Statistical analysis
The study population was sampled with the multilevel,
stratified sampling design based on sex, area, and province [19]. Survey weights were computed based on the
study design and 2010 Chinese census data and included
oversampling for specific age subgroups, nonresponse,
and other demographics between the sample and the
total population. Differential probabilities of selection
were adjusted, and the complex sampling design was
used to enhance the representativeness of the survey
sample population.
All data analyses were conducted using R version
4.1.1(http://www.r-project.org). The normality of the
data was assessed by the Kolmogorov–Smirnov test.
Means for continuous variables and percentages and proportions for categorical variables were used for summarizing. The Student t-test and Rao-Scott χ2 test were used
to assess the differences across groups for continuous
and categorical variables. Venn diagrams and kappa value
( poor, kappa ≤ 0.20; fair, kappa = 0.21–0.40; moderate,
kappa = 0.41–0.60; substantial, kappa = 0.61–0.80; very
good, kappa > 0.80) were used to assess disparity and
agreement of three definitions. Univariate analysis was
conducted to identify variables potentially associated
with any defined MetS, and variables with P < 0.10 were
included in the multivariable logistic regression. The 95%
confidence intervals (CIs) were calculated for Odds ratios
(OR). All tests were two-tailed, and a value of P < 0.05 was
considered statistically significant.
Result
Characteristics of the study population
A total of 13,035(45.4%) men and 15,682(54.6%) women
aged ≥ 35 years old were included in this survey. The
characteristics of the participants are shown in Table 1.
Overall, the mean age was 52.0 years (51.5 years for men
and 52.4 years for women), and the range of age was 35
to 107 years. Most (65.8%) people lived in rural areas,
and 40.6% were located in eastern China, 81.4% were
educated in middle school or below, and 12.8% of participants had a CVD family history. In men, 48.3% were
current smokers, and 37.9% had alcohol use, whereas
the corresponding proportions were only 2.6% and 2.7%
in women. Compared to women, men had a higher level
Huang et al. BMC Public Health
(2022) 22:1869
Page 4 of 11
Table1 Characteristics of the study population
Age (years)
Total
Men
Women
(N = 28,717)
(N = 13,035)
(N = 15,682)
52.0(51.2–52.7)
51.5(50.8–52.3)
52.4(51.7–53.1)
40.6(28.6–52.7)
40.3(27.4–53.1)
41.0(29.6–52.5)
Region (n %)
East
Central
32.0(16.5–47.6)
32.3(16.0–48.6)
31.8(16.9–46.7)
27.3(17.3–37.3)
27.4(17.6–37.3)
27.2(16.9–37.5)
Rural
65.8(46.3–85.3)
65.6(45.2–86.0)
66.0(47.3–84.8)
Urban
34.2(14.7–53.7)
34.4(14.0–54.8)
34.0(15.2–52.7)
81.4(75.3–86.2)
77.7(71.2–83.0)
85.1(79.3–89.6)
Area (n %)
0.792
Education level (n %)
< 0.001
High school or vocational school
14.0(10.6–18.3)
16.8(13.2–21.2)
11.2(7.9–15.5)
College and above
4.6(3.0–7.1)
5.5(3.6–8.4)
3.7(2.3–5.9)
No
74.3(72.3–76.4)
51.7(47.7–55.7)
97.4(95.7–98.4)
Yes
25.7(23.6–27.7)
48.3(44.3–52.3)
2.6(1.6–4.3)
79.5(76.0–82.6)
62.1(56.0–68.3)
97.3(96.0–98.1)
Smoking status (n %)
< 0.001
Alcohol use (n %)
No
0.001
0.889
West
Middle school or below
P
< 0.001
Yes
20.5(17.4–24.0)
37.9(31.7–44.0)
2.7(1.9–4.0)
WC (cm)
83.65(82.04–85.26)
85.71(84.21–87.21)
81.55(79.79–83.31)
< 0.001
TG (mmol/L)
1.48(1.41–1.55)
1.56(1.49–1.64)
1.40(1.32–1.47)
< 0.001
HDL (mmol/L)
1.31(1.26–1.37)
1.27(1.21–1.32)
1.36(1.31–1.42)
< 0.001
FPG (mmol/L)
5.52(5.36–5.68)
5.58(5.43–5.73)
5.45(5.28–5.63)
0.008
SBP (mmHg)
131.03(129.85–132.20)
131.70(130.64–132.75)
130.35(128.83–131.86)
0.025
DBP (mmHg)
78.08(77.36–78.80)
80.16(79.28–81.04)
75.96(75.11–76.80)
< 0.001
BMI (kg/m2)
24.57(24.06–25.09)
24.57(24.11–25.04)
24.58(23.99–25.16)
0.971
No
87.2(82.6–90.8)
88.4(83.7–91.9)
86.0(81.4–89.6)
Yes
12.8(9.2–17.4)
11.6(8.1–16.3)
14.0(10.4–18.6)
Family history of CVD (n %)
< 0.001
Data are shown as values(95%CI)
WC Waist circumference, TG Triglycerides, HDL High-density lipoprotein cholesterol, LDL Low-density lipoprotein cholesterol, SBP Systolic blood pressure, DBP Diastolic
blood pressure, FPG Fasting plasma glucose, BMI Body mass index, CVD Coronary cardiovascular disease
of WC, TG, blood pressure, fasting plasma glucose, and
lower levels of HDL-C.
Prevalence and presence of MetS in different definitions
Table 2 shows the prevalence of MetS with IDF, the
revised ATP III, and JCDCG criteria. The prevalence
of MetS in the overall population was 26.4% (22.2% in
men and 30.3% in women) by IDF criteria, 32.3% (29.2%
in men and 35.4% in women) by revised ATP III definition, 21.5% (24.4% in men and 18.5% in women) by
JCDCG criteria. Despite some subtle differences, the
relationship between various factors and MetS according to the three definitions were very similar. Regardless
of the definition used, living in urban areas, having a
family history of CVD, or having a higher BMI was significantly associated with a higher prevalence of MetS in
the overall population and in both men and women. The
prevalence of MetS reached its highest in the age group
of 55–64 years in the total population and 45–54 years in
men, and the prevalence decreased with age regardless
of the definition used. In women over 55 years of age,
the MetS prevalence maintained a high level. Regardless of the definition used, higher education levels were
associated with a higher prevalence of MetS in men. In
contrast, higher education levels were associated with a
lower prevalence of MetS in women. The difference was
statistically significant in the overall population only
when the JCDCG definition was used and significant in
women when IDF and the revised ATP III definitions
were used. For smoking, there was a significant association between smoking and MetS in the overall population, but not in men and women. Regardless of the
Huang et al. BMC Public Health
(2022) 22:1869
Page 5 of 11
Table 2 The Prevalence of MetS defined by different definitions
IDF %
Total
Revised ATP III%
JCDCG %
Total
Men
Women
Total
Men
Women
Total
Men
Women
26.4
22.2
30.3
32.3
29.2
35.4
21.5
24.4
18.5
Age group
35–44
19.5
21.6
17.3
24.4
28.2
20.4
16.4
23.8
8.2
45–54
27.7
24.3
31.3
33.4
31.4
35.5
22.0
26.3
17.5
55–64
32.7
23.0
42.3
39.4
30.4
48.4
26.6
25.5
27.8
65–74
31.4
19.5
42.8
37.9
26.9
48.4
24.9
21.2
28.5
≥ 75
P
30.3
17.5
40.1
38.1
24.2
48.7
24.5
19.3
28.4
< 0.0001
0.0146
< 0.0001
< 0.0001
0.0362
< 0.0001
< 0.0001
0.0320
< 0.0001
Region
East
31.6
28.0
35.2
36.4
34.0
38.9
24.9
28.4
21.3
Central
23.0
16.7
29.6
30.3
25.4
35.4
19.6
21.1
17.9
West
22.8
20.3
25.3
28.4
26.8
30.1
18.6
22.4
14.8
P
0.0024
< 0.0001
0.0418
0.0058
< 0.0001
0.0511
0.0021
0.0004
0.0273
Area
Rural
22.9
18.2
27.5
28.5
24.9
32.2
18.6
20.9
16.2
Urban
33.4
29.9
36.9
39.5
37.5
41.6
27.1
31.1
22.9
P
< 0.0001
< 0.0001
0.0023
< 0.0001
< 0.0001
0.0065
0.0001
< 0.0001
0.0089
Education level
Middle school or below
26.0
20.5
31.2
31.8
27.3
35.9
20.9
23.1
18.8
High school or vocational school
28.8
27.3
31.2
34.9
34.9
34.9
24.1
28.1
18.1
College and above
26.7
31.9
18.9
33.1
38.9
24.2
24.3
32.2
12.1
P
0.1303
< 0.0001
0.0103
0.0814
< 0.0001
0.0095
0.0188
< 0.0001
0.1023
Smoking status
No
27.7
22.1
30.7
33.5
30.0
35.4
20.8
25.1
18.4
Yes
22.8
22.4
30.7
28.8
28.4
35.3
23.5
23.7
19.6
P
0.0011
0.8684
0.9979
0.0016
0.1890
0.9753
0.0240
0.1725
0.7554
26.9
20.5
31.0
32.7
28.1
35.7
20.7
23.7
18.7
Alcohol use
No
Yes
24.7
25.0
20.5
30.7
31.1
24.6
24.5
25.5
10.0
P
0.1184
< 0.0001
< 0.0001
0.1514
0.0063
< 0.0001
0.0011
0.0723
< 0.0001
BMI group
Underweight
0.6
0.5
0.6
2.3
1.7
3.0
1.3
1.2
1.4
Normal range
6.9
2.3
11.3
13.8
9.1
18.4
6.9
6.9
6.9
Overweight
33.8
27.8
40.8
40.5
36.9
44.6
26.7
30.3
22.5
Obesity
64.8
65.9
63.8
66.4
68.4
64.6
50.8
60.5
42.2
P
< 0.0001
< 0.0001
< 0.0001
< 0.0001
< 0.0001
< 0.0001
< 0.0001
< 0.0001
< 0.0001
Family history of CVD (n %)
No
24.6
20.7
28.5
30.3
27.7
33.1
20.0
23.0
16.8
Yes
39.4
33.7
44.2
45.8
41.2
49.6
31.8
35.3
28.9
P
< 0.0001
< 0.0001
< 0.0001
< 0.0001
< 0.0001
< 0.0001
< 0.0001
< 0.0001
< 0.0001
MetS Metabolic syndrome, IDF International Diabetes Federation; Revised ATP III: the American Heart Association/National Heart, Lung, and Blood Institute updated
the ATP III; JCDCG The Joint Committee for Developing Chinese Guidelines, BMI Body mass index, CVD Cardiovascular disease
definition used, alcohol use was associated with a lower
prevalence of MetS in women, whereas when using the
IDF and the revised ATP III, alcohol use was associated
with a higher prevalence of MetS in men. In contrast, in
the overall population, alcohol use was only significantly
associated with MetS as defined by the JCDCG.
Huang et al. BMC Public Health
(2022) 22:1869
Page 6 of 11
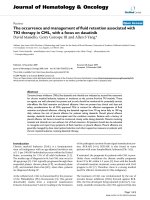
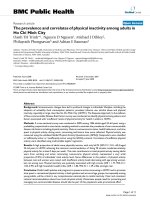
Fig. 1 Venn diagrams showing the agreement and disparity in the diagnosis of the metabolic syndrome defined by IDF, the revised ATP III and
JCDCG criteria among those 3879 men and 6288 women who qualified for the diagnosis of the metabolic syndrome by at least one of these
definitions. Abbreviations: IDF: International Diabetes Federation; the revised ATP III: the American Heart Association/National Heart, Lung, and
Blood Institute updated the ATP III; JCDCG: the Joint Committee for Developing Chinese Guidelines
Table 3 The agreement between the various definitions of the
MetS
Revised ATP III
JCDCG
kappa
95%CI
0.81
0.75–0.87
kappa
95%CI
Men
IDF
Revised ATP III
0.77
0.73–0.80
0.86
0.85–0.88
Women
IDF
Revised ATP III
0.89
0.86–0.92
0.58
0.56–0.60
0.58
0.56–0.60
MetS Metabolic syndrome, CI Confidence Interval, IDF International Diabetes
Federation, Revised ATP III: the American Heart Association/National Heart,
Lung, and Blood Institute updated the ATP III; JCDCG The Joint Committee for
Developing Chinese Guidelines
Agreement on the various definitions of the metabolic
syndrome
The consistency and differences between diagnoses
using IDF, the revised ATP III, and JCDCG criteria are
shown in Fig. 1 and Table 3. In individuals with MetS
diagnosed according to at least one definition, 64.4%
of men and 46.6% of women were diagnosable by all
definitions, and above 90% of people diagnosed with
MetS according to two or three definitions. The JCDCG
definition was the strictest, especially for women, only
52.1% of women were diagnosed with MetS. Table 3
shows the kappa values between any two definitions
for men and women. The test showed good consistency
between any two definitions in men and between the
revised ATP III and IDF in women, with kappa values
ranging from 0.77 to 0.89. JCDCG was moderately consistent with IDF (kappa = 0.58) and the revised ATP III
(kappa = 0.58) in women.
Multivariable logistic regression analysis of factors related
to MetS
Table 4 shows the factors associated with MetS in men
and women according to different definitions. The results
showed that area, age, education, smoking, alcohol
use, and family history of cardiovascular disease were
related to MetS, but the effects and correlation intensity
of these factors varied with gender and definition. Living in urban areas and having a family history of CVD
was significantly associated with the high prevalence of
MetS in both men and women under all MetS definitions, although there were slight differences in OR values. Among men, 75 years and older were significantly
associated with a lower prevalence of MetS, and college
education and above were significantly associated with a
higher prevalence of MetS according to all three definitions. However, among women, regardless of the definition used, all groups aged 45 and above were significantly
associated with a higher prevalence of MetS, and college
education and above and alcohol use were significantly
associated with a lower prevalence of MetS. Living in the
eastern region was significantly associated with a higher
prevalence of MetS in men but not in women. Smoking
was significantly associated with a lower prevalence of
MetS defined by the revised ATP III and JCDCG criteria
but not associated with MetS by IDF in men and according to all three definitions in women. In men, alcohol use
Huang et al. BMC Public Health
(2022) 22:1869
Page 7 of 11
Table 4 Factors related to MetS defined by IDF, Revised ATP III, and JCDCG definitions
IDF
Area
Age
Women
Men
Women
Men
Women
Rural
reference
reference
reference
reference
reference
reference
Urban
1.62(1.32–1.98)‡ 1.53(1.13–2.06)† 1.59(1.39–1.81)‡ 1.51(1.16–1.97)† 1.53(1.35–1.74)‡ 1.50(1.14–1.97)†
35–44
reference
45–54
1.06(0.92–1.21)
65–74
Smoking status
Alcohol use
Region
reference
reference
2.01(1.52–2.65)‡ 1.08(0.93–1.25)
0.98(0.82–1.18)
0.86(0.72–1.03)
*
3.19(2.34–4.35)
‡
3.38(2.53–4.52)
‡
‡
1.03(0.87–1.22)
0.91(0.81–1.03)
†
reference
reference
2.01(1.63–2.47)‡ 1.07(0.90–1.26)
‡
3.39(2.62–4.40)
‡
3.50(2.69–4.57)
‡
1.00(0.84–1.20)
2.18(1.79–2.66)‡
3.92(3.26–4.71)‡
*
4.19(3.13–5.61)‡
†
0.82(0.70–0.97)
3.04(2.25–4.10)
0.79(0.66–0.93)
3.59(2.78–4.63)
0.72(0.58–0.89)
4.23(2.97–6.03)‡
reference
reference
reference
reference
reference
1.07(0.95–1.21)
0.92(0.81–1.04)
≥ 75
0.75(0.59–0.96)
Middle school or
below
reference
High school or vocational school
1.17(1.07–1.27)† 0.91(0.80–1.05)
College and above
1.41(1.13–1.77)† 0.57(0.41–0.78)† 1.35(1.13–1.61)† 0.65(0.49–0.87)† 1.27(1.05–1.52)* 0.72(0.54–0.95)*
No
reference
reference
reference
Yes
0.92(0.77–1.11)
0.76(0.57–1.01)
0.86(0.79–0.94)† 0.73(0.51–1.05)
0.87(0.80–0.95)† 0.80(0.53–1.21)
No
reference
reference
reference
reference
Yes
1.19(1.08–1.31)† 0.50(0.38–0.65)‡ 1.10(0.97–1.26)
0.51(0.43–0.62)‡ 1.04(0.90–1.20)
0.42(0.35–0.52)‡
West
reference
reference
reference
reference
reference
reference
Central
0.81(0.56–1.19)
1.31(0.75–2.26)
0.97(0.76–1.23)
1.35(0.87–2.08)
0.96(0.77–1.21)
1.33(0.86–2.05)
East
1.35(1.02–1.8)*
1.45(0.86–2.43)
1.27(1.03–1.56)* 1.33(0.83–2.14)
1.26(1.05–1.50)* 1.39(0.89–2.18)
reference
reference
reference
reference
Family history of CVD No
Yes
*
JCDCG
Men
55–64
Education level
AHA
1.17(1.02–1.35)* 0.90(0.77–1.05)
reference
reference
reference
reference
reference
reference
reference
1.65(1.48–1.84)‡ 1.55(1.41–1.69)‡ 1.60(1.45–1.77)‡ 1.58(1.40–1.78)‡ 1.62(1.45–1.81)‡ 1.56(1.37–1.77)‡
P < 0.05, †P < 0.01, ‡P < 0.001; OR (95%CI), calculated with multivariable logistic regression stratified by sex
MetS Metabolic syndrome, OR Odds Ratio, CI Confidence Interval, IDF International Diabetes Federation; Revised ATP III: the American Heart Association/National
Heart, Lung, and Blood Institute updated the ATP III; JCDCG The Joint Committee for Developing Chinese Guidelines, BMI Body mass index, CVD Cardiovascular
disease. Factors in the model: age, area, education level, smoking status, alcohol use, region, and family history of CVD
was only significantly associated with a higher prevalence
of MetS defined by IDF criteria. In women, alcohol use
was associated with a lower prevalence of MetS defined
by all three definitions.
Discussion
This study aimed to investigate the prevalence and characteristics of MetS with different definitions across
China. The results showed that the overall prevalence
of MetS among Chinese populations aged ≥ 35 years
according to the definition of IDF, the revised ATP III,
and JCDCG was 26.4%, 32.3%, and 21.5%, respectively.
The MetS was less prevalent in men than women according to IDF definition (22.2% vs 30.3%) and the revised
ATP III (29.2% vs 35.4%) definition, but the opposite was
true according to JCDCG definition (24.4%vs 18.5%).
The result also showed that JCDCG definition was not
in good agreement with IDF and the revised ATP III in
women. In addition, the study indicated that area, age,
education, smoking, alcohol use, and family history of
CVD were related to MetS, but the impact and strength
of the association of these factors varied by gender and
definition.
The study explored the prevalence and characteristics
of MetS with different MetS definitions across China. The
prevalence of MetS varied greatly, with the lowest being
defined by JCDCG (21.5%) and the highest being defined
by ATP III (32.3%), the latter was about 1.5 times of the
former. Even if estimated according to the definition of
the lowest prevalence, MetS was common in the Chinese
adults. Therefore, it is necessary to take targeted intervention measures to reduce the burden of MetS in China.
Multivariate logistic regression showed that although the
impact and correlation intensity varied by gender and
definition, region, age, education, smoking, alcohol consumption, and family history of CVD were factors associated with MetS. An in-depth study of the relationship
between these factors and MetS may help to understand
the causes of MetS and help to control MetS.
Consistency and difference analysis showed that there
was a great overlap between the three definitions. Among
individuals with MetS diagnosed according to at least
one definition, 64.4% of men and 46.6% of women could
be diagnosed by all definitions. This may explain why the
influence and correlation intensity of the factors associated with MetS varied by definition, but the difference
Huang et al. BMC Public Health
(2022) 22:1869
was not large. The consistency tests showed that the
consistency between any two definitions of men and the
revised ATP III definition and IDF definition of women
was relatively good, while the consistency between
JCDCG and IDF definition (kappa 0.58) and the revised
ATP III (kappa 0.58) was relatively poor in women. Moreover, the results showed that the MetS prevalence was
higher in men than in women with IDF and the revised
ATP III definition, but lower in men than in women with
the JCDCG definition. This phenomenon may be caused
by the strictest central obesity standard (WC ≥ 85 cm for
women). Understanding the differences among the definitions may helpful to correctly analyze the differences
in prevalence among different definitions. Some studies
have shown that the revised ATP III definition was the
best predictor of cardiovascular disease [21, 22]. The current study is a cross-sectional study, and it is impossible
to compare the advantages and disadvantages of different definitions. To solve this problem, more longitudinal
studies may be needed. The prevalence of MetS in our
population lies well within the data previously obtained
in China [13, 21, 23]. In a nationwide studies of people
over 45 years old, the prevalence of MetS was 34.8%,
39.7%, and 25.6%, according to IDF, the revised ATP III,
JCDCG criteria, respectively [21]. The participants in
that study were older than those in our study. In a survey
of people aged 18 years and older, the prevalence of MetS
according to the revised ATP III definition was 24.2%,
much lower than the 32.3% we obtained when using the
same definition [13]. However, the prevalence of MetS
in the 45–54, 55–64, and ≥ 65 years age groups in that
study was 32.12%, 36.97%, 37.81%, respectively. In our
study, the MetS prevalence in the 45–54, 55–64, 65–64,
and ≥ 75 years age groups was 33.4%, 39.4%, 37.9%, and
38.1%, respectively (Table 2). The numbers are very close.
It has been seen that the prevalence of MetS was
closely related to age and gender [24]. In our study, the
prevalence of MetS in the total population peaked at the
age of 55–64 years, which is close to Wu’s study, which
peaked at the age of 60–69 years [25]. In addition to age,
gender cannot be ignored. In our study, the prevalence of
MetS in women over 45 years old remained at a high level
(Table 2), and the odds ratio of women over 45 years old
reached around 3 (Table 4). Menopause may explain this
phenomenon, for menopause generally occurs around
the age of 50 [26]. The loss of heart and kidney protection of female hormones with age may lead to the sharp
increase in hypertension and cardiovascular disease in
postmenopausal women [27]. The prevalence of MetS in
our study reached its highest in men aged 45–54 years
and then decreased, becoming a protective factor over
65 years. This marked reversal of gender difference in
older adults may be partly attributable to the men prone
Page 8 of 11
to metabolic disease who had died before the age of 75 or
refused to participate in this study [27, 28]. The characteristics of MetS vary by sex, suggesting that reasonable
comparisons should be made by sex.
In addition to age and gender, our study showed there
were some other factors associated with MetS. The present study revealed that individuals living in urban areas
had a higher risk of MetS, in line with some other studies [25, 29]. The reason for this phenomenon may be
that, in China, compared to rural areas, in economically
developed urban areas with rapid industrialization, animal food and fast food with high fat and purine content
increased dramatically, while grain consumption was the
opposite [30]. Our results also indicated that there were
gender differences in the association between education
and MetS, with a positive association for women and negative for men. This was consistent with a study conducted
by the Korea National Health and Nutrition Examination
Surveys [31]. One possible explanation was that more
educated women might have a favorable opportunity to
get more nutrition knowledge and prefer healthy food
consumption patterns [32]. And men with higher education are more likely to consume high-calorie foods and
alcohol, while avoiding physically demanding tasks [31].
It is worth noting that a family history of CVD was an
independent risk factor for MetS in our study, suggesting that more attention should be paid to individuals
with a CVD family history [33]. There was a significant
negative correlation between smoking and MetS defined
by the revised ATP III and JCDCG definition in men.
Although the association between smoking and MetS
was not significant in women, its OR value was smaller
than that in men, which may be due to the small number of women smoking and insufficient test power. This
phenomenon is contrary to the general conclusion that
smokers had higher insulin resistance and a higher risk
of fatal coronary artery disease than non-smokers [34].
One possible explanation is that some smokers weigh
less than non-smokers because of the effects of nicotine
on metabolism [35]. Interestingly, we found an arguable
result that alcohol use was a protective factor for women
and a risk factor for men, which was also reported in
Sampson’s study [36]. Men have higher drinking rates
and tend to consume large amount of alcohol. Heavy
drinking, especially > 30 g/day in men, is often accompanied by an increase in energy intake and changes in the
concentration of steroid hormones that may cause central fat storage, which will aggravate elevated blood pressure, elevated plasma glucose, and central obesity [37].
Women drink less often and in lower amounts. Some
studies have shown that drinking small amounts of alcohol may have cardiovascular protective effects [38]. However, the protective effect of drinking small amounts of
Huang et al. BMC Public Health
(2022) 22:1869
alcohol remains controversial and needs further study
[39].
Our study has some strength. Firstly, the sample size
of the current study was large and the study population was randomly selected from the whole country
by stratified and multistage sampling, and the sample
was nationally representative. This allowed us to estimate the prevalence of MetS across the country and to
explore the impact of different definitions on the prevalence of MetS in China. Secondly, strict quality control
ensured the high quality of data and reliability of the
findings. The uniform research protocol and measuring
instruments, strict training and examination, and the
centralized detection of blood glucose and lipids in the
central laboratory ensure the accuracy and comparability of the data. Thirdly, we used different definitions
in the same group of people to explore the prevalence
and characteristics of MetS, which enables us to have
a comprehensive understanding of the prevalence and
characteristics of MetS and is also convenient to compare with the data of other regions and population.
The limitations of this study need to be recognized.
Firstly, we only compared the revised ATP III, IDF, and
JCDCG definitions due to the lack of some indicators,
such as the data of insulin resistance. Secondly, we
explored some related factors of MetS, but we cannot
claim causality because of the cross-sectional design.
Thirdly, in this study, we explored the related factors of
MetS, some variables which may affect MetS were not
included in our study, such as physical activity and dietary patterns. In addition, due to funding and other reasons, the investigation lasted for a long time, and some
related factors may have changed.
Conclusions
In summary, the prevalence and characteristics of metabolic syndrome vary according to the definition used
in the Chinese population. The three MetS definitions
of IDF, the revised ATP III, and JCDCG are in relatively
good agreement in men, but the differences between
JCDCG and IDF and between JCDCG and the revised
ATP III are large in women. On the other hand, even
if estimated according to the definition of the lowest
prevalence. MetS is common in the Chinese adults. It is
necessary to explore the causes of the difference in the
prevalence of MetS in different populations and take
targeted intervention measures in China.
Abbreviations
MetS: Metabolic syndrome; WHO: The World Health Organization; EGIR:
The European Group for the study of Insulin Resistance; NCEP: The National
Cholesterol Education Program Adult Treatment Panel III; IDF: The International
Page 9 of 11
Diabetes Federation; Revised ATP III: The American Heart Association/
National Heart, Lung, and Blood Institute updated the ATP III; JCDCG: The Joint
Committee for Developing Chinese Guideline; WC: Waist circumference; TG:
Triglyceride; HDL-C: High-density lipoproteins cholesterol; BP: Blood pressure;
FPG: Fasting plasma glucose.
Supplementary Information
The online version contains supplementary material available at https://doi.
org/10.1186/s12889-022-14263-w.
Additional file 1: Appendix Table 1. Characteristics of the subjects
included and excluded in the analysis (age ≥ 35 years old).
Additional file 2: Supplemental Text 2. Weights calculation in the Study.
Acknowledgements
We thank all the colleagues involved in the China Hypertension Survey. The
authors are grateful to OMRON Corporation, Kyoto, Japan, for providing the
blood pressure monitor (HBP-1300) and body fat and weight measurement
device (V- body HBF-371); Henan Huanan Medical Science & Technology Co.,
Ltd, China, for providing digital ECG device (GY- 5000); and Microlife, Taipei, Taiwan, for providing the automated ABI device (Watch BP Office device). Finally,
the authors are thankful to BUCHANG PHARMA, Xian, China; Kinglian Technology, Guangzhou, China; Merck Serono; Pfizer, China; and Essen Technology
(Beijing) Company Limited for their financial support for the project.
China Hypertension Survey
Linfeng Zhang1, Zengwu Wang1, Xin Wang1, Zuo Chen1, Lan Shao1, Ye Tian1,
Liqun Hu3, Hongqi Li3, Qi Zhang3, Guang Yan3, Fangfang Zhu4, Xianghua
Fang5, Chunxiu Wang5, Shaochen G
uan5, Xiaoguang Wu5, Hongjun Liu5,
Chengbei Hou5, Han Lei6, Wei Huang6, Nan Zhang6, Ge Li7, Lihong Mu7, Xiaojun Tang7, Ying Han8, Huajun Wang8, Dongjie Lin8, Liangdi Xie8, Daixi Lin9, Jing
Yu10, Xiaowei Zhang10, Wei Liang10, Heng Yu10, Qiongying Wang10, Lan Yang11,
Yingqing Feng12, Yuqing Huang12, Peixi Wang13, Jiaji Wang13, Harry HX Wang14,
Songtao Tang15, Tangwei Liu16, Rongjie Huang16, Zhiyuan Jiang16, Haichan
Qin16, Guoqin Liu17, Zhijun Liu17, Wenbo Rao17, Zhen Chen17, Yalin Chu17, Fang
Wu17, Haitao Li18, Jianlin Ma18, Tao Chen18, Ming Wu19, Jixin Sun20, Yajing Cao20,
Yuhuan Liu20, Zhikun Zhang21, Yanmei Liu22, Dejin Dong23, Guangrong Li24,
Hong Guo25, Lihang Dong25, Haiyu Zhang25, Fengyu Sun25, Xingbo G
u25, Ye
Tian25, Kaijuan Wang26, Chunhua Song26, Peng Wang26, Hua Ye26, Wei Nie27,
Shuying Liang27, Congxin H
uang28, Fang Chen28, Yan Zhang28, Heng Zhou28,
Jing Xie28, Jianfang Liu28, Hong Yuan29, Chengxian G
uo29, Yuelong Huang30,
Biyun Chen30, Xingsheng Zhao31, Wenshuai He31, Xia Wen31, Yanan Lu31,
Xiangqing Kong32, Ming Gui32, Wenhua Xu32, Yan Lu32, Jun Huang32, Min Pan33,
Jinyi Zhou34, Ming Wu34, Xiaoshu Cheng35, Huihui B
ao35, Xiao Huang35, Kui
Hong35, Juxiang Li35, Ping Li35, Bin Liu36, Junduo Wu36, Longbo Li36, Yunpeng
Yu36, Yihang Liu36, Chao Qi36, Jun Na37, Li Liu37, Yanxia Li37, Guowei Pan37,
Degang Dong38, Peng Qu38, Jinbao Ma39, Juan Hu40, Fu Zhao41, Jianning Yue42,
Minru Zhou42, Zhihua Xu42, Xiaoping L i42, Qiongyue Sha42, Fuchang M
a42,
Qiuhong Chen43, Huiping Bian43, Jianjun Mu44, Tongshuai Guo44, Keyu Ren44,
Chao Chu44, Zhendong L iu45, Hua Zhang45, Yutao Diao45, Shangwen Sun45,
Yingxin Zhao45, Junbo Ge46, Jingmin Zhou46, Xuejuan Jin46, Jun Zhou46, Bao
Li47, Lijun Zhu47, Yuean Zhang47, Gang Wang47, Zhihan Hao48, Li Cai49, Zhou
Liu49, Zhengping Yong49, Shaoping Wan50, Zhenshan J iao51, Yuqiang Fan51, Hui
Gao52, Wei Wang52, Qingkui Li53, Xiaomei Zhou53, Yundai Chen54, Bin Feng54,
Qinglei Zhu54, Sansan Zhou54, Nanfang L i55, Ling Zhou55, Delian Zhang55, Jing
Hong55, Tao Guo56, Min Zhang56, Yize Xiao57, Xuefeng Guang58, Xinhua Tang59,
Jing Yan59, Xiaoling Xu59, Li Yang59, Aimin Jiang59, Wei Yu59.
1. Division of Prevention and Community Health, National Center for Cardiovascular Disease, National Clinical Research Center of Cardiovascular Diseases,
State Key Laboratory of Cardiovascular Disease, Fuwai Hospital, Peking Union
Medical College & Chinese Academy of Medical Sciences, Beijing, China
3. Anhui Provincial Hospital, Hefei, Anhui, China.
4. Anhui Institute of Cardiovascular Disease, Hefei, Anhui, China.
5. Xuanwu Hospital, Capital Medical University, Beijing, China.
6. First Affiliated Hospital of Chongqing Medical University, Chongqing, China.
7. Chongqing Medical University, Chongqing, China.
8. First Affiliated Hospital of Fujian Medical University, Fuzhou, Fujian, China.
9. Fujian medical university, Fuzhou, Fujian, China.
10. Lanzhou University Second Hospital, Lanzhou, Gansu, China.
Huang et al. BMC Public Health
(2022) 22:1869
11. Maternal and Child Care Service Centre, Lanzhou, Gansu, China.
12. Guangdong General Hospital, Guangzhou, Guangdong, China.
13. Guangzhou Medical University, Guangzhou, Guangdong, China.
14. Sun Yat-Sen University, Guangzhou, Guangdong, China.
15. Community Health Services Center of Liaobu, Dongguan, Guangdong,
China.
16. First Affiliated Hospital of Guangxi Medical University, Nanning, Guangxi,
China
17. Zunyi Medical University, Zunyi, Gouzhou, China.
18. Hainan General Hospital, Haikou, Hainan, China.
19. Health and Family Planning Commission of Hainan, Haikou, Hainan, China.
20. Center for Disease Prevention and Control of Hebei, Shijiazhuang, Hebei,
China.
21. Center for Disease Prevention and Control of Tangshan, Tangshan, Hebei,
China.
22. Center for Disease Prevention and Control of Langfang, Langfang, Hebei,
China.
23. Center for Disease Prevention and Control of Xingtai, Xingtai, Hebei, China.
24. Center for Disease Prevention and Control of Dingzhou, Dingzhou, Hebei,
China.
25. First Affiliated Hospital of Harbin Medical University, Haerbin, Heilongjiang,
China.
26. Zhengzhou University, Zhengzhou, Henan, China.
27. Henan Academy of Medical Sciences, Zhengzhou, Henan, China.
28. Department of Cardiology, Renmin Hospital of Wuhan University, Wuhan,
Hubei, China.
29. Third Xiangya Hospital, Central South University, Changsha, Hunan, China.
30. Center for Disease Control and Prevention of Hunan, Changsha, Hunan,
China.
31. Inner Mongolia people’s hospital, Hohhot, Inner Mongolia, China.
32. First Affiliated Hospital of Nanjing Medical University, Nanjing, Jiangsu,
China.
33. Affiliated Hospital of Nantong University, Nanjing, Jiangsu, China.
34. Center for Disease Control and Prevention of Jiangsu, Nanjing, Jiangsu,
China.
35. Second Affiliated Hospital of Nanchang University, Nanchang, Jiangxi,
China.
36. Second Hospital of Jilin University, Changchun, Jilin, China.
37. Center for Disease Prevention and Control of Liaoning, Shenyang, Liaoning,
China.
38. Health and Family Planning Commission of Liaoning, Shenyang, Liaoning,
China.
39. Health and Family Planning Commission of Ning Xia Hui Autonomous
Region, Yinchuan, Ningxia, China.
40. Center for Disease Control and Prevention of Ning Xia Hui Autonomous
Region, Yinchuan, Ningxia, China.
41. Health Supervision Institute of Xixia District in Yinchuan, Ning Xia Hui
Autonomous Region, Yinchuan, Ningxia, China.
42. Qing Hai Center for Disease Control and Prevention, Xining, Qinghai, China.
43. Qinghai Cardio-Cerebrovascular Disease Special Hospital, Xining, Qinghai,
China.
44. First Affiliated Hospital of Xi’an Jiaotong University, Xian, Shaanxi, China.
45. Institute of Basic Medicine, Shandong Academy of Medical Sciences, Jinan,
Shandong, China.
46. Zhongshan Hospital, Fudan University, Shanghai, China.
47. Shanxi Cardiovascular Hospital, Taiyuan, Shanxi, China.
48. Wuxiang County People’s Hospital, Wuxiang, Shanxi, China.
49. Jianhong Tao, Yijia Tang, Sichuan Provincial People’s Hospital, Chengdu,
Sichuan, China.
50. Sichuan Cancer Hospital, Chengdu, Sichuan, China.
51. Tianjin Academy of Traditional Chinese Medicine, Tianjin, China.
52. Tianjin Municipal Commission of Health and Family Planning, Tianjin,
China.
53. Tianjin Medical University, Tianjin, China.
54. Chinese People’s Liberation Army General Hospital, Lasha, Tibet, China.
55. People’s Hospital of Xinjiang Uygur Autonomous Region, Urumuqi, Xinjiang, China.
56. First Affiliated Hospital of Kunming Medical University, Kunming, Yunnan,
China.
57. Center for Disease Prevention and Control of Yunnan, Kunming, Yunnan,
China.
Page 10 of 11
58. Affiliated Yan’an Hospital of Kunming Medical University, Kunming, Yunnan,
China.
59. Zhejiang Hospital, Hangzhou, Zhejiang, China.
Financial disclosure
No financial disclosures were reported by the authors of this paper.
Authors’ contributions
YH prepared the draft manuscript. LZ designed the concept of the study and
statistically analyzed the data. XW, ZC, LS, YT and CZ effectively worked for the
data collection. LC, XC, HZ and YT provided guidance on the study design and
editing. RG and ZW critically reviewed/edited the manuscript. All authors read
and approved the final manuscript.
Funding
The study was supported by the Chinese Academy of Medical Science (CAMS)
Innovation Fund for Medical Sciences (grant number 2017-I2M-1–004),
China National Science & Technology Pillar Program (2011BAI11B01), Special
Research Fund for Public Welfare Projects of National Health and Family Planning Commission, China (201,402,002), and the National Natural Science Foundation of China(81,973,117), the surveillance of Cardiovascular Disease and its
risk factors in Chinese residents.
Availability of data and materials
The dataset analyzed during the current study is available from the corresponding author on reasonable request.
Declarations
Ethics approval and consent to participate
Written informed consent was obtained from each participant before data
collection. This study (No. 2011BAI11B01) was approved by the ethics committee of Fuwai Hospital, Beijing, China. All procedures were in accordance with
the 1964 Helsinki Declaration.
Consent for publication
Not applicable.
Competing interests
The authors declare that they have no competing interests.
Author details
1
Division of Prevention and Community Health, National Center for Cardiovascular Disease, National Clinical Research Center of Cardiovascular Diseases,
State Key Laboratory of Cardiovascular Disease, Fuwai Hospital, Peking Union
Medical College & Chinese Academy of Medical Sciences, No. 15 (Lin), Fengcunxili, Mentougou District, Beijing 102308, China. 2 Department of Cardiology,
National Center for Cardiovascular Disease, National Clinical Research Center
of Cardiovascular Disease, State Key Laboratory of Cardiovascular Disease,
Fuwai Hospital, Peking Union Medical College & Chinese Academy of Medical
Sciences, No. 167, Beilishilu, Xicheng District, Beijing 100037, China.
Received: 11 May 2022 Accepted: 26 September 2022
References
1. Fan W, Huang Y, Zheng H, et al. Ginsenosides for the treatment of
metabolic syndrome and cardiovascular diseases: Pharmacology and
mechanisms. Biomed Pharmacother. 2020;132:110915.
2. Ansarimoghaddam A, Adineh HA, Zareban I, et al. Prevalence of metabolic syndrome in Middle-East countries: Meta-analysis of cross-sectional
studies. Diabetes Metab Syndr. 2018;12(2):195–201.
3. Li R, Li W, Lun Z, et al. Prevalence of metabolic syndrome in Mainland China: a meta-analysis of published studies. BMC Public Health.
2016;16:296.
4. Mottillo S, Filion KB, Genest J, et al. The metabolic syndrome and cardiovascular risk a systematic review and meta-analysis. J Am Coll Cardiol.
2010;56(14):1113–32.
Huang et al. BMC Public Health
(2022) 22:1869
5. Alberti KG, Zimmet PZ. Definition, diagnosis and classification of diabetes
mellitus and its complications. Part 1: diagnosis and classification of
diabetes mellitus provisional report of a WHO consultation. Diabet Med.
1998;15(7):539–53.
6. Expert Panel on Detection, Evaluation, and Treatment of High Blood Cholesterol in Adults. Executive Summary of The Third Report of The National
Cholesterol Education Program (NCEP) Expert Panel on Detection, Evaluation, And Treatment of High Blood Cholesterol In Adults (Adult Treatment
Panel III). Jama. 2001;285(19):2486–97. https://doi.org/10.1001/jama.285.
19.2486.
7. Grundy SM, Cleeman JI, Daniels SR, et al. Diagnosis and management
of the metabolic syndrome: an American Heart Association/National
Heart, Lung, and Blood Institute Scientific Statement. Circulation.
2005;112(17):2735–52.
8. Alberti KG, Zimmet P, Shaw J. The metabolic syndrome–a new worldwide
definition. Lancet. 2005;366(9491):1059–62.
9. Zhu J, Gao R, Zhao S, et al. Chinese guidelines on prevention and treatment of dyslipidemia in adults (2016 Revised Edition). Chinese Circulation
Journal. 2016;31(10):937–53.
10. Kelliny C, William J, Riesen W, et al. Metabolic syndrome according to
different definitions in a rapidly developing country of the African region.
Cardiovasc Diabetol. 2008;7:27.
11. Saukkonen T, Jokelainen J, Timonen M, et al. Prevalence of metabolic syndrome components among the elderly using three different definitions: a
cohort study in Finland. Scand J Prim Health Care. 2012;30(1):29–34.
12. Athyros VG, Ganotakis ES, Bathianaki M, et al. Awareness, treatment and
control of the metabolic syndrome and its components: a multicentre
Greek study. Hellenic J Cardiol. 2005;46(6):380–6.
13. Li Y, Zhao L, Yu D, et al. Metabolic syndrome prevalence and its risk factors
among adults in China: A nationally representative cross-sectional study.
PLoS ONE. 2018;13(6):e0199293.
14. Farmanfarma KK, Kaykhaei MA, Mohammadi M, et al. The Prevalence
and Trend of Metabolic Syndrome in the South-East of Iran. J Med Life.
2020;13(4):587–99.
15. Aguilar M, Bhuket T, Torres S, et al. Prevalence of the metabolic syndrome
in the United States, 2003–2012. JAMA. 2015;313(19):1973–4.
16. Lan Y, Mai Z, Zhou S, et al. Prevalence of metabolic syndrome in China: An
up-dated cross-sectional study. PLoS ONE. 2018;13(4):e0196012.
17. Liu Q, Li YX, Hu ZH, et al. Comparing associations of different metabolic
syndrome definitions with ischemic stroke in Chinese elderly population.
Eur J Intern Med. 2018;47:75–81.
18. Wang Z, Chen Z, Zhang L, et al. Status of Hypertension in China:
Results From the China Hypertension Survey, 2012–2015. Circulation.
2018;137(22):2344–56.
19. Wang Z, Zhang L, Chen Z, et al. Survey on prevalence of hypertension in China: background, aim, method and design. Int J Cardiol.
2014;174(3):721–3.
20. Zhou BF. Predictive values of body mass index and waist circumference
for risk factors of certain related diseases in Chinese adults–study on
optimal cut-off points of body mass index and waist circumference in
Chinese adults. Biomed Environ Sci. 2002;15(1):83–96.
21. Liu Q, Li Y-X, Hu Z-H, et al. Comparing associations of different metabolic
syndrome definitions with ischemic stroke in Chinese elderly population.
Eur J Intern Med. 2018;47:75–81.
22. Khosravi-Boroujeni H, Ahmed F, Sadeghi M, Roohafza H, Talaei M,
Dianatkhah M, et al. Does the impact of metabolic syndrome on cardiovascular events vary by using different definitions? BMC Public Health.
2015;15(1):1313. https://doi.org/10.1186/s12889-015-2623-3.
23. Liu B, Chen G, Zhao R, et al. Temporal trends in the prevalence of
metabolic syndrome among middle-aged and elderly adults from 2011
to 2015 in China: the China health and retirement longitudinal study
(CHARLS). BMC Public Health. 2021;21(1):1045.
24. Patni R, Mahajan A. The Metabolic Syndrome and Menopause. Journal of
mid-life health. 2018;9(3):111–2.
25. Wu LT, Shen YF, Hu L, et al. Prevalence and associated factors of metabolic
syndrome in adults: a population-based epidemiological survey in Jiangxi
province, China. BMC Public Health. 2020;20(1):133.
26. McKinlay SM, Brambilla DJ, Posner JG. The normal menopause transition.
Maturitas. 1992;14(2):103–15.
27. Colafella KMM, Denton KM. Sex-specific differences in hypertension and
associated cardiovascular disease. Nat Rev Nephrol. 2018;14(3):185–201.
Page 11 of 11
28. Zamboni M, Mazzali G, Zoico E, et al. Health consequences of obesity
in the elderly: a review of four unresolved questions. Int J Obes (Lond).
2005;29(9):1011–29.
29. Yu S, Yang H, Guo X, et al. Prevalence of hyperuricemia and its correlates
in rural Northeast Chinese population: from lifestyle risk factors to metabolic comorbidities. Clin Rheumatol. 2016;35(5):1207–15.
30. Ranasinghe P, Mathangasinghe Y, Jayawardena R, et al. Prevalence and
trends of metabolic syndrome among adults in the asia-pacific region: a
systematic review. BMC Public Health. 2017;17(1):101–101.
31. Yang JJ, Yoon HS, Lee SA, et al. Metabolic syndrome and sex-specific
socio-economic disparities in childhood and adulthood: the Korea
National Health and Nutrition Examination Surveys. Diabet Med.
2014;31(11):1399–409.
32. Kim OY, Kwak SY, Kim B, et al. Selected Food Consumption Mediates the
Association between Education Level and Metabolic Syndrome in Korean
Adults. Ann Nutr Metab. 2017;70(2):122–31.
33. Belfki H, Ben Ali S, Aounallah-Skhiri H, et al. Prevalence and determinants
of the metabolic syndrome among Tunisian adults: results of the Transition and Health Impact in North Africa (TAHINA) project. Public Health
Nutr. 2013;16(4):582–90.
34. Reaven G, Tsao PS. Insulin resistance and compensatory hyperinsulinemia: The key player between cigarette smoking and cardiovascular
disease? J Am Coll Cardiol. 2003;41(6):1044–7.
35. Winsløw UC, Rode L, Nordestgaard BG. High tobacco consumption lowers body weight: a Mendelian randomization study of the Copenhagen
General Population Study. Int J Epidemiol. 2015;44(2):540–50.
36. Opoku S, Gan Y, Fu W, et al. Prevalence and risk factors for dyslipidemia
among adults in rural and urban China: findings from the China National
Stroke Screening and prevention project (CNSSPP). BMC Public Health.
2019;19(1):1500–1500.
37. Suliga E, Kozieł D, Ciesla E, et al. Consumption of Alcoholic Beverages and
the Prevalence of Metabolic Syndrome and Its Components. Nutrients.
2019;11(11):2764.
38. Walker RK, Cousins VM, Umoh NA, et al. The good, the bad, and the
ugly with alcohol use and abuse on the heart. Alcohol Clin Exp Res.
2013;37(8):1253–60.
39. Chiva-Blanch G, Badimon L. Benefits and Risks of Moderate Alcohol Consumption on Cardiovascular Disease: Current Findings and Controversies.
Nutrients. 2019;12(1):108.
Publisher’s Note
Springer Nature remains neutral with regard to jurisdictional claims in published maps and institutional affiliations.
Ready to submit your research ? Choose BMC and benefit from:
• fast, convenient online submission
• thorough peer review by experienced researchers in your field
• rapid publication on acceptance
• support for research data, including large and complex data types
• gold Open Access which fosters wider collaboration and increased citations
• maximum visibility for your research: over 100M website views per year
At BMC, research is always in progress.
Learn more biomedcentral.com/submissions