No 1 the table belows percentages of consumer expenditure for three categories
Bạn đang xem bản rút gọn của tài liệu. Xem và tải ngay bản đầy đủ của tài liệu tại đây (289.13 KB, 2 trang )
No.1
The table below gives infomation on consumer spending on different items in
fives different countries in 2002. Write a report for a university lecturer describing the
information shown below. Make comparisons where revelant.
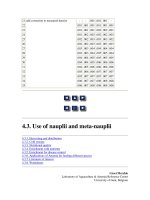
Percentage of national consumer expenditure by category – 2002
Country
Food/drinks/
Clothing/
Leisure/
tobacco
footwear
education
Ireland
28.91%
6.43%
2.21%
Italy
16.36%
9.00%
3.20%
Spain
18.80%
6.51%
1.89%
Swenden
15.77%
5.40%
3.22%
Turkey
32.14%
6.36%
4.35%
The table shows percentages of consumer expenditure for three categories of
products and services in five countries in 2002.
It is clear that the largest proportion of consumer spending in each country went
on food, drink and tobacco. On the other hand, the leisure and education category has the
lowest percentages in the table.
Out of the five countries, consumer spendign on food, drinks and tobacco was
noticeably higher in Turkey, at 32.14% and Ireland at near 29%. The proportion of spending
on leisure and education was also highest in Turkey, at 4.35%, while expenditure on
clothing and footwear was significantly higher in Italy, at 9% than in any of the other
country.
It can be seen that Swenden had the lowest percentages of national consumer
expenditure for food/drinks and tobacco and for clothing/footwear, at near 16% and just
over 5% respectively. Spain had slightly higher figures for these categories, but the lowest
figure for leisure and education, at almost 2%. (155 words)
Một số cấu trúc cần ghi nhớ
1. The table shows percentages of .... ( câu mở đầu mang tính khái qt nội dung của bảng
biểu và thơng tin có trong bảng ). Có thể dùng một số mẫu sau
- The table gives information about ....
- The .... compares ....
- The .... makes a comparies between ... and ..... (dành cho bảng biểu, biểu
đồ có ít đối tượng hoặc yếu tố so sánh )
- The .... shows data about....
2. Các từ vựng để mô ta bảng biểu
- As can be seen from the graph ...
- It can be seen from the graph that ....
- It can be concluded from the graph that ...
- It is clear that .....
- It is clear from the .... that .....
3. Dùng giới từ “at” để thêm con số vào cuối câu
Eg: .... , at 32.14% % and Ireland at near 29%.
4. Cấu trúc của bài task 1 cần nhớ :
- Introdution – khái quát nội dung của bảng biểu
- Overview/summary – các đặc điểm cần so sánh, nhấn mạnh, tiêu biểu của
bảng biểu
- Specific details – viết thành 2,3 đoạn riêng biệt