Manitoba Economic Highlights pot
Bạn đang xem bản rút gọn của tài liệu. Xem và tải ngay bản đầy đủ của tài liệu tại đây (257.68 KB, 5 trang )
Note:Changesarecalculatedrelativetothe
correspondingperiodinthepreviousyear.Updated:April16,2013Page1of5
ManitobaEconomicHighlights
EconomicOverview
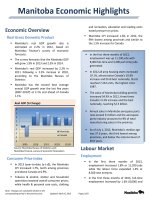
RealGrossDomesticProduct
Manitoba’s real GDP growth rate is
estimated at 2.2% in 2012, based on
Manitoba Finance’s survey of economic
forecasts.
ThesurveyforecaststhattheManitobaGDP
willgrow1.9%in2013and2.3%in2014.
Manitoba’s real GDP increased by 2.2% in
2011 following a 2.3% increase in 2010,
according to the Manitoba Bureau of
Statistics
Manitoba has the second best average
annual GDP growth over the last five years
(2007‐2012f) at 2.1% and ahead of Canada
1.1%.
ConsumerPriceIndex
In 2013 (year‐to‐date (y‐t‐d)), the Manitoba
CPI increased 1.7%, tenth among provinces
andaboveCanadaat0.9%.
Tobacco & alcohol, shelter and household
operationsboostedoverallconsumerprices,
while health & personal care costs, clothing
and recreation,educationand reading costs
easedpressureonprices.
Manitoba CPI increased 1.6% in 2012, the
fifth lowest among provinces and similar to
the1.5%increaseforCanada.
LabourMarket
Employment
In the first three months of 2013,
employment increased 1.8% or 11,200 jobs
while the labour force expanded 1.3% or
8,500newentrants.
In the first three months of 2013, full‐time
employment increased by 1.6% (8,000) and
Inthefirstthreemonthsof2013,
employmentwasup11,200jobswith
8,000full‐timeand3,200part‐timejobs
generated.
In2012allareahousingstartsincreased
19.1%,almosttwiceCanada’s10.8%
increaseandthirdbestnationally.Starts
reached7,242units,thehighestsince
1987.
ThevalueofManitobabuildingpermits
increased34.9%in2012,threetimes
Canada’s9.3%increaseandthebest
nationally,reaching$2.5billion.
AnnualsalesinManitobaaerospaceparts
nowexceed$1billionandtheaerospace
partsindustryaccountsfor8%oftotal
manufacturingsalesintheprovince.
AsofJuly1,2012,Manitoba'smedianage
was37.6years,thethirdlowestamong
provinces,andbelowthenationallevelof
40.0
y
ears.
RealGDP(%Change)
Source:ManitobaBureauofStatisticsand;
ManitobaFinance,surveyofeconomicforecasters.
‐4
‐3
‐2
‐1
0
1
2
3
4
2009 2010 2011 2012f 2013f
Manitoba
Canada
Note:Changesarecalculatedrelativetothe
correspondingperiodinthepreviousyear.Updated:April16,2013Page2of5
ManitobaEconomicHighlights
part‐time employment increased 2.6%
(3,200).
In 2012, Manitoba’s employment increased
0.9%andManitoba’slabourforceexpanded
0.8%. In 2012, Manitoba’s employment
growth ranked sixth highest among
provinces.
UnemploymentRate
In the first three months of 2013,
Manitoba’s unemployment rate was 5.0%,
thirdlowestamongprovincesandbelowthe
7.2%nationalaverage.
In2012,Manitoba’sunemploymentratewas
5.3%,thirdlowestbehindSaskatchewanand
Alberta. The youth unemployment rate was
11.0%,thethirdlowestinCanada.
Over the past 13 years, Manitoba’s
unemployment rate has averaged 2.2
percentagepointsbelowCanada.
AverageWeeklyEarnings
InJanuary 2013,averageweeklyearningsin
Manitoba were up 1.6%, eight among
provincesandabovethenationalincreaseof
2.8%.
In 2012, average weekly earnings in
Manitoba were up 2.7%, tied for seventh
among provinces and above the national
increaseof2.5%.
Population
As of January 1, 2013, Manitoba’s
population stood at 1,274,279 a one‐year
increase of 14,904 persons, a one year
increase of 1.2%. This is the fourth
consecutive 12 month period of population
growthaheadofthenationalrate.
As of July 1, 2012, Manitoba's median age
was 37.6 years, the third lowest among
provinces, and below the national level of
40.0years.
NetMigration
For the year ending January 1, 2012, 9,116
morepeoplemovedtoManitobathanleft.
Duringthesameperiod,netinternationalin‐
migration totalled 11,223 and net inter‐
provincial out‐migration totalled 3,926.
Naturalincreasetotalled5,788.
EconomicActivity
ManufacturingSales
In 2013 (y‐t‐d), Manitoba manufacturing
sales decreased 0.4%, the same as the
national decrease and ranked sixth among
provinces. Sales of wood, chemicals,
electrical products, printing, plastics and
rubber, machinery, food, and aerospace
parts are leading growth while fabricated
metals, transportation equipment and non‐
metallicmineralslaggrowth.
In 2012, Manitoba manufacturing sales
increased1.4%comparedtoa3.5%national
increase and ranked sixth among provinces
withsevenof11sub‐sectorsadvancing.
Employment(%Change)
2012 2013(ytd)
Manitoba
TotalEmployment 0.9 1.8
Full‐Time 1.1 1.6
Part‐Time
Canada
0.1 2.6
TotalEmployment 1.2 1.6
Note:Changesarecalculatedrelativetothe
correspondingperiodinthepreviousyear.Updated:April16,2013Page3of5
ManitobaEconomicHighlights
Annual sales in Manitoba aerospace parts
now exceed $1 billion and the industry
accountsfor8%oftotalmanufacturingsales
intheprovince.
FarmCashReceipts
Inthefirstthreequartersof2012,Manitoba
farm cash receipts are up 1.0%. Crop
receipts decreased 2.5% due to declines in
oilseeds14.8%andwheatreceipts58.6%.
Livestock receipts were up 4.0% with
strength across all components, hogs up
2.9%andcattleup5.4%.
Direct payments, which
include insurance
and various types of income supports,
increased8.5%.
Crop production rebounded in 2012, from
twoyearsoffloodingandbadweather,with
increases in all crops: wheat 76%, canola
20%, corn forgrain97%,soybeans84%and
barley137%.
In2011,Manitobacashreceiptsincreasedto
$4.9 billion. Manitoba’s 2.2% increase was
thesecondlowestamongprovinces.
RetailSales
In 2013 (y‐t‐d), Manitoba retail sales
increased by 1.6% compared to a 2.9%
national decrease and ranked seventh
amongprovinces.
Inthefirsttwomonthsof2013,newmotor
vehicleunitsaleswereup5.8%,best among
provinces and above the national decline of
3.1%.In2012newmotorvehiclesaleswere
up 7.6%, sixth among provinces and better
thanthenationalincreaseof5.9%.
In 2012, Manitoba retail sales increased
1.4%, below the Canadian increase of 2.4%
andseventhbestamongprovinces.
2012 retail sales rose on the strength of
furniture5.5%,departmentstore
sales4.5%,
clothing 4.2% and sporting goods sales up
3.9% – sales of electronics and appliances
were down 6.4%, personal services down
2.7%,andgasolinesalesdeclined1.8%.
Investment
Statistics Canada’s Private and Public
Investment Survey released February 2013
projected Manitoba’s capital investment to
increase 8.5%, above the Canadian increase
of1.7%.
Manitoba’s private investment is projected
to increase 6.3% and public investment to
increase12.9%.
FarmCashReceipts(%Change)
2011 2012(ytd)
Canola (1.0) (17.0)
Wheat 6.5 (58.6)
Hogs 13.3 2.9
Cattle (5.2) 5.4
TotalFarmCash 2.2 1.0
LeadingIndustrieswithStrongest
GrowthManufacturingSales(%Change)
2011 2012
Wood ‐2.0 19.8
Aerospaceparts 9.1 16.2
Machinery 24.2 10.9
TotalSales 6.21.4
Note:Changesarecalculatedrelativetothe
correspondingperiodinthepreviousyear.Updated:April16,2013Page4of5
ManitobaEconomicHighlights
A number of major investment projects are
currently underway, including, IKEA at the
Seasons of Tuxedo shopping complex, and
thestadiumatUniversityofManitoba.
Manitoba’s capital investment for 2012 was
reviseduptoa9.7%increase,fromthe4.7%
increaseforecastlastFebruary.
Manitoba’s total capital investments
increased to a record $12.3 billion in 2012.
Private investment increased 4.9% while
publiccapitalinvestmentincreased21.1%.
From 2006 to 2011, Manitoba private
investmenthasincreased by 34% compared
to a 14% national increase. Over the same
period, Manitoba total investment has
increased 45% compared to a 22% national
increase.
HousingStarts
In 2012, Manitoba all area housing starts
increased 19.1% almost double the 10.8%
national increase and the third best growth
among provinces. Manitoba starts reached
7,242 units, the highest level since 1987.
Single starts were up 8.8% (4,169 units –
now the highest since 1987) and multiples
increased 36.5% (3,073
units also the best
since1987).
Inthefirstthreemonthsof2013,Manitoba
urban area housing starts increased 21.0%,
fourth best among provinces and better
thanthe17.0%nationaldecline.Singlestarts
were up 5.0% and multiples starts are up
36.9%.Urbanhousingstartsrepresentabout
70%ofallstartsintheprovince.
Manitoba all area housing starts increased
3.3%in2011to6,083
units,higherthanthe
2.1% national increase. Single starts were
down 3.6% (3,831 units) while multiples
wereup17.8%(2,252units).
In 2012, total and multiple starts were at
theirhighestlevelsince1987.
Manitoba’sgrowthinhousingstartsin2011
was fifth highest among provinces and
abovethenationalaverage.
Manitoba urban area housing starts
increased 18.1% in 2012 to 4,910 units, the
highest level since 1987. Manitoba urban
housing starts growth was above the
national increase of 11.0%. Single starts
were up 4.3% (2,502 units) while multiples
were up 36.9% (2,408 units) the highest
levelsince1987.
BuildingPermits
Inthefirsttwomonthsof2013,thevalueof
Manitoba building permits increased 21.6%,
betterthan Canada’s7.5%decline andthird
nationally.
Manitoba residential permits increased
(15.6%) and non‐residential permits
increased (31.2%). Non‐residential building
permits were supported by: industrial
permits (30.5%); commercial permits
(27.6%);andinstitutional
permits(44.7%).
Total permits in Winnipeg increased 35.8%
while outside of Winnipeg they declined
14.3%.
In 2012, the value of Manitoba building
permitsincreased34.9%,thehighestgrowth
HousingStarts(AllAreas)(%Change)
Manitoba Canada
2009 (24.6) (29.4)
2010 41.1 27.4
2011 3.3 2.1
2012 19.1 10.8
Note:Changesarecalculatedrelativetothe
correspondingperiodinthepreviousyear.Updated:April16,2013Page5of5
ManitobaEconomicHighlights
among provinces and above the national
increaseof9.3%.
Bankruptcies
InJanuary2013,businessbankruptcieswere
up 66.7% in Manitoba, and ranked eighth.
Business bankruptcies are down 12.7% in
Canada.
In January 2013, consumer bankruptcies
were down 13.7% in Manitoba, tied for
secondwithAlberta.Consumerbankruptcies
areup0.8%inCanada.
In 2012, business bankruptcies were down
40.0% in Manitoba, more than three times
better than Canada, down 11.2%, and best
nationally.
In 2012, consumer bankruptcies were down
15.7% in Manitoba, almost double Canada’s
decline of 8.3%, and fourth best among
provinces.
ForeignMerchandiseExports
In the first two months of 2013, Manitoba
exports increased 1.1%, while Canadian
exportsweredown0.8%.
Inthefirst twomonths of2013,Manitoba’s
U.S. exports increased 3.8% while non‐U.S.
exportsweredown4.4%.
In 2012, Manitoba exports declined 4.8%,
while Canadian exports were up 2.0%.
Manitoba U.S. exports were up 4.5% and
Manitoba’snon‐U.S.exportsdeclined19.1%.
Hydro‐ElectricitySales
Inthefirsttwomonthsof2013,thevalueof
hydro sales increased 14.3% with a 14.7%
increase in domestic sales being further
supported by a 11.1% increase in export
sales.
Exports to other Canadian provinces
.increased3.1%whileU.S.exportsadvanced
13.1%.
In 2012, the value of hydro sales declined
2.8% with a 0.9% drop in domestic sales
being further reduced by a 9.3% decline in
exportsales.
ForeignMerchandiseExports
(%Change)
2012 2013 (ytd)
AllCountries ‐4.81.1
U.S. 4.53.8
Non‐U.S. ‐19.1‐4.4
ManitobaFinance
EconomicandFiscalAnalysisBranch,Taxation,
EconomicandIntergovernmentalFiscal
ResearchDivision‐(204)945‐3757
Director:NarendraBudhia
Manager:JeffPowell
Analyst:RobbBalacko
Analyst:StephenVerhaeghe
Pleaseclickoneconomicstatistics
toviewthedata
underlyingthisreport.
Note:The2013ManitobaBudget
isavailableat:
ManitobaBudgetApril16,2013