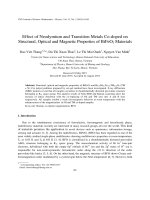
Effects of Fe dopant on structural, optical and electrical properties of NiTiO3 materials
Bạn đang xem bản rút gọn của tài liệu. Xem và tải ngay bản đầy đủ của tài liệu tại đây (741.3 KB, 8 trang )
JST: Engineering and Technology for Sustainable Development
Volume 32, Issue 3, July 2022, 051-058
Effects of Fe Dopant on Structural, Optical and Electrical Properties
of NiTiO3 Materials
1
Tran Vu Diem Ngoc1, Luong Huu Bac2,*
School of Materials Science and Engineering, Hanoi University of Science and Technology, Hanoi, Vietnam
2
School of Engineering Physics, Hanoi University of Science and Technology, Hanoi, Vietnam
*
Email:
Abstract
In this study, the effects of Fe dopant on the structural, optical, and electrical properties of NiTiO3 materials
prepared by sol-gel method were investigated. The prepared powders were investigated through X-ray
diffraction, Raman scattering, scanning electron microscope, UV-visible absorption, vibrating sample
magnetometer, electrical measurement to explore the structural, ferromagnetic, and electrical properties. The
single-phase Ni1-xFexTiO3 (x = 0, 0.05 and 0.10) materials were obtained. Doping of Fe into NiTiO3 lead to the
decreasing of lattice parameter and increased the particle size compared to the undoped sample. Ferroelectric
and ferromagnetic properties of all Fe-doped NiTiO3 ceramics have been investigated at room temperature.
The ferromagnetic hysteresis loop of the Fe-doped NiTiO3 sample at room temperature is due to the formation
of oxygen vacancies and their associated exchange interaction. Ferroelectric properties of Fe doped samples
were decreased with the increase of Fe concentration. This can be due to the Fe dopant into NiTiO3 material.
The Fe dopant caused to increase the conductivity of NiTiO3 sample which resulted in a decrease in
ferroelectric parameters.
Keywords: NiTiO3, ferroelectric properties, conductivity, dopant, ilmenite.
1. Introduction
research because of its many interesting physicochemical properties. This
material can be
tremendously potential for many of applications such
as photocatalyst under visible-light irradiation, fuel
cells, gas sensor, pigment, and spin electronic devices
[4]. NiTiO3 belongs to the ilmenite type structure with
both Ni and Ti processing octahedral coordination and
the alternating cation layers occupied by Ni2+ and Ti4+
alone [5]. NiTiO3 is a kind of n-type semiconductor
with a band gap of round 2.18 eV while the activation
energy of single crystal NiTiO3 is observed in the
range from 0.738 eV to 1.06 eV. Bulk NiTiO3
exhibited the antiferromagnetism with a Neel
temperature of 15-22 K [5].
Enhancement of ferromagnetic properties in
ferroelectric materials has been studied in order to
expand practical applications of ferroelectric
materials. For ferroelectric materials, enhancement of
magnetic properties can be done by doping transition
metal materials into ferroelectric substrates. Many
studies have shown that doping transition metals such
as Fe, Co, Mn... can change the magnetic properties of
materials. Lihong Yang et. al. investigated the effect
of Fe dopant on the magnetic properties of BaTiO3 [1].
The results showed that room temperature hysteresis
loops of the BaTi1−xFexO3 samples are observed with
doping level x from 0.2 and 0.5. The Ms firstly
increased and then decreased with increasing doping
concentration which indicated the coexistence
of ferromagnetism and antiferromagnetism. Xu et. al.
investigated the room temperature ferromagnetism in
Fe-doped BaTiO3 and predicted the magnetic moment
per Fe atom of ~3.05 μB [2]. Attaphol Karaphun et. al.
studied the magnetic properties of Fe-doped SrTiO3
nanopowders prepared by hydrothermal method [3].
Results showed that the undoped samples behave
paramagnetic, whereas the Fe-doped samples are
ferromagnetic. It was suggested that the observed
ferromagnetism in Fe doped SrTiO3 originated from
the F-center mechanism.
*
Doping or compositing to modify the properties
of NiTiO3 materials have been investigated and there
are a number of reports to dope and composite with
NiTiO3. However, most of the work only concentrated
on the structural and optical properties of NiTiO3
materials. Yi-Jing Lin et. al. described the synthesis of
the NiTiO3 containing different amounts of silver by
the modified Pechini method. The apparent
enhancement in the reduction of methylene blue can be
ascribed to simultaneous effects of Ag deposits by
acting as electron traps and improving the
photocatalytic properties of the Ag-NiTiO3 in
decolorization of methylene blue which was released
from the industry-leading to environmental
contamination in ecosystem [4]. Fujioka et al.
Nickel titanate (NiTiO3) is a material of the
ilmenite family that has been interested in recent
ISSN 2734-9381
/>Received: March 24, 2022; accepted: May 19, 2022
51
JST: Engineering and Technology for Sustainable Development
Volume 32, Issue 3, July 2022, 051-058
pressed into pellets using a cylindrical steal die of
10 mm in diameter. The powder mixture was pressed
with a uniaxial hydraulic press at a pressure of
106 N/m2.
prepared Ni1-xCoxTiO3 (0.05 ≤ x ≤ 0.80) solid solution
using a solid-state technique and studied the structural
distortion using Raman analysis [6]. The transition was
assigned to mixing of Ni, Co, and Ti cations, resulting
in a transition from the ilmenite structure to a
disordered structure. Vacant octahedra were suggested
to play an important role in the structural
ferromagnetic
transformation.
Fe3+/NiTiO3
nanoparticles were reported by Nayagam Lenin et al
[7]. The impedance analysis of ferromagnetic
materials explores the ferro-dielectric behavior with
enhanced properties of Fe3+/NiTiO3 nanoparticles with
an increasing of Fe dopant. The observed results
concluded that improved properties of magnetic
nanoparticles were found as an influence of nucleation
reaction rate with addition of higher Fe content.
The sintering procedure is very important to keep
the sample to avoid crack which significantly affected
the electrical properties of materials. The pressed
pellets were heated up to 500 oC with a heating rate of
5 oC/min and a dwell time of 2 h. Then, the temperature
continued increasing up to 1200 oC with heating rate
of 5 oC/min and dwell time of 5 h in the air atmosphere.
After finishing, the pellets were cooled down with
natural furnace cooling rate and pellets were taken out
of the furnace for analysis.
2.3. Characterization
In this work, we reported the investigation results
of structural, optical and electrical properties of Fedoped NiTiO3 nanoparticles synthesized using sol-gel
method. The Fe doping decreased the optical band gap
values from 2.23 eV and 1.79 eV, respectively. Fe
doping enhanced the magnetic properties of NiTiO3.
However, the increase of conductivity of NiTiO3 with
Fe dopant can consequently cause degradation and
lossy behavior in ferroelectric properties of NiTiO3.
The morphology of the nanopowders was
observed by field emission scanning electron
microscope (FE-SEM, JEOL JSM-7600F). The
crystalline structures of the samples were
characterized by X-ray diffraction (XRD, PhilipsX’PertPro) using Cu Kα radiation in 2θ from 20o to
70o. with a step size of 0.02o and a speed of 2°/min.
The vibrational and rotational modes in samples were
characterized by Raman spectroscopy (JASCO Raman
NRS-3000). The optical properties were studied by
UV-Vis spectroscopy (JASCO V- 750). The magnetic
properties were characterized by vibration samples
magnetometer (VSM, Lakeshore 7400) at room
temperature.
2. Experiment
2.1. Materials
The Fe-doped NiTiO3 (Ni1-xFexTiO3, x=0, 0.05
and 0.10) nanoparticles were synthesized using the solgel technique. The raw materials used consist of
tetraisopropoxytitanium (IV) (C12H28O4Ti), nickel
and
iron
nitrate
nitrate
(Ni(NO3)2.6H2O),
(Fe(NO3)3.9H2O). The citric acid solution (C6H8O7)
was selected as the solvent. These chemicals were
utilized in the synthesis of the samples used with
distilled water.
In order to prepare the sample for electrical
measurement, the sintered pellet samples were
polished to make a flat and smooth surface. The
polished pellets were washed with ethanol by
ultrasonic machine and dried at 60 oC for 1 h. A thin
layer of silver was coated on both sides of the sintered
samples by screen printing technique to make the
surface parallel electrodes. The electrode silver
deposited samples were then heated at 700 oC for
30 min. DC electrical resistivity was estimated by
employing two probe procedures. A P–E hysteresis
loop tracer was used to measure the electrical
hysteresis loops.
2.2. Sample Preparation
The experimental procedure for the NiTiO3 and
Fe-doped NiTiO3 samples was as follows. Firstly, 2 ml
of the tetraisopropoxytitanium (IV) was dissolved in
citric acid solution at 70 oC. A transparent
homogeneous sol was formed after stirring vigorously
for 2 h. Then, the 1.96 g nickel nitrate was introduced
with mol of Ni equal to mol of Ti for fabricating of
NiTiO3. The additional amounts of iron nitrate were
added to the solution for preparing Fe-doped NiTiO3
samples. The solutions were stirred around 3-4 h. The
solutions were kept stirring around two hours and then
heated to around 120 oC to prepare dry gels. The dry
gels were ground and calcined from 900 oC for 3 hours.
3. Results and Discussion
3.1. XRD Analysis
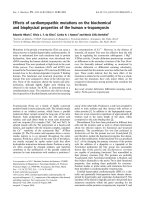
The X-ray diffraction analysis was used to
determine the purity of the synthesized powders. Fig. 1
shows the XRD patterns of NiTiO3 and Fe-doped
NiTiO3 samples which were annealed at 900 oC for 3 h.
The sharp diffraction peaks and low noise background
exhibited that the synthesized powders were
crystalline. All samples included the diffraction peaks
at 2θ = 24.03°, 32.99°, 35.55°, 40.76°, 49.34°, 53.90°,
57.35°, 62.35°, and 63.97°, and relative intensity were
well matched with the standard ICDD-PDF-00-0330960. These XRD results presented that the
synthesized powders belonged to the rhombohedral
2.3. Pellet Preparation and Sintering
The obtained powder after calcination was mixed
with a small amount of polyvinyl alcohol (PVA, 5%)
to constitute a homogeneous mixture. The mixture was
dried at 100 oC for 2 h. The resultant mixture was
52
JST: Engineering and Technology for Sustainable Development
Volume 32, Issue 3, July 2022, 051-058
crystal structure with R-3 space group. There was no
trace of impurity phases or second phases indicating
that Fe has successfully substituted Ni into the lattice
of NiTiO3. The peak position in XRD pattern shifted
to a lower 2θ diffraction angle which is related to the
expansion of the lattice parameter. The lattice
parameters are calculated from these XRD data using
unit cell software. All position of XRD diffraction
peak was carefully fitted using the Gaussian curve by
OriginLab pro software. The lattice parameter as
function of Fe dopant was estimated and shown in
Fig. 1(c) and Table 1. The result exhibited that the
lattice parameters of NiTiO3 decreased with increase in
Fe dopant concentration. These results happened
because of different radius of Ni and Fe ion in lattice.
The radius of Ni2+ ions is bigger than that of Fe2+ ions.
According to Shannon’s report, Ni2+ ions have a radius
of 0.69Å (in the coordination with VI) while Fe2+ ions
have a radius of 0.61Å [11].
20
a (Å)
α ( 0)
Volume
(Å3)
0
5.4365
55.08
100.62
0.05
5.4363
55.10
100.65
0.10
5.4362
55.11
100.67
To analyze the impact of Fe doping on crystal
structure stability, the tolerance factor, which is
defined for an ABO3-type ilmenite structure, was
calculated as follows
NTO-10Fe
NTO-5Fe
NTO
1 �√2+1�𝑅𝑅𝑂𝑂−2 +𝑅𝑅𝐵𝐵
�
𝑅𝑅𝑂𝑂−2 +𝑅𝑅𝐴𝐴
3
𝑡𝑡 = �
(214)
(300)
(018)
(024)
(113)
(202)
b
x
Fig.1(b) shows the magnification of X-ray
diffraction patterns of undoped and Fe-doped NiTiO3
samples in 2θ range from 32.5o-33.5o. The zoom-in
XRD peaks showed that the peak position of the Fe
doped samples slightly shifted toward a lower 2θ
value. This result provided evidence that Fe2+ cations
were incorporated in the lattice structure and replaced
on the Ni2+ site in lattice.
(116)
(104)
NTO-10Fe
NTO-5Fe
NTO
(110)
(012)
Intensity (a.u.)
a
Table 1. Lattice constant and volume of the
synthesized Fe doped samples
+
√2 𝑅𝑅𝑂𝑂−2
𝑅𝑅𝑂𝑂−2 +𝑅𝑅𝐵𝐵
(1)
where RA, RB, and RO are the ionic radii of A, B, and
O2- (1.4 Å), respectively. The tolerance factor for
NiTiO3 was 0.9647. The substitution of Fe2+ in Ni2+
resulted in a slight increase in tolerance factor.
3.2. Morphology and Particle Size
30
40
50
2θ (deg.)
60
70 32.5
33.0
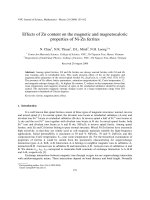
The effect of Fe dopant on the morphology and
particle size of synthesized powders were shown in
Fig. 2(a)-(c). Overall, the morphology of powders was
almost not influenced by Fe dopant. Clearly, the SEM
image showed that the surface of sample was nonuniform in size distribution. The grain of all samples
was almost irregular shape. The grains are looking like
polygonal structures with clear grain boundaries. The
morphological texture of the grains is looking smooth
and well arranged. Wide distribution in grain size was
observed in the SEM image. The NiTiO3 samples had
a grain size of around 100-350 nm. However, the grain
size of Fe doped NiTiO3 samples was larger and
inhomogeneous with higher Fe concentration dopants.
The grain sizes for Fe substituted sample are somewhat
larger than the undoped sample and this is due to the
effect of Fe dopant which helps in grain growth. The
average grain size measured in SEM image was around
120 nm to 460 nm for the 10 mol.% Fe doped NiTiO3
sample.
33.5
Furthermore, the energy dispersive spectra
(EDS) was analyzed to confirm the stoichiometric
composition of the synthesized materials which was
presented in Fig. 2d. The elemental weight
composition percentage is presented in the inset of
Fig. 2d. The presence of elements Ni, Ti, Fe, and O in
the sample indicated that all chemicals to form the
Fig. 1. a) XRD pattern of Fe doped NiTiO3 samples, b)
zoom-in of XRD pattern and c) lattice constant
53
JST: Engineering and Technology for Sustainable Development
Volume 32, Issue 3, July 2022, 051-058
phase existed in synthesized samples. As can be shown
in the figure and the data of weight and atomic
percentage compositions, the constituent elemental
compositions and the ratios are in line with expected
elemental compositions.
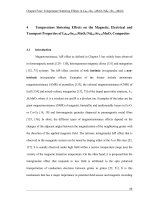
Fig. 3. Energy dispersive X-ray spectroscopy mapping
of the Fe-doped NiTiO3 sample.
In order to verify the distribution of the
metastable phase, EDS elemental mapping was
performed on the Fe doped sample. Fig. 3 showed EDS
mapping result of the Fe-doped NiTiO3 sample. The
EDS mapping presented a distribution of specific
elements which indicated by unique colors. The
element maps of Ni, Ti, Fe, and O reveal that all the
elements are uniformly distributed in the selected scan
area.
3.3. Vibration Analysis
Fig. 4 showed the Raman scattering of NiTiO3
and Fe-doped NiTiO3 samples at room temperature.
The theoretical calculation predicted that the optical
normal modes of vibrations of NiTiO3 material have
the ten active Raman modes 5Ag+ 5Eg [8]. In Fig. 4
the ten Raman active modes can be clearly seen which
confirmed the ilmenite structure of synthesized NiTiO3
materials. The peak positions were estimated to be
consistent with recent calculations for vibration modes
activity of NiTiO3 materials by M. A. Ruiz-Preciado
et. al. [9]. The band located at 720 cm-1 was related to
the Ti-O-Ti vibration of the crystal structure [9]. The
band modes at 617 cm-1 and 690 cm-1 were related to
the stretching of Ti-O and bending of O-Ti-O bonds
while the vibration mode at 547 cm-1 originated from
Ni-O bonds [10]. The vibration modes at 631.9 and
760.5 cm-1 resulted from stretching vibrations of TiO6
and octahedral vibrations in the region 500-830 cm-1
[11]. In addition, the vibration mode at 227.6 cm-1 can
result from the asymmetric breathing vibration of the
oxygen octahedral. Two vibration modes at 290.2 and
434.3 cm-1 can be related to the twist of oxygen
octahedral because of vibrations of the Ni and Ti atoms
parallel to the xy plane [9].
Fig. 2. a), b), c) SEM images of the Fe-doped NiTiO3
and d) EDS spectrum
54
JST: Engineering and Technology for Sustainable Development
Volume 32, Issue 3, July 2022, 051-058
NTO
NTO-5Fe
NTO-10Fe
Absorbance (a.u.)
Intensity (a.u.)
NTO-10Fe
NTO-5Fe
a
NTO
200
300
400
500
600
Wavenumber (cm
)
-1
700
400
800
500
600
700
800
900
Wavelength (nm)
b
NTO
NTO-5Fe
NTO-10Fe
(αhν)2 (eV/cm)2
Fig. 4. Raman spectra of the Fe-doped NiTiO3
The Raman analysis indicated that the ten Raman
active modes in synthesized NiTiO3 and Fe-doped
NiTiO3 sample confirmed the successful synthesis of
materials with ilmenite rhombohedral structure. The
shifted peaks in frequency modes at around 240 and
340 cm−1 to lower frequencies were suggested for
distortion of Ti–O and TiO6 vibrations due to Fe
cations substitution for Ni in host lattice of NiTiO3
materials because Fe cations are smaller than Ni
cations. Thus, the XRD and Raman scattering analysis
indicated that Fe dopant was well distributed and
substituted for Ni in NiTiO3 host crystal.
1.4
1.6
1.8
2.0
2.2
hν (eV)
2.4
2.6
2.8
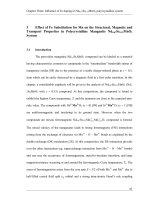
Fig. 5. a) UV-visible absorbance of the Fe-doped
NiTiO3 and b) (αhν)2 vs. hν curve
3.4. Optical Absorbance
Fig. 5 (a) shows the optical absorption
spectroscopy of NiTiO3 and Fe-doped NiTiO3 with
various Fe concentrations at room temperature. The
absorption band can be separated into two ranges
around 350-500 nm and 700-900 nm. In addition, the
NiTiO3 materials exhibited absorbance peaks at
around 380, 454, 504, 740, and 840 nm which
correspond to the photon energies of 3.26, 2.73, 2.46,
1.67 eV, and 1.48 eV, respectively. The optical
absorption results are in agreement with recently
reported for optical properties of NiTiO3 materials
where the absorbance peaks resulted from charge
transfer from Ni2+ to Ti4+ because of spin splitting of
Ni ions under crystal field. The Fe substitution for Nisite resulted in suppression of the 504 nm peak which
indicated disappearance of charge transfer at 2.46 eV.
Moreover, the Fe dopant in NiTiO3 resulted in
modification of electronic structure with the
absorbance edges of NiTiO3 material tending to shift
to visible wavelength with increasing Fe doping
concentration. Therefore, we suggested that Fe cation
substituted for Ni cation in ilmenite structure resulted
in induced new transition.
The optical band gap energy (Eg) was estimated
by using the Wood and Tauc method, where Eg values
are associated with the absorbance and photon energy
by the following equation (αhν) ~ (hν-Eg)n, where
α is the absorbance coefficient, h the Planck constant,
ν the frequency, Eg the optical band gap and n a
constant associated with different types of electronic
transition. We used n=1/2 for direct allowed transition
for estimation of the optical band gap energy. The plot
of (αhν)2 as function of photon energy (hν) was shown
in Fig. 5b. The optical band gap values were estimated
from extrapolating linear fitting. For NiTiO3 materials,
the largest band gap is expected to relate to the direct
electronic transition between the upper edge of O 2p
valence band and the lower edge for Ti 3d conduction
band. The optical bandgap of pure NiTiO3 samples was
2.23 eV. Our results are consistent with recent
observation of the optical band gap of pure NiTiO3
material [12]. The Fe doped NiTiO3 materials resulted
in decreasing in optical band gap from 2.23 eV to
1.79 eV for pure NiTiO3 and 10 mol.% Fe substitution
for Ni in host NiTiO3, respectively. The modification
optical band gap of NiTiO3 materials was recently
55
JST: Engineering and Technology for Sustainable Development
Volume 32, Issue 3, July 2022, 051-058
reported for doped NiTiO3 materials [4]. In addition,
the oxygen vacancies were created due to the
unbalance charge between substitution Fe3+ ions into
host Ni2+ ions, resulting reduction in the optical band
gap because the state oxygen vacancies are located
near the conduction band. Therefore, we suggested
that the reduction of optical band gap energy in NiTiO3
materials via Fe-dopants resulted from the new state of
Fe ions in the bandgap and/or promotion of oxygen
vacancies.
is the temperature in K. The activation energy was
calculated from the slope of Arrhenius plot of lnσ
against (1/T).
The activation energy plots of NiTiO3 ceramics
with different Fe doping concentration was shown in
Fig. 7.
0.6
0.4
The M-H curves of Ni1-xFexTiO3 (x = 0, 0.05 and
0.10) at room temperature were shown in Fig. 6.
Clearly, the Fe dopant samples exhibited the
ferromagnetism with typical M-H loops. The pure
NiTiO3 sample showed antiferromagnetic behavior
with very small remnant magnetization and a
negligible coercive field at room temperature.
When the Fe dopant concentration increased, the M-H
curve changed to ferromagnetic behavior. However,
the M-H loops did not reach saturation which
suggested the coexistence of ferromagnetism and
antiferromagnetism properties.
0.2
M (emu/g)
3.5 Analysis of Magnetic Properties
0.0
-0.2
-0.6
-18 -15 -12
𝑘𝑘𝐵𝐵 𝑇𝑇
-3
0
3
H (kOe)
6
9
12
15
18
180
0.06
160
140
0.04
120
100
Mr (emu/g)
0.08
Hc
Mr
200
Hc (kOe)
-6
b
220
0.02
80
60
DC electrical conductivity is one of the useful
characterization techniques to understand conductivity
mechanism. The variation of DC conductivity of
nanocomposites of different Fe dopant with
temperature was shown in Fig. 7. It is clear that the
conductivity does not vary uniformly with
composition. The conductivity of synthesized
ceramics depended on the Fe doping concentration and
also on the temperature. An increase in conductivity
depends on a particular doping concentration. Reports
from previous research showed that the conductivity of
ilmenite ceramics went up with an increase in
temperature. It is seen that, with the rise in
temperature, the DC conductivity increases, indicating
that the conduction is via a thermally activated
process. This shows that both NiTiO3 and Fe doped
NiTiO3 exhibit semiconducting behavior. The
variation of conductivity with temperature was
presented by Arrhenius equation which is given by
following:
�
-9
0.10
240
3.6. Analysis of Electrical Properties
−𝐸𝐸𝑎𝑎
NTO
NTO-5Fe
NTO-10Fe
-0.4
The ferromagnetic behavior in Fe doped NiTiO3
materials can result from the oxygen vacancies which
induced by Fe substituted to Ni in NiTiO3 and formed
the interaction between magnetic ions via oxygen
vacancies via F-center interaction. The determined
saturation magnetization values of 10 mol.% Fe doped
NiTiO3 samples can reach 0.482 emu/g. This is
significantly higher than that of pure NiTiO3 samples.
σ = 𝐴𝐴exp �
a
0.00
0.02
0.04
0.06
0.08
0.10
0.00
x mol. Fe
Fig. 6. VSM plots of the Fe-doped NiTiO3
-3
NTO
NTO-5Fe
NTO-10Fe
-4
-5
lnσdc (Sm-1)
-6
-7
-8
-9
-10
-11
-12
-13
-14
-15
(2)
where A is the pre-exponential factor, Ea is the
activation energy, kB is the Boltzmann constant and T
1.1
1.2
1.3
1.4
1.5
1000/T (K-1)
1.6
1.7
Fig. 7. DC conductivity of the Fe-doped NiTiO3
56
1.8
JST: Engineering and Technology for Sustainable Development
Volume 32, Issue 3, July 2022, 051-058
The activation energy of pure NiTiO3 was
0.82 eV. With changing Fe dopant in NiTiO3 crystal,
the activation energy was decreased to 0.56 eV for 5%
Fe doping and 0.51 eV for 10% Fe doping. The
conductivity of NiTiO3 was higher with increasing Fe
doping concentration. This behavior may be due to the
Fe dopant which entered the NiTiO3 lattice and
enhance the conductivity. Generally, in ferroelectric
materials, loss of oxygen often occurred during
sintering at higher temperatures, and vacancies are
easily created from the lattice considered as the mobile
charge carriers. Moreover, the oxygen vacancies can
also increase with increasing of Fe dopant. As doping
concentration increases the probability of oxygen
vacancies can create more, associated with defect
formation. During thermal agitation, the oxygen
vacancies moved in the lattice and oxide ions are
responsible for the electrical conductivity in the
prepared ceramic samples.
because the structure between the two phases was
similar to space group of R-3 and R3c.
It can be seen from P-E loops that the maximum
values of polarization of the Fe doped NiTiO3 samples
were lower than that of the pure NiTiO3 sample at
room temperature. Moreover, the P-E curves of the Fedoped NiTiO3 samples were lossy behavior which
might be attributed to the increase of conductivity with
Fe doping. As the discussion in conductivity, the Fe
dopant resulted in the increase of conductivity of
NiTiO3 sample. Fe dopant can likely act as nonuniform structure which breaks the electric circuit in
the presence of applied electric fields. This result
indicated that the Fe ion substitution for Ni in NiTiO3
crystal degraded the ferroelectric nature of NiTiO3 and
resulted in decreasing in various electrical parameters.
6. Conclusion
The NiTiO3 and Fe-doped NiTiO3 samples were
fabricated using sol-gel method. The substitution Fe3+
ions into Ni2+ ions resulted in decreasing in optical
band gap from 2.23 eV to 1.79 eV. The
antiferroelectric in NiTiO3 materials was obtained.
The Fe doping in NiTiO3 materials induced strong
ferromagnetism at room temperature. The Fe
substitution for Ni in NiTiO3 lattice increased the
electrical conductivity and decreased polarization. Our
work was for further understanding the role of
interaction in A-site in nanocrystal ilmenite structure
for electronic device application.
Table 2. Ferroelectric properties of the NiTiO3
ceramics with the difference in Fe doping
x
Pmax
(µC/cm2)
Pr
(µC/cm2)
Ec
(kV/cm)
0
0.072
0.032
3.31
0.05
0.055
0.031
3.72
0.10
0.042
0.031
4.41
0.10
P (µC.cm-2)
0.05
Acknowledgments
NTO
NTO-5Fe
NTO-10Fe
This research is funded by Vietnam Ministry of
Education and Training (MOET) under Grant
number B2021-BKA-02.
References
0.00
[1]
Lihong Yang, Hongmei Qiu, Liqing Pan, Zhengang
Guo, Mei Xu, Jinhu Yin,Xuedan Zhao, Magnetic
properties of BaTiO3 and BaTi1−xMxO3 (M=Co, Fe)
nanocrystals by hydrothermal method, J. Magn. Magn.
Mater. 350 (2014) 1–5.
/>
[2]
B. Xu, K.B. Yin, J. Lin, Y.D. Xia, X.G. Wan, J. Yin,
X.J. Bai, J. Du, Z.G. Liu, Room-temperature
ferromagnetism and ferroelectricity in Fe-doped
BaTiO3, Phys. Rev. B. 79 (2009) 134109.
/>
[3]
A. Karaphun, S. Hunpratub, E. Swatsitang, Effect of
annealing on magnetic properties of Fe-doped SrTiO3
nanopowders prepared by hydrothermal method,
Microelectron. Eng. 126 (2014) 42–48.
/>
[4]
Y. Lin, Y., Chang, Y., Chen, G., Chang, Y., and
Chang, Y. Lin, Effects of Ag-doped NiTiO3 on
photoreduction of methylene blue under UV and
visible light irradiation, J. Alloy. Compd. J. 479 (2009)
785–790.
/>
-0.05
-0.10
-15
-10
-5
0
5
10
15
-1
E (kV.cm )
Fig. 8. Electric-field-induced-polarization loops of
NiTiO3 ceramics as a function of Fe content measured
at room temperature
The polarization versus electric field (P-E)
curves of Ni1-xFexTiO3 (x = 0, 0.05 and 0.10) at room
temperature were presented in Fig. 8. All synthesized
samples exhibited the typical loops, confirming the
ferroelectric nature of these compounds. The theory
revealed that the ferroelectric properties of NiTiO3
ceramic happened in the R3c crystal. However, the
R3c phase could not be determined from XRD data
57
JST: Engineering and Technology for Sustainable Development
Volume 32, Issue 3, July 2022, 051-058
[5]
S. Yuvaraj, V.D. Nithya, K.S. Fathima, C.
Sanjeeviraja, G.K. Selvan, S. Arumugam, R.K. Selvan,
Investigations on the temperature dependent electrical
and magnetic properties of NiTiO3 by molten salt
synthesis, Mater. Res. Bull. 48 (2013) 1110–1116.
/>
[9]
[6]
Y. Fujioka, J. Frantti, A. Puretzky, G. King, Raman
Study of the structural distortion in the Ni1– xCox TiO3
solid solution, Inorg. Chem. 55 (2016) 9436–9444.
/>
[10] R. Vijayalakshmi, V. Rajendran, Effect of reaction
temperature on size and optical properties of NiTiO3
nanoparticles, E-Journal Chem. 9 (2012) 282–288.
/>
[7]
N. Lenin, A. Karthik, M. Sridharpanday, M. Selvam,
S.R. Srither, S. Arunmetha, P. Paramasivam, V.
Rajendran, et al Lenin, N., Karthik, A., Sridharpanday,
M., Selvam, M., Srither, S. R., Arunmetha, S.,
Electrical and magnetic behavior of iron doped nickel
titanate (Fe3+/NiTiO3) magnetic nanoparticles, J.
Magn. Magn. Mater. 397 (2016) 281–286.
/>
[11] K.P. Lopes, L.S. Cavalcante, A.Z. Sim, J.A. Varela, E.
Longo, E.R. Leite, NiTiO3 powders obtained by
polymeric precursor method: Synthesis and
characterization, J. Alloys Compd. 468 (2009) 327–
332.
/>
[8]
M.A. Ruiz Preciado, A. Kassiba, A. Morales-Acevedo,
M. Makowska-Janusik, Vibrational and electronic
peculiarities of NiTiO3 nanostructures inferred from
first principle calculations, RSC Adv. 5 (2015) 17396–
17404.
/>
[12] P.H.M. de Korte, G. Blasse, Water photoelectrolysis
using nickel titanate and niobate as photoanodes, J.
Solid State Chem. 44 (1982) 150–155.
/>
M.I. Baraton, G. Busca, M.C. Prieto, G. Ricchiardi,
V.S. Escribano, On the Vibrational Spectra and
Structure of FeCrO3 and of the Ilmenite-Type
Compounds CoTiO3 and NiTiO3, J. Solid State Chem.
112 (1994) 9–14.
/>
58