Identifying factors affecting farmers’ adoption of cropping pattern conversion to two rice crops - One cash crop in Vi Tan commune, Hau Giang province
Bạn đang xem bản rút gọn của tài liệu. Xem và tải ngay bản đầy đủ của tài liệu tại đây (168.88 KB, 7 trang )
Vietnam Academy of Agricultural Sciences (VAAS)
Reddy, N. G., 2012. Studies on the inter-relationship
between soil mesofauna and nematodes in organic
farming system. M.Sc. (Agri.) esis, Uni. Agric. Sci.,
Bangalore, p. 158.
Sinha, P. B., Sen, S. S., Zahidi, A. P. and Naqvi,
A. H., 1991. Comparative study on the ecology
of soil mesofauna in a vegetable garden and a
deciduous forest at Ranchi, India. In: Advances in
management and conservation of soil fauna (Eds:
Veeresh, G. K., Rajagopal, D. and Viraktamath, C.
A.) Oxford and IBH publishing Co. Pvt. Ltd., New
Delhi. pp. 419-427.
Vats, L. K. and Narula, A., 1990. Soil Collembola of
forest and crop land. Uttar Pradesh J. Zool., 10 (1):
71-75.
Verhoef, H. and Witteveen, J., 1980. Water balance
in Collembola and its relation to habitat selection,
cuticular water loss and water uptake. J. Insect
Physiol., 26: 201-208.
Date received: 29/9/2018
Date reviewed: 11/10/2018
Reviewer: Assoc. Prof. Dr. Pham Quang Ha
Date approved for publication: 25/10/2018
IDENTIFYING FACTORS AFFECTING FARMERS’ ADOPTION
OF CROPPING PATTERN CONVERSION TO TWO RICE CROPS ONE CASH CROP
IN VI TAN COMMUNE, HAU GIANG PROVINCE
Pham Ngoc Nhan*1, Tran anh Be1,
Le Tran anh Liem1, Pham Kieu Trang2
Abstract
e research which aims at analyzing factors a ecting farmers’ adoption of the 2 rice crops - 1 cash crop pattern
was carried out in Vi Tan commune, Hau Giang province in 2017. In the study, data were collected from interviews
with 120 farming households who converted their cropping pattern into 2 rice crops - 1 cash crop a year. Data were
analyzed by Exploratory Factor Analysis (EFA) to identify factors a ecting the farmers’ acceptance of the composition
a er conversion. Research results showed that farming households who converted their cropping pattern to 2 rice
crops - 1 cash crop can earn higher pro t than households who grow 3 rice crops a year. e most popular cash
crops on rice land are (1) leafy greens, (2) corn, (3) watermelon and honeydew melon, (4) birthwort (for fruits).
Among these crops, growing leafy greens is the most pro table while growing watermelon and honeydew melon is
the costliest. By using EFA with 18 variables devided into 4 groups of factors, the research found out that all factors
have statistical signi cance. In the theory model, among the 4 factors, the factor of Policies from the Government/
Local Authorities and Market price/Consumer have impacts on the level of adoption of farmers to the 2 rice crops
- 1 cash cropping pattern. Between the two, Market price/Customer is the factor which has the most impact on the
farmers’ acceptance of the 2 rice crops - 1 cash cropping pattern (78.0%), followed by the factor of Policies from the
Government and Local Authorities (34.2%).
Keywords: Two rice crops - one cash crop, conversion, farming households, factor analysis
INTRODUCTION
e Mekong Delta stretches in the area of 39,747
square kilometers, accounted for 12.25% area of
Vietnam. According to General Statistic Bureau
(2014) land for agricultural production is 64.2% of
the total areas, land for forestry is 7.5%, land for
housing is 6.4% and land for specializing purposes is
3%. e main crops are rice, fruit plants, sugarcane
and cash crops with crop quality and quantity have
always been improved. Crop composition has also
been changed towards more pro table crops such
as crop rotation among 2 rice crops - 1 cash crop,
1
*
1 rice crop - 2 cash crops, 2 rice crops - 1 shery
instead of rice monoculture. With favourable natural
conditions for agricultural production, the Mekong
Delta has been taking these advantages to further
develop its traditional agticulture. Rice is the main
and the most important crop of Hau Giang province.
However, growing rice in the province still has to face
with di culties caused by both unfavourable natural
conditions and from production methods.
ese
di culties are: up to 38.21% of land is aluminous
soil, land is at higher risk of salt instrustion and
dry season prolongs. Another the di culty is that
Can o University; 2 Global Civic Sharing
Corresponding author: Pham Ngoc Nhan. Email:
68
Journal of Vietnam Agricultural Science and Technology - No.1(3)/2018
production costs (including seeds, costs related to
plowing land, fuel costs, fertilizers) are relatively
high. In addition, the majority of farmers have
been farming based on their longtime experience
without applying new knowledge. As the result, new
technologies on agricultural production are rarely
applied in the area. On the other hand, growing 3 rice
crops a year in a long time has led to soil emaciation,
decreased biodiversity while the ratio pro t/cost of
the cropping pattern is quite low. With the mentioned
situation, it’s a need of crop conversion on rice land
to towards higher pro t for agricultural production
of farmers in the areas. One of the crop compositions
that has shown its e ciency in increasing pro t is the
composition of rotating 2 rice crops and 1 cash crop
a year. e cropping pattern has great advantages
but it also has disadvantages that cause di culties
for farmers in converting their longtime crop
composition. e research analyzes factors a ecting
farmers’ adoption of cropping pattern conversion to
2 rice crops - 1 cash crop was carried out in Vi Tan
commune, Hau Giang province in 2017. Based on
the nding, the research also proposes solutions for
better crop conversion and for higher pro t earned
on the same production land.
OBJECTIVES AND METHODS
Objectives
Approach method used in the research is diagnosis
research via the sociological survey in order to collect
both quantitative and qualitative information with
the participant of farming households. e farming
households parcitipating in the survey were selected
as non-random sampling. Statistics approach was
also used to collect secondary information from the
local areas. Participatory Rural Appraisal (PRA) was
applied via group interviews and (Key Informant Panel
- KIP) in order to evaluate objectively the outcome of
conversion of cropping pattern on rice land.
Methods
Data collection methods
e research was carried out in Vi Tan commune,
Vi
anh town, Hau Giang province as in the
community there are a number of households who
have converted their cropping pattern, mainly to
2 rice crops - 1 cash crop. Sample size is 120. is
means there are 120 farming households who
converted their crop composition joined the research
by answering survey form. Also, another 60 farming
households who still grow 3 rice crops a year were
surveyed. en the research will compare the costs
and pro ts of the two groups of farming households.
e scale used in this research was built based on
the SERVPERE scale by Parasuman (1985) in order
to measure the di erent levels of acceptance of
farmers to the composition of 2 rice crops and 1 cash
crop. In the research two scales are used: the multidimensional scale with 4 factors and 18 variables and
acceptance scale with 3 variables.
Data analysis methods
In the study, Exploratory Factor Analysis method
(EFA) was used to measure the level of acceptance of
households of the new crop composition on rice land
a er conversion as well as to identify factors a ecting
the acceptance. e analysis process has three steps:
(1) Step 1: Scale reliability test; (2) Step 2: Exploratory
Factor Analysis (EFA); (3) Step 3: Observation
variables and factors test.
In the survey questionnaire, scale of adoption has 3
categories, scale of impacted factors has 18 categories,
and were both evaluated by LiKert scale from 1 to 5.
According to Trong H. and Ngoc C. N. M (2005), the
number of observation must be at least 4 or 5 times
more than the number of variables in factor analysis.
Scale of training quality has 21 categories and was
used in factor analysis therefore the minimum
sample size is 105. en in reality sample size of 120
is quali ed.
Time and place of the study
e research was carried out from May 2017 to March
2018 at Vi Tan commune, Vi anh Town, Hau Giang
province.
RESULTS AND DISCUSSION
Current situation of cropping pattern conversion
on rice land
e size of land used for growing 2 rice crops - 1 cash
crop and 3 rice crops
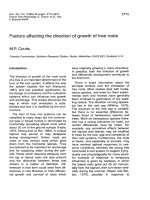
According to survey of 120 farming households in
the research areas, the average land used to grow 3
crops of rice a year in each household is 1.29 hectare
(accounted for 78.2% of the household’s total land)
while only 0.36 hectare of land used to grow 2 rice
crops - 1 cash crop a year (21.8%). Numbers show
that size of land used to grow the rotation between
rice and cash crop is smaller than that used to grow
3 crops of rice a year. en it is a fact that farming
households only converted their crop composition to
2 rice crops and 1 cash crop on a small area of land.
69
Vietnam Academy of Agricultural Sciences (VAAS)
According to T - test in table 1, production costs of
both compositions have no signi cance but pro ts
earned by the two compositions have signi cance
with 0.049 < α = 0.05.
Table 1. Costs and pro ts analysis
of the two compositions of 2 rice crops 1 cash crop and 3 rice crops
Unit: million VND/hectare/year
cash crop
Figure 1. e share of rice land-use for growing
2 rice crops - 1 cash crop and 3 rice crops
of farming households in Vi Tan commune
(Source: Surveys on 120 farming households in research
areas, 2017).
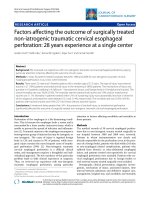
Cash crop on rice land
According to results of survey with farming
households in the research areas, the main nonrice plants are: leafy greens, di erent types of
melon (watermelon and honeydew melon), corn
and birthwort for fruits. Among these plants, corn
is the most popular one then melon, leafy greens
and birthwort for fruits. ese cash crops are o en
cultivated in Spring-Summer season as during this
time of the year irrigation water is more suitable for
the production. In general, these crops production
requires less time and labour as well as experience or
techniques. ese are the reason why these crops are
most planted by local farming households.
Index
Total
cost
Total
pro t
Cropping pattern
2 rice crops - 1
cash crop
3 rice crops
2 rice crops - 1
cash crop
3 rice crops
Economic bene ts of the 2 rice crops - 1 cash crop
composition
Economic comparision between two compositions of
2 rice crops - 1 cash crop and 3 rice crops a year
According to table 1, the costs of growing 2 rice crops
- 1 cash crop a year (67.5 million VND/hectare/year)
are higher than that of growing 3 rice crops a year
(51.2 million VND/hectare/year). However, pro ts
earned from growing 2 rice crops - 1 cash crop a year
is also higher than that of growing 3 rice crops a year.
70
67.5
51.2
63.3
27.4
F
Sig.
0.162
0.688
3.993
0.049
(Source: Surveys on 120 farming households in research
areas, 2017).
Pro ts from growing cash crops on rice land
As mentioned above, among the four types of cash
crops grown on rice land, group 1 of leafy greens and
group 3 of honeydew melon and watermelon are the
most popular. e other two groups are corn and
birthwort for fruits such as gourd, calabash, loofah
and bitter gourd.
Table 2. Average production costs
and pro ts of the cash crops
Unit: Million VND/ha/crop
Cash crops
Figure 2. Types of cash crops grown
on rice land in Vi Tan commune
(Source: Surveys on 120 farming households in research
areas, 2017)
Mean
(1) Lea greens
(2) Corn
(3) Honeydew melon
& watermelon
(4) Birthwort for
fruits
e average
production cost
29.6
27.2
e average
pro t
44.0
19.0
42.1
34.2
34.0
36.5
(Source: Surveys on 120 farming households in research
areas, 2017).
As shown in table 2, growing honeydew melon and
watermelon costs the highest (42.1 million VND per
hectare), then birthwort for fruits (34.0 million VND
per hectare), followed by leafy greens (29.6 million
VND per hectare) and the lowest is corn (27.2 million
VND per hectare). About pro ts, growing leafy green
can earn the biggest pro ts (44.0 million VND per
hectare), then birthwort for fruits (36.5 million VND
per hectare), melon and watermelon (34.2 million
VND per hectare) and corn can produce the lowest
pro ts (19.0 million VND per hectare).
Journal of Vietnam Agricultural Science and Technology - No.1(3)/2018
Factors impact crop conversion of farming
households.
Variable description
According to Frank Ellis (1995), there are 8 types
of policy that have direct impacts on agriculture
production of developing countries. In the book,
Frank Ellis analyzed indepth about the 8 types of
policy and pointed out their impacts on agriculture
production of developing countries. Besides, all of
examples cited in the book were all based on the
impacts of these policies to the development of the
agriculture production system, including: pricing
policy, marketing, equipment and tools, creadits,
mechanization, land, research and irrigation. In
this research, factors that are analyzed include the
manufacturer’s capacity, Government and local’s
policies, market price and consumers, climate
changes/land/irrigation water.
Table 3. Variable description of factors
Factors
Scale symbols
N1
Levels of adoption
N2
N3
N4
Households’ capability
N5
N6
N7
Policies from the
Government local
authorities
N8
N9
N10
N11
N12
Market price and
consumers
Climate change/Land/
Water resources
N13
N14
N15
N16
N17
N18
N19
N20
N21
Scale description
Farmers can see good impacts a er converting their cropping
pattern
Farmers are more active during production of the new
composition
Farmers introduce the new crop composition to others farmers
e farmers who converted their crop composition have enough
knowledge related to the new crop composition
e households have su cient nancial resource to apply the
converted composition
e households have labor to apply the converted composition
Farmers know new crop composition was eligible for nancial
support
Farmers know the new crop composition was eligible for
technical support
Farming households agree to convert their crop composition
according to the local authorities’ planning
Local authorities have policies to promote the products’ sale
Local authorities invest in suitable irrigation system for new crop
composition
e new crop composition can bring about higher econimic
outcome
Products have higher selling price
Products are more easily accepted by processing companies
Products are more accepted by markets
Lower investment required
Climate is suitable for the new crop composition
Water supply in the areas is suitable for the crop composition
Water sources are infected by salinization
Climate changes cause bad impact on rice monoculture
Land is no longer suitable for rice monoculture
In this research, two scales are used: the multidimensional scale with 4 factors and 18 variables and
acceptance scale with 3 variables.
e scale reliability is measured by Cronbach Alpha
analysis of factors:
Factors a ecting farmers’ acceptance to the cropping
pattern of 2 rice crops - 1 cash crop are devided into 4:
(i) Households’ capability measured by 3 observation
variables which are named N4 through N6;
(ii) Policies of the Government and Local authorities
71
Vietnam Academy of Agricultural Sciences (VAAS)
measured by 5 observation variables which are
N7 through N11; (iii) Market price/ Consumers
measured by 5 observation variables which are N12
through N16 and (iv) Climate changes/Land/Water
resources measured by 5 observation variables which
are N17 through N21.
Scales’s reliability is measured by Cronbach Alpha.
Cronbach Alpha will help identify and eliminate
meaningless variables and variables that have internal
consistency smaller than 0.3. According to Nunnally
and Brunstein (1991), in case of new type of scale or
the scale itself is new to surveyed people, the Cronbach
Alpha which is higher than 0.6 are acceptable. In the
research, surveyed people are farmers who join in the
rice and cash crop production and this is the rst time
they answer a survey form including Likert scale with
5 di erent levels of assessment.
e Cronbach Alpha reliability of the scales
- Farmers’ general acceptance scale
By using SPSS 20.0 to analyze Cronbach Alpha of
farmers’ acceptance, the reliability index is 0.757.
e coe cient of correlation of all variables is bigger
than 0.3. Minimum value is 0.520 (N3 variable) and
maximum value is 0.745 (N2 variable).
- Household’s capability scale
e Cronbach Alpha is 0.695. All variables’ values
are higher than 0.3. Minimum value is 0.474 (N5
variable) and maximum value is 0.543 (N6 variable).
- Policies from the Government/Local authorities scale
e Cronbach Alpha is 0.819. All variables’ values
are higher than 0.3. Minimum value is 0.513 (N11
variable) and maximum value is 0.755 (N10 variable).
- Market price/Consumers scale
All variables’ values in the Market price/Consumers
scale are higher than 0.3. N14 has minimum value
which is 0.399 and N15 has maximum value which is
0.620. e Cronbach Alpha is 0.731.
- Climate change/Land/Water source scale
e Cronbach Alpha is 0.746. All variables’ values
climate changes/land/water source) are higher than
0.3. Minimum value is 0.381 (N17 variable) and
maximum value is 0.607 (N18 variable).
According to Cronbach Alpha index of the 4 factors
to measures the impacts to farmers’ adoption of
cropping pattern conversion to 2 rice crops - 1 cash
crop, reliability value is higher than 0.6. e result
means that the scales used in the research have
statistical meaing and reach required reliability.
erefore, 4 factors of scales can be used in the
research for the EFA.
72
KMO index analysis results
EFA was used to test scales in the research. In the
total of 18 variables of 4 factors, a er being tested
by Cronbach Alpha, there is no invalid variable.
EFA was also used to rea rm the scales’ suitability
with 18 variables. KMO index (Kaiser-Meyer - Olkin
Measure of Simping Adequacy) was used to analyzed
the appropriateness of factors, the factor can also be
accountable when KMO is bigger than 0.5. According
to Hair et al. (1998), factor loading (numbers in
Rotated Component Matrix) has to be bigger than 0.3
and 0.3 is the minimum, 0.4 is important and 0.5 is
meaningful. Factor loading has to be bigger than 0.3
with sample size of 350, with sample size of 100, factor
loading has to be bigger than 0.5 while with sample
size of 50, factor leading has to be bigger than 0.75.
e research is of rather new eld and with sample
size of 120 therefore factor loading in the Rotated
Component Matrix is 0.5 for variable. According
to KMO index shown in table 4, 4 independant
components and 1 scale component all have KMO
more than 0.5.
erefore, scale components are
reliable and can be used in regression models.
Table 4. KMO test results
Scale components
KMO index
Household’ capacibility (X1)
0.665
Policies from the Government
0.721
and Local authorities (X2)
Market price and consumers
0.649
(X3)
Climate change/Land/Water
0.666
resources (X4)
Level of acceptance (Y)
0.589
Sig.
0.000
0.000
0.000
0.000
0.000
(Source: Surveys on 120 farming households in research
areas, 2017).
Regression model analysis
According to the regression model, both X2, X3 are
smaller than 0.05 while X1, X4 are bigger than 0.05.
And it means that the two independant variables of
Policies from the Government and Local authorities
(X2) and Market price/Consumer (X3) have impacts
on the adoption of farmers about the cropping pattern
conversion to 2 rice crops - 1 cash crop in Vi Tan
commune, Vi anh town, Hau Giang province. Both
X2 and X3 have meaning in the model and impacts on
the adoption of farmers as the coe cient of regression
is positive. B value: of independant variables in the
model are Household’ capacibility (X1): 0.109; Policies
from the Government and Local authorities (X2):
0.325; Market price/Consumers (X3): 0.926; Climate
change/Land/Water resources (X4): 0.162.
Journal of Vietnam Agricultural Science and Technology - No.1(3)/2018
Table 5. Coe cient of regression in the regression model
Model
1 (Constant)
X1
X2
X3
X4
Coe cient of regression
B
Error
1.491
0.322
0.109
0.159
0.325
0.129
0.926
0.135
0.162
0.174
Standardized regression coe cient
Beta Standardized
t
4.626
0.131
0.685
0.342
2.531
0.780
6.843
0.158
0.936
Sig.
0.000
0.495
0.014
0.000
0.352
(Source: Surveys on 120 farming households in research areas, 2017)
From regression analysis, there can be a model as
following:
Y = 1.491 + 0.325X2 + 0.926X3
According to the model above, it can be explained
that 47.2% of change of variable Y is caused by
independant variables while the rest 52.8% of change
can be explained by factors outside the model which is
beyond the scope of the research. Also, in the model,
X2 and X3 have impacts on the acceptance of farmers
of the crop composition conversion to 2 rice crops - 1
cash crop with the reliability of 95%.
It also shows that the importance of X2 and X3 to
dependant variable Y. e value Beta in table 5 shows
that the Policies from the Government and Local
authorities value a ects 34.2% of the acceptance, the
Market price/Consumers value a ects 78.0% of the
adoption of farmers about cropping pattern conversion
to 2 rice crops - 1 cash crop in Vi Tan commune, Vi
anh town, Hau Giang province in 2017.
e equation is explained as following:
e X2 variable (Policies of the Government/Local
authorities) has B = 0.325 and with Sig = 0.014. is
means the variable a ects the farmers’ acceptance
(alpha = 5%) and in the context other factors
remain unchanged, the variable of Policies of the
Government/ Local authorities increases 1 point, the
acceptance will increase 0.325 point. According to
households, they decided to convert their cropping
pattern into 2 rice crops - 1 cash crop and accept the
outcome of the composition even a er conversion as
they themselves can see the bene ts of crop rotation.
Besides, Policies from the Government and Local
Authorities also have impacts on the decision with
activities such as organizing training courses on
growing cash crops, help establish collective farms
so that farmers can collaborate to nd markets for
their products.
e X3 variable (Market price/Consumers) has
B = 0.926 and with Sig = 0.000.
is means the
variable a ects the farmers’ acceptance (alpha = 5%
when other factors remain unchanged). When the
acceptance of the market and consumers increase
by 1 point the acceptance to crop composition
conversion of farmers will increase 0.926 point. In
the research areas, markets for cash crop products
such as vegetables and fruits are huge and through
various channels such as traders, enterprises or
through collective farms. As the result the bigger the
market is with more customers the higher farmers’
acceptance is.
According to table 6, R = 0.687 shows that variables
in the model have close relation. Regression model
report shows that R2 (R Square) is 0.472. is means
the model is 47.2% appropiate or in other word
47.2% of change can be explained by 4 factors in the
model. Adjusted R Square re ects more correctly
the suitability of the model in general. In this model,
Adjusted R Square is 0.447 (or 44.7%) and this means
there is a linear regression model between the levels
of acceptance and the 4 factors which impact the
acceptance of farmers to the crop compositon of 2
rice crops - 1 cash crop.
Table 6. Result of regression analysis of the 4 factors to
measures the impacts to farmers’ adoption of cropping
pattern conversion to 2 rice crops - 1 cash crop
Model
R
R Square
1
0.687a
0.472
Adjusted R
Square
0.447
Std.D
0.73
(Source: Surveys on 120 farming households in research
areas, 2017).
CONCLUSIONS
According to research results, the cropping pattern of
2 rice crops - 1 cash crop can produce more pro ts
than the crop composition of 3 rice crops a year. By
using T-Test, it is clear that the di erence in pro ts
has statistical meaning with α = 5%. In the research
areas, there are four main groups of cash crops grown
73
Vietnam Academy of Agricultural Sciences (VAAS)
on rice land including (1) leafy greens, (2) corn,
(3) melon and watermelon, (4) birthwort for fruits.
Among these four groups of crops, growing leafy
greens can earn the most pro t while growing melon
and watermelon costs the highest. By using EFA with
18 variables devided into 4 categories, research found
out that all factors have statistical signi cance. Among
the 4 categories, two of them, which are Policies of the
Government and Local Authorities and Market price/
Consumers have impacts on the farming households’
adoption the 2 rice crops - 1 cash crop composition.
Between the two categories, Market price/Consumers
has the biggest impact on the acceptance of farmers
with the new composition with 78.0% followed by
the category of Policies from the Government and
Local authorities with 34.2%. Model analysis results
show that, the theorical model is suitable to factors
and theories proposed in the model have realistic
meaning to policy makers in the areas (policies
realted to cropping pattern conversion). Based on
these ndings, solutions were proposed in order to
enhance the outcome of the 2 rice crops - 1 cash crop
composition as well as to encourage sustainable crop
rotation on rice land. Sustainable crop rotation means
higher pro ts for farmers. e solutions are opening
up & nding out new markets for farmers’ products
and organizing capacity building courses for farmers.
For farmers, they are suggested to join these training
courses and to collaborate with others for better
outcome of the cropping pattern.
REFERENCES
Trong, H., Ngoc, C.N.M., 2005. SPSS Data analyzing Part 2. Hong Duc Publishing House. Ho Chi Minh
City. 179 pages.
Ellis, F., 1995. Farming household economy and
Agriculture Development. Agriculture Publishing
House. Ho Chi Minh City.
General Statistics Bureau, 2014. Annual Abstracts of
Statistics in 2013. Statistics publishing house. Hanoi,
745 pages.
Parasuman, Valarie A. Zeithaml & Leonard L. Berry,
1985. A Conceptual Model of Service Quality and
Its Implications for Future Research. Journal of
Marketing, Vol. 49 (Fall 1985), 41-50.
Nunnally, J. and Brunstein, 1991. Psycometric eory.
New York, McGrow Hill.
Hair J. r, J. F., Anderson, R. E, Tatham, R. L, Black, W. C.,
1998. Multivariate Data Analysic with Readings.
Macmillan Publishing Company.
Date received: 21/8/2018
Date reviewed: 11/10/2018
Reviewer: Dr. Dao e Anh
Date approved for publication: 25/10/2018
DEVELOPMENT OF NEW RICE VARIETY DTM126
FOR ACID SULFATE SOIL AREA OF THE MEKONG DELTA
Nguyen Viet Cuong*1, Tran i Hong am1,
Hoang Van Bang1, Le i Kim Loan1, Ly i u Hong1
Abstract
Acid sulfate soil and seasonal ooding are the major issues to rice production in the Mekong Delta of Vietnam,
especially the Plain of Reeds (Dong ap Muoi area). erefore, the development of new rice varieties adapted to
these a ected areas has been the focus of rice breeders in the region. DTM126 is a new rice variety developed by
the Dong ap Muoi Agricultural Research Center for the above objective. e DTM126 variety came out from
a cross between two varieties DS2001 and MTL250, using the pedigree breeding method and it went through a
series of yield testing trials in 6 cropping seasons from 2013 to 2015. e analyzed data revealed that this variety
outperformed existing varieties in the area as well as its parents with the following major features: short duration
(86-95 days), tolerant to acid sulfate soil, good agronomic characteristics, high yield (up to 9 tons/ha), moderate
amylose content (19-21%), and good grain quality for export. It is only slightly infected by brown planthoppers and
blast disease. DTM126 was o cially approved as a national rice variety for the Southern provinces of the Mekong
Delta by the Decision No. 639/QD-BNN-TT, dated on 23 February 2018. is variety is suitable for triple rice
cropping areas, acid sulfate soil and it is recommended to replace old varieties.
Keywords: DTM 126, Dong ap Muoi region, acid sulfate soil, trial production
1
*
Agricultural Research and Development Center for Plain of Reeds
Corresponding author: Nguyen Viet Cuong. Email:
74