Agriculture led economic growth: The case of Pakistan
Bạn đang xem bản rút gọn của tài liệu. Xem và tải ngay bản đầy đủ của tài liệu tại đây (197.6 KB, 7 trang )
VAAS - YAAS Cooperation on Cross border Economics study
AGRICULTURE LED ECONOMIC GROWTH: THE CASE OF PAKISTAN
Muhammad Ishaq1 and Muhammad Azam Niazi 2,*
Abstract
e study attempts to test agriculture led growth theory for Pakistan. Time series data have been used for the period
1980 to 2017. e data series are tested for stationarity and found to be stationary at the rst di erence (I (1)).
As the data contained a mix of I (0) and I (1) variables the ARDL Bounds testing approach is used. e Bounds
Testing approach con rms a long run relationship. Error Correction Model is used to obtain coe cients of both
short and log run. Analysis of the model shows that except for Terms of Trade all the variables are highly signi cant
with expected signs. e main variable of interest i.e, Agriculture has a signi cantly positive e ect on GDP. A 10%
increase in agricultural GDP results in 2.8% increase in the national GDP (real terms). Similarly, 10% increase in
the Gross Capital formation results in 5% increase in the GDP. Population has a negative sign for the coe cient. e
results show that the agricultural led growth hypothesis carried weight and agricultural value added has the potential
to help the national economy. erefore, Pakistan needs to go for more value added and more e cient agriculture to
have a better impact on economic growth of the country in the years to come.
INTRODUCTION
e role of agriculture in economic growth of
developing countries has been debated since long
with basis of many resting on qualitative analysis,
although many studies show a positive relationship
still many don’t support the thesis. Pakistan being
an agricultural country for most of its history and
has been known to be riding on the shoulders of
the agriculture sector.
e agriculture sector has
been dominated by the crops sector through most
of the course of history only to be overtaken by the
livestock sector in the year 2014 (GoP, 2004). e
crop sector was in turn dominated by only four crops
viz. cotton, wheat, rice and sugarcane. Wheat was the
food security crop while the other three contributed
as the cash crops with cotton and rice leading the
exports list. For a country where agriculture has
been contributing over one fourth to the GDP, the
decision of allocation of resources is too important
to the ignored.
It has been opined that increasing agricultural
exports is likely to increase incomes and add to
foreign exchange earnings (Johnston and Mellor,
1961b). Others found that for developing countries
like Pakistan agricultural exports have positive but
insigni cant association with the GDP growth,
owing perhaps to the export of primary and raw
commodities that nd it di cult to compete in the
international markets (Mahmood and Munir, 2017).
Results of most earlier studies have been doubted
based on the reason that these which did not take into
account the time series properties like unit roots in
the data which could lead to spurious results (Tsakok
and Gardner, 2007). Some studies attempted to the
study the phenomenon using bivariate analysis using
the Granger causality (Ti n and Irz, 2006) which is
considered to be too simple to capture the real life
relationships as Titus, 2015 called it misspeci cation.
With limited resources it is valuable to have an
idea of how to allocate resources among di erent
sectors. e belief of Agriculture as the driving force
behind developing economies needs to be tested
quantitatively.
is study aims to quantify the impact of agricultural
growth on the overall economy of Pakistan. Time
series analysis techniques are suitable to achieve such
objectives. Time series has seen a lot of development
during the recent decades.
e development of
concepts like that of stationarity and the tests to
check it have cast doubts over the reliability of
results reported by earlier studies. One of the recent
techniques in vogue today is the Autoregressive
Distributed Lag (ARDL) that has an edge over the
previous approaches. is approach is better suited
when the data is small, and the variables have di erent
orders of integration.
is study is divided into distinct sections.
e
following section focuses on the review of literature,
followed by the section on methodology where the
model is described while the results are discussed in
section three. Section four nally concludes the study
with suggestions for future research.
Director Agricultural Marketing and Trade, Social Sciences Division, Pakistan Agricultural Research Council,
Islamabad, Pakistan. E-mail:
2
Director Agricultural Economics, Social Sciences Division, Pakistan Agricultural Research Council, Islamabad,
Pakistan. E-mail:
*
Corresponding author: Muhammad Azam Niazi. E-mail:
1
29
Vietnam Academy of Agricultural Sciences (VAAS)
To present response to the question of “does
agriculture a ect the economic growth?” is being
under review among development economists. Many
of the development economists including (Lewis,
1954; Fei and Ranis, 1961; Johnston and Mellor,
1961a; Jorgenson, 1961; Schultz, 1964) pioneered
to investigate the issue. However, their work was
mainly qualitative, focusing mainly on the possible
impact of connections between agricultural and
industrial sectors. A er a pause in research on this
issue, in the near past the issue has attracted the
attention of development economists and among
many (Echevarria, 1997; Humphries and Knowles,
1998; Gemmell et al., 2000; Kogel and Prskawetz,
2001; Gollin et al., 2002; Awokuse, 2005; Gardner,
2005; Olsson and Hibbs, 2005; Ti n and Irz, 2006;
Awokuse, 2007; Awokuse and Xie, 2015; Kang, 2015;
Gemmell et al., 2016; Keho, 2017) have worked to
explore the issue.
e empirical investigations have shown a mix
evidence for agriculture-led growth (ALG)
proposition. Some of the economists (Johnston and
Mellor, 1961a; Gemmell et al., 2000; Gollin et al.,
2002; irtle et al., 2003; Awokuse, 2005; Gardner,
2005; Awokuse, 2007; Awokuse and Xie, 2015) have
proved and supported the ALG and others (Lewis,
1954; Fei and Ranis, 1961; Jorgenson, 1961) strongly
disagree with its proponent.
According to Johnston and Mellor (1961a), Gemmell
et al. (2000), Gollin et al., (2002),
irtle et al.
(2003), Awokuse (2005), Gardner (2005), Awokuse
(2007), Awokuse and Xie (2015), development of
agricultural sector is a prerequisite for industrial
and economic growth. e advocates of ALG argue
that the agricultural sector could be a stimulus
for national income as it directly and indirectly
a ects rural income and provides raw materials for
industrialization ( irtle et al., 2003). According to
Bhagwati and Srinivasan (1975), industrialization
in developing economies without investment and
development in agricultural sector showed dismal
economic growth.
Journal of Vietnam Agricultural Science and Technology - No.1(4)/2019
Recent study by Kang (2015) has shown that in
major rice producing economies, rice exports are
imperative for fuelling economic growth. In the same
lines, studies by irtle et al. (2003), Awokuse (2005),
Ti n and Irz (2006), Awokuse (2007), Awokuse and
Xie (2015) suggested that development of agriculture
might be instrumental for economic growth, with
varying e ects across di erent economies. Analyses
for some economies back the hypothesis of ALG
while for some others the analyses suggest that
vibrant aggregate economy is a precondition for
agricultural growth.
OBJECTS AND METHODS
Objects
is study aims to nd the association between
economic growth and agriculture, gross capital
formation, population and terms of trade. Data on
real GDP (current U.S. dollar), real agricultural value
added1# (current U.S. dollar), population (in number
head counts and includes residents regardless of
legal status or citizenship), real imports and exports
of goods and services (current U.S. dollar), and
real gross capital formation 2# (current U.S. dollar)
are extracted from the World Bank Development
Indicators data set3#.
Net GDP is obtained by subtracting real agricultural
value added from real GDP. As terms of trade (ToT)
is the ratio of exports and imports, therefore, ToT is
obtained by dividing real exports over real imports.
All the data are converted into million and then into
logarithmic form by taking natural logs of all the
desired variables. Time series data are used for the
period 1980 to 2017.
Methodology
As mentioned earlier several development economists
have studied the association between agriculture and
economic growth. Studies conducted in past except
few have used the ordinary least squares (OLS)
techniques and/with simple correlation coe cient
1#
Agriculture corresponds to International Standard Industrial Classi cation (ISIC) divisions 1-5 and includes forestry,
hunting, and shing, as well as cultivation of crops and livestock production. Value added is the net output of a sector
a er adding up all outputs and subtracting intermediate inputs.
2#
Gross capital formation (formerly gross domestic investment) consists of outlays on additions to the xed assets of the
economy plus net changes in the level of inventories. Fixed assets include land improvements (fences, ditches, drains,
and so on); plant, machinery, and equipment purchases; and the construction of roads, railways, and the like, including
schools, o ces, hospitals, private residential dwellings, and commercial and industrial buildings. Inventories are stocks
of goods held by rms to meet temporary or unexpected uctuations in production or sales, and “work in progress.”
According to the 1993 SNA, net acquisitions of valuables are also considered capital formation.
3#
accessed on April 09, 2019.
30
VAAS - YAAS Cooperation on Cross border Economics study
tests that may have misspeci cation problems
(Tsakok and Gardner, 2007). According to Tsakok
and Gardner (2007), correlations might be spurious as
the earlier studies did not take care for cointegration
and unit roots properties of the time series data.
In addition, some of the studies show correlation
between agriculture and GDP growth but fail to
explain the direction of causality and this issue could
be best investigated through time series framework.
In this connection, Ti n and Irz (2006) estimated
the bivariate Granger causality tests. ough, their
study was improvement on previous studies, but
they failed to check the impact of other determinants
(trade, capital and labor) of economic growth which
may lead to misspeci cation problems (e.g., omitted
variables), and spurious correlation (Awokuse and
Xie, 2015).
Model
In the light of the above discussion, this study follows
the model developed and estimated by Awokuse
and Xie (2015) to analyse the association between
agriculture and economic growth of Pakistan.
According to Awokuse and Xie (2015) their model
is an extension of the neoclassical growth model.
e neoclassical growth model considers agriculture
as a major player to growth as it a ects total factor
productivity.
To get empirical results the following model is
estimated using autoregressive distributed lag
(ARDL) approach to meet the objective to investigate
both the short- and long-run relationships between
agriculture and economic growth.
Assuming Cobb-Douglas Production function:
GDPt = Ct Ht (1)
Where: GDPt is per capita GDP of Pakistan, Ct is the
gross capital formation, and Ht represents the HicksNeutral productivity term.
Hwa (1988) incorporated agriculture to the growth
equation. Awokuse and Xie (2015) estimated the
growth equation by incorporating exports and terms of
trade as Hwa (1988) and Wunder (2003) termed both
the exports and terms of trade explaining economic
growth of a country (Awokuse and Xie, 2015). As ToT
is a ratio of exports and imports, therefore exports is
excluded from the nal equation and population as
included as one of the determinants a ecting overall
economic growth of a country. erefore, the HicksNeutral productivity term , which is considered as a
residual term in production function, is assumed to
be a function of agriculture , population , and terms
of trade , to curtail the residual term.
Ht = f(Agr t, Pop t, ToTt) = Agrt Popt ToTt + εt (2)
Where: εt is the error term that captures other missing
variables that may a ect growth.
Substituting equation (2) in equation (1) gives the
following model:
GDPt = Agrt Popt ToTt + εt (3)
Equation (3) is converted into the following linear
form by taking natural logs:
lnGDPt = αlnCt + βlnAgrt + γlnPopt + δlnToTt + εt (4)
e Augmented Dickey and Fuller (ADF) and PhillipPerron tests are used to test for cointegration in time
series data.
Time and place of the study
is study aims to analyze agriculture led economic
growth theory for Pakistan. In this regard, to estimate
the model mentioned at equation 4 and meet the
objectives of the study, time series data are extracted
on the required variables for the period 1980 to 2017.
RESULTS AND DISCUSSION
e nal model is based on the Net GDP (Net of
Agriculture) and four independent variables viz.
Agricultural Value Added (lnAgri), Gross Capital
Formation (lnC), Population (lnPop) and the Terms
of Trade (ln ToT), all in real terms and in natural log
form making it easier to interpret the elasticities.
e data series are tested for stationarity using Phillips
Perron and Augmented Dickey Fuller tests. Although
ARDL Bounds Testing approach accommodates a
mix of both I (0) and I (1) variables it does not allow
for any variable that is I (2). Except for the population
that is found to be stationary all the other variables
are found to be I (1) i.e these become stationary at
the rst di erence. As none of the variables is I (2)
the Bounds Testing approach is used comfortably.
Results of the PP and ADF are given in Table 1 and 2
respectively.
As the data contained a mix of I (0) and I (1) variables
the ARDL Bounds testing approach is used. Using
the Bounds Testing approach a long run relationship
is con rmed with a reasonably high F-value (28.9)
that surpassed the upper bound (7.09) for the small
sample (40) limits (Table 3). Narayan tables (Narayan,
2005) are used as the sample is small and the (Pesaran,
1999) tables caters for much larger samples over one
thousand.
31
Vietnam Academy of Agricultural Sciences (VAAS)
Journal of Vietnam Agricultural Science and Technology - No.1(4)/2019
Table 1. Tests for stationarity
Phillips-Perron Test
At Level
With Constant
With Constant
& Trend
lnGDP
lnAgr
lnC
lnPop
lnToT
t-Statistic
0.6270
0.5330
0.0439
-9.7078
-1.6485
Prob.
0.9886
0.9857
0.9567
0.0000
0.4484
Ns
Ns
ns
***
ns
t-Statistic
-1.6080
-1.6047
-2.0842
-4.5180
-1.3076
Prob.
0.7705
0.7718
0.5373
0.0048
0.8704
ns
ns
ns
***
ns
d (lnGDP)
d (lnAgr)
d (lnC)
d (lnToT)
t-Statistic
-5.8458
-5.8189
-5.5656
-5.8193
Prob.
0.0000
0.0000
0.0000
0.0000
***
***
***
***
t-Statistic
-6.0761
-6.1580
-5.5744
-6.1033
Prob.
0.0001
0.0001
0.0003
0.0001
***
***
***
***
At First Di erence
With Constant
With Constant
& Trend
Augmented Dickey Fuller test
At Level
With Constant
With Constant
& Trend
lnGDP
lnAgr
lnC
lnPop
lnToT
t-Statistic
0.5598
0.5429
0.0439
-1.8703
-1.6065
Prob.
0.9866
0.9860
0.9567
0.3416
0.4693
ns
ns
ns
ns
ns
t-Statistic
-1.6080
-1.5714
-1.9583
-4.2676
-1.2955
Prob.
0.7705
0.7851
0.6041
0.0110
0.8735
ns
ns
ns
**
ns
d (lnGDP)
d (lnAgr)
d (lnC)
d (lnToT)
t-Statistic
-5.8458
-5.8188
-5.5656
-5.8191
Prob.
0.0000
0.0000
0.0000
0.0000
***
***
***
***
t-Statistic
-6.0358
-6.0765
-5.5744
-6.0267
Prob.
0.0001
0.0001
0.0003
0.0001
***
***
***
***
At First Di erence
With Constant
With Constant
& Trend
Notes: a: (*) Signi cant at the 10%; (**) Signi cant at the 5%; (***) Signi cant at the 1% and (ns) Not Signi cant;
b: Lag Length based on SIC; c: Probability based on MacKinnon (1996) one-sided p-values.
32
VAAS - YAAS Cooperation on Cross border Economics study
Table 2. ARDL Bounds Test for the model (3, 0, 0, 0, 0)
Test Statistic
Value
K
F-statistic
28.917
4
Critical Value Bounds (Narayan)
Signi cance
I (0) Bound
I (1) Bound
10 per cent
3.374
4.512
5 per cent
4.036
5.304
1 percent
5.604
7.172
e model developed for this study is tested for a longrun relationship using Bounds testing approach which
clearly shows the existence of a long run relationship
(Table 2). An Error Correction Model is estimated
and coe cients of both short an log run are obtained.
e long and short-run coe cients are given in
table 3 and 4, respectively. Except for Terms of Trade
all the variables are found to be highly signi cant and
have expected signs. e main variable of interest
i.e Agriculture is found to be highly signi cant
at the 1% level and has a positive e ect on GDP. A
10% increase in agricultural GDP results in 2.8%
increase in the national GDP (real terms). Similarly,
10% increase in the Gross Capital formation results
in 5% increase in the GDP.
e Terms of Trade
is found to be non-signi cant even at 10% level.
Population is found to be signi cant at 5% level of
signi cance and has a negative sign for the coe cient.
Table 3. Long-run Coe cients ARDL model (3, 0, 0, 0, 0)
Variable
Coe cient Std. Error
lnAgr
0.282
0.076
lnC
0.500
0.085
lnPop
-1.308
0.552
lnToT
0.061
0.054
C
9.233
2.565
Trend
0.053
0.014
Source: Authors’ calculations.
Prob.
0.001
0.000
0.026
0.263
0.001
0.001
Table 4. Short–run Coe cients
for ARDL model (3,0,0,0,0)
Variable
Coe cient
d (lnGDP(-1))
0.052
d (lnGDP(-2))
-0.059
d (lnAgri)
0.293
d (lnC)
0.519
d (lnPop)
-1.357
d (lnToT)
0.064
d (Trend)
0.053
CointEq (-1)
-1.000
Source: Authors’ calculations.
t-Statistic
0.518
-0.601
3.057
7.672
-2.460
1.186
3.744
-9.134
An Error Correction Model is formed to workout the
speed of adjustment. e speed of adjustment re ects
the time that is expected to be required to bring the
system back to equilibrium form any disturbance. e
smaller the coe cient the longer will it take to adjust.
e speed of adjustment is found to be very high with
100 % of the correction taking place in the rst period.
Agriculture contributes around 19% to the national
GDP of Pakistan and even the agriculture sector
contributed to a great extent in the exports of Pakistan.
e services sector is to a large extent powered by
agriculture. It is therefore logical to hypothesize
that Pakistan’s economy could grow with the growth
in agriculture sector.
e long-run coe cient for
agriculture supported the hypothesis of agricultural
led growth. Gross Capital formation that includes all
the sub-sectors logically contributes more. Population
of Pakistan has an ideal composition at present with
most of the population falling between 15 to 35 years
of age. is is the stage at which the labour force can
contribute to the economy the most. e negative
coe cient of the variable could be due to the fact
that the country’s economy has not been able to
productively employ the available population to its
potential. In addition to unemployment, there could
be under-employment with a sizeable proportion of
the youth working below their potential.
e equation is tested for a variety of conditions
that need to be ful lled. Heteroskedasticity needs
to be avoided and to check for this, Breusch-PaganGodfrey test is used but the null hypothesis of
homoscedasticity could not be rejected and hence
the problem of heteroskedasticity is not observed
(Table 5). Jarque-Bera test for normality is used and
no normality problem is observed. Speci cation is
tested using the Ramsey-Reset test up to the power
of two and the model is found to be well speci ed.
Serial correlation is tested using the Breusch-Godfrey
Serial Correlation LM Test and the null hypothesis of
no serial correlation could not be rejected.
Table 5. Diagnostic Tests
Prob.
0.609
0.553
0.005
0.000
0.021
0.246
0.001
0.000
Test
Test Statistic p-value
Breusch-Godfrey (χ²)
3.448
0.178
Ramsey RESET
0.028
0.682
Jarque-Bera (χ²)
0.765
0.682
Breusch-Pagan-Godfrey (χ²)
9.66
0.290
Source: Author’s calculations.
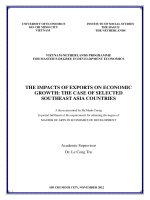
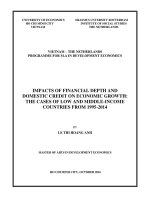
Long-run stability of the model is tested using the
CUSUM and CUSUMSq tests and the test lines stay
well within the 5% limits. e CUSUM lines need to
stay between the 5% bounds without touching any of
these to show that there is no breaking.
33
Vietnam Academy of Agricultural Sciences (VAAS)
Figure 1. CUSUM Test for the ARDL Model
Figure 2. CUSUMSq Test for the ARDL Model
CONCLUSIONS
is study tests the hypothesis of agricultural led
growth that investing in agriculture could have
positive e ect on the overall economy of Pakistan.
e elasticities are estimated to quantify the possible
e ects. In addition to value added in agriculture a few
exogenous variables are included to make the model
re ects the ground realities. ese variables include
population, gross capital formation and the terms of
trade. e results show that the hypothesis carry weight
and agricultural value added has the potential to boost
the national economy. e coe cient is however not
very strong perhaps due to the transitionary stage of
the country in the journey of economic development.
Secondly its indirect role may be fully re ected in
the model. Terms of trade does not come out to be
signi cant, during the last few decades Pakistan’s
economy struggling for a positive terms of trade with
not much success. e gross capital formation however
contributes more as expected. Pakistan needs to go
for more value added and more e cient agriculture
to have a better impact on economic growth of the
country in the years to come.
34
Journal of Vietnam Agricultural Science and Technology - No.1(4)/2019
REFERENCES
Awokuse, T. O., 2005. Export-led growth and the
Japanese economy: evidence from VAR and directed
acyclic graphs. Applied Economics Letters, 12 (14):
849-858.
Awokuse, T. O., 2007. Causality between exports,
imports, and economic growth: Evidence from
transition economies. Economics Letters, 94: 389-395.
Awokuse, T. O., and R. Xie., 2015. Does agriculture
really matter for economic growth in developing
countries? Canadian Journal of Agricultural Economics,
63: 77-99.
Bhagwati, J., and T. N. Srinivasan., 1975. Foreign Trade
Regimes and Economic Development: India. New
York: Columbia University Press.
Echevarria, C., 1997. Changes in sectoral composition
associated with economic growth. International
Economic Review, 38 (2): 431-452.
Fei, J., and G. Ranis., 1961. A theory of economic
development. American Economic Review, 51 (4):
533-565.
Gardner, B., 2005. Causes of rural economic development.
In Reshaping Agriculture’s Contribution to Society. In
Proceedings of the 25th International Conference of
Agricultural Economists, Durban.
Gemmell, N., R. Kneller, and I. Sanz., 2016. Does the
Composition of Government Expenditure Matter for
Long-Run GDP Levels? Oxford Bulletin of Economics
and Statistics, 78 (4): 9035-9049.
Gemmell, N., T. Lloyd, and M. Mathew., 2000.
Agricultural growth and intersectoral linkages
in developing economy. Journal of Agricultural
Economics, 51 (3): 353-370.
Gollin, D., S. L. Parente, and R. Rogerson., 2002.
e role of agriculture in development. American
Economic Review, 92 (2): 160-164.
GoP., 2004. Pakistan Economic Survey, 2004. Finance
Division, Economic Advisor’s Wing, Ministry of
Finance, Government of Pakistan. pp. 12.
Humphries, H., and S. Knowles., 1998. Does agriculture
contribute to economic growth? Some empirical
evidence. Applied Economics, 30 (6): 775-781.
Hwa, E. C., 1988. e contribution of agriculture to
economic growth: Some empirical evidence. World
Development, 16 (11): 1329-1339.
Johnston, B., and J. Mellor., 1961a.
e role of
agriculture in economic development. American
Economic Review, 51 (4): 566-593.
Johnston, B. F., and J. W. Mellor., 1961b. e role of
agriculture in economic development. e American
Economic Review, 51 (4): 566-593.
VAAS - YAAS Cooperation on Cross border Economics study
Jorgenson, D. W., 1961.
e development of a dual
economy. Economic Journal, 282: 309-334.
Kang, H., 2015. Agricultural exports and economic
growth: Empirical evidence from the major rice
exporting countries. Agricultural Economics-Czech,
61 (2): 81-87.
Keho, Y., 2017.
e impact of trade openness on
economic growth: e case of Cote d’Ivoire Cogent
Economics & Finance, 5.
Kogel, T., and A. Prskawetz., 2001. Agricultural
productivity growth and escape from the Malthusian
trap. Journal of Economic Growth, 6: 337-357.
Lewis, W. A., 1954. Economic development with
unlimited supplies of labour. e Manchester School,
22 (1): 139-191.
Mahmood, K., and S. Munir., 2017. Agricultural exports
and economic growth in Pakistan: an econometric
reassessment. Quality Quantity: 1-14.
MacKinnon, J. G., 1996. Numerical distribution
functions for unit root and cointegration tests. Journal
of Applied Econometrics, 11 (6): 601-618.
Narayan, P. K., 2005. e saving and investment nexus
for China: evidence from cointegration tests. Applied
economics, 37 (17): 1979-1990.
Olsson, O., and D. A. Hibbs., 2005. Biogeography
and long-run economic development. European
Economic Review, 49 (4): 909-938.
Pesaran, M. H., 1999. Bounds testing approaches to the
analysis analysis of long run relationship.
Schultz, T. W., 1964. Transforming Traditional Agriculture:
New Haven. Yale University Press.
irtle, C., L. Lin, and J. Piesse., 2003. e impact of
research-led agricultural productivity growth on
poverty reduction in Africa, Asia and Latin America.
World Development, 31 (2): 1959-1975.
Ti n, R., and X. Irz., 2006. Is agriculture the engine of
growth? Agricultural Economics, 35 (1): 79-89.
Tsakok, I., and B. Gardner., 2007. Agriculture in
economic development: primary engine of growth
or chicken and egg? American Journal of Agricultural
Economics, 89 (5): 1145-1151.
Wunder, S., 2003. Oil Wealth and the Fate of the Forest:
A Comparative Study of Eight Tropical Countries.
London: Routledge.
Date received: 15/10/2019
Date reviewed: 13/11/2019
Reviewer: Assoc. Prof. Dr. Dao e Anh
Date accepted for publication: 22/11/2019
DEVELOPING AGROFORESTRY PRODUCTION
FOR SUSTAINABLE POVERTY REDUCTION AND HUNGER ERADICATION
IN THE NORTHERN MIDLAND AND MOUNTAINOUS REGION OF VIETNAM
Luu Ngoc Quyen1,*, Nguyen Huu La1, Le Huu Huan1,
Nguyen i anh Hai1, Le Khai Hoan1
Abstract
e Northern midland and mountainous region of Vietnam is recognised as having very rich resources for agricultural
production. is sector plays a dominant role in the economic structure of the region, which accounts for 68.3%
of the household income and ranked second within eight ecological regions of Vietnam. However, this region has
been still in the poorest area of the country, which 24.5% of the total household ranked as poor while this rate was
only 8.2% in the whole country. By reviewing the most updated data and scienti c reports, this paper analysed
the status of agricultural sector and identi ed the most signi cant challenges in the application of agroforestry
for poverty reduction in the region. is paper also analysed relevant factors to highlight the opportunities to
promote sustainable agriculture production. Based on that, suitable recommendations were also made to take the
advantages and eliminate the drawbacks in order to promote the sustainable agroforestry production. In which,
diversi cation of cropping, application of future smart foods, and improvement of supporting policy are highly
potential solutions.
Keywords: Agroforestry, hunger eradication, northern midland and mountainous regions, poverty reduction
1
*
Northern Mountainous Agriculture and Forestry Science Institute, VAAS
Corresponding author: Luu Ngoc Quyen. Email:
35