A CLINICAL TRIAL ON THE GLYCEMIC INDEX (GI)
Bạn đang xem bản rút gọn của tài liệu. Xem và tải ngay bản đầy đủ của tài liệu tại đây (313.92 KB, 11 trang )
JOURNAL OF MEDICAL RESEARCH
A CLINICAL TRIAL ON THE GLYCEMIC INDEX (GI)
OF IR50404 BROWN RICE
Nguyen Mai Phuong¹,, Nghiem Nguyet Thu², Le Thi Huong¹
¹Institute for Preventive Medicine and Public Health, Hanoi Medical University
²National Institute of Nutrition
The objective was to dertermine the glycemic index (GI) of cooked IR50404 Brown Rice (BR) through
measuring glycemic responses to reference food (Glucose) and test food (cooked IR50404 BR) among twelve
participants. The study was a self-controlled clinical trial with 12 qualified participants (6 men and 6 women).
They were required to go through the study protocol with reference food and test food. For each individual,
seven blood samples were taken in the fasting state and at 15, 30, 45, 60, 90 and 120 minutes after ingestion.
Our results show that at all measurement points, the blood glucose levels after consumption of test food were
lower than after consumption of reference food. The incremental area under the curve (iAUC) and a GI value
of IR50404 BR were calculated for each meal. Mean ± SD of GI value was calculated for test food for the
combined group of subjects. Mean iAUC and GI value of IR50404 BR were 100.3 ± 56.7 mmol·min/L and 51.6 ±
14.7, significantly lower to those of reference food, which were 190.6 ± 73.3 mmol·min/L and 100, respectively.
Finding from the study demonstrated that IR50404 BR (GI = 51.6) would be classified as a low – GI food.
Keywords: Clinical trial, glycemic index, IR50404 brown rice
I. INTRODUCTION
Diabetes has been increasing rapidly
and has become a global societal threat that
does not respect borders or social class. The
global prevalence of diabetes had grown from
4.7% in 1980 to 8.5% in 2014, during which
time prevalence had increased or at best
remained unchanged in every country. Worl
Health Organization (WHO) estimated that the
number of adults living with diabetes had nearly
quadrupled since 1980, moving from 108 million
in 1980 to 422 million in 2014.¹
With 425 million adults aged 20 – 79 living
Corresponding author: Nguyen Mai Phuong,
Institute for Preventive Medicine and Public Health,
Hanoi Medical University
Email:
Received: 22/01/2020
Accepted: 04/03/2020
JMR 127 E6 (3) - 2020
with diabetes worldwide, diabetes is now one
of the largest global health emergencies of the
21st century. A further 352.1 million adults were
estimated to have impaired glucose tolerance,
putting them at high risk of developing diabetes
in the future. If this trend continues, there will be
628.6 million people inflicted by 2045.2
In recent years, the burden of noncommunicable diseases (NCDs), including
diabetes, in Vietnam has drastically increased.
Diabetes was more prevalent in big cities,3
with rates of both prediabetes and diabetes
accelerating at alarming rates.⁴ Surveys from
the early 1990s showed that the prevalence
of diabetes was 1.01% in Hanoi, 0.96% in
Hue, and 2.5% in Ho Chi Minh City – the three
representative cities of the north, center, and
south of Vietnam, respectively.⁵ After a decade,
the prevalence rate of diabetes of the country
23
JOURNAL OF MEDICAL RESEARCH
increased by 2 times, from 2.7% in 2002 to 5.4%
in 2012.³ According to International Diabetes
Federation (IDF), in Vietnam, the national
prevalence of diabetes was 5.5%. By year 2045,
it is predicted that the prevalence will be 7.7%.²
Rice is ranked third among world’s leading
cereal crops,⁶ and also serves as the primary
staple food in the Asia – Pacific Region; the
region contributes to over 90% of the world’s
rice production and consumption. In Vietnam,
rice plays an indispensable role in national food
security and agriculture. Rice is the country’s
main crop, accounting for more than 90% of
total cereal production. Rice also has a direct
effect on social security because it is consumed
by more than 90 million people and an important
source of income for more than 60 million
people living in agricultural and rural areas .
In Southeast Asia, the Vietnamese consumed
the second most of their rice production,⁶ while
Thai people consumed only approximately
55% of their rice production.⁷ According to the
General Nutrition Survey in 2010, the total daily
consumption of rice was more than 370 grams/
person.8 Therefore, rice has significant nutrition
and health implications.
Although IR50404 BR is considered to have
low economic value, it has been favoured by
farmers and developed widely in Vietnam for
years because of its outstanding characteristics,
such as short growth duration, high and stable
yield, acid sulphate soil – tolerance, and
resistance to pests. The study was conducted to
determine the GI of cooked IR50404 BR through
measuring glycemic responses to reference
food (Glucose) and test food (cooked IR50404
BR) among twelve selected participants. The
importance of IR50404 rice variety as well as
its value will be greater if it is of low GI value,
gaining its place in become a promising solution
for diabetic and obese patients’ health.
24
II. METHODS
1. Study subjects
12 healthy students of Hanoi Medical
University were selected using the following
criteria: 1) between 20 – 25 years of age, 2)
body mass index (BMI): 18.5 ≤ BMI < 23 kg/m²,
3) fasting blood glucose level under 5.6 mmol/L,
4) voluntarily agree to participate in the study.
Subjects were excluded if they met one or more
of the following criteria: 1) individuals who had
recently been diagnosed with impaired glucose
tolerance or any acute/chronic conditions, 2)
individuals who were consuming medication or
drugs known to have influences on carbohydrate
metabolism, 3) women who were pregnant or
currently breastfeeding.
2. Study design
Time and location: Our study was conducted
from December, 2018 to April, 2019 at Vietnam
National Institute of Nutrition.
Study design: This was a self-controlled
clinical trial with crossover experiments to
determine the glycemic index of IR50404 Brown
Rice on healthy adults. The protocol was adapted
from TCVN 10036:2013 (Vietnam Standards
and Quality Institute [VSQI], 2013), equivalent
to ISO 26642:2010 (International Organization
of Standardization [ISO], 2010)9 and was in
line with the procedure recommended by the
Food and Agriculture Organization of the United
Nations (FAO).10
Sample size: According to international
standard [TCVN 10036:2013 (ISO 26642:2010),⁹
5.31], the method for the determination of the GI
of carbohydrates in foods required a selection of
a minimum of 10 healthy subjects. In this study,
12 participants were recruited from 35 screened
volunteeers.
Reference meal: Glucose solution with 50g
sugar diluted in 200ml water.
JMR 127 E6 (3) - 2020
JOURNAL OF MEDICAL RESEARCH
Test meal: The type of rice tested was IR50404 BR (Vietnam). The rice-to-water ratio followed
the cooking instruction from the manufacturer. The rice was gently washed, then cooked using a
common rice-cooker. Before the real test, the cooked rice was tested twice to check its stability.
All the meals were preapared early in the morning of the test days at Department of Clinical
Nutrition and Dietetics – National Institue of Nutrition.
Table 1. Weight, energy and nutrients content of reference meal and test meal
Reference meal
Test meal
(Glucose)
(IR50404 BR, boiled)
Weight (g)
50
146
Energy (kcal)
200
242
Available carbohydrate (g)
50
50
Protein (g)
0
5.5
Fat (g)
0
2.2
Study variables and data collection:
Table 2. Study variables
Variables
Indicators
General
information
Data collection method
Name
Age
Gender
Questionnaire
Medical history
Body weight
Characteristics
Anthropometric
Height
BMI
TANITA digital scale
SECA Stadiometer 217
BMI (kg m2) =
Weight (kg)
2
2
Height (m )
Electronic blood pressure monitor (Omron
HEM 700)
Blood pressure
Heart rate
Screening fasting blood glucose
level
Count the number of pulse beats in 60
seconds.
Capillary blood samples were dertermined
by the Accu-Chek Glucometer
Fasting
After 15 min
Glycemic
Response
Blood glucose
response
After 30 min
After 45 min
After 60 min
Venous blood samples were analysed by
the automatic biochemical machine AU480
(Beckman Coulter company,
Germany)
After 90 min
After 120 min
JMR 127 E6 (3) - 2020
25
JOURNAL OF MEDICAL RESEARCH
Variables
Indicators
Incremental area under the
blood glucose curve value for
IR50404 Brown Rice (iAUCRice)
Glycemic Index
Incremental area under the
blood glucose curve value for
Gluose (iAUCGluco)
Glycemic index of IR50404
Brown Rice (GIRice)
Data collection method
The incremental area under the blood
glucose curve (iAUC) was computed by
the trapezoidal method.
iAUCRice
# 100
GIRice = iAUC
Glucose
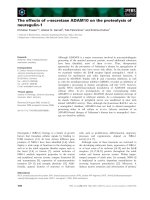
Study procedures:
Figure 1. Study procedures
3. Data analysis
Statistical analysis was performed using Stata software version 14.0. We used descriptive
statistics to characterize the study sample, continuous data were presented as mean ± standard
deviation (SD). Due to the small sample size (n = 12), the Mann-Whitney U test was used to compare
the significance of differences of the glycemic response as well as the value of iAUC between test
meal and reference meal. The Wilcoxon signed - rank test was used for comparisons at baseline
and after intervention. There were no missing values for variables used in this analysis. All statistical
significance was set at p < 0.05.
26
JMR 127 E6 (3) - 2020
JOURNAL OF MEDICAL RESEARCH
4. Ethics
Ethical approval of this study was obtained
from National Institute of Nutrition Ethics
Committee (Approval number: 137/VDD -
QLKH). All participants were given information
on the purpose, the associated risks and
benefits of the study. All participants were
required to provide written informed consent
before inclusion in the study.
III. RESULTS
1. Characteristics of Subjects
Table 3. Characteristics of the subjects
Characteristics
Men (n = 6)
Women (n = 6)
Both sexes (n = 12)
Mean
SD
Mean
SD
Mean
SD
Age (years)
22.5
1.8
20.7
1.0
21.6
1.7
Weight (kg)
62.2
6.3
48.8
2.4
-
-
Height (cm)
169.6
3.3
155.7
3.4
-
-
BMI (kg/m2)
21.6
2.0
20.1
0.8
20.9
4.7
Heart Rate (BPM)
72.2
7.9
74
10.4
73.1
8.8
Systolic (mmHg)
119.7
9.6
106.2
5.5
112.9
10.3
Diastolic (mmHg)
72.3
4.8
67.2
2.5
69.8
4.6
Fasting Blood
Glucose Level
(mmol/L)
4.75
0.3
4.6
0.7
4.7
0.5
Twelve healthy volunteers participated in
this study. The subjects were comprised of
six men and six women. Their mean age and
BMI were 21.6 ± 1.7 years and 20.9 ± 4.7 kg/
m2, respectively. Table 3 also showed that
all participants had normal heart rates, blood
pressures and fasting blood glucose levels.
2. Glycemic response to cooked IR50404
Brown Rice
Results of postprandial blood glucose levels
of the reference meal compared to test meal
among twelve volunteers were presented in
Table 4.
On all occasions, the blood glucose levels
after consumption of test food were lower than
after consumption of reference food. At minute
0 or baseline, there was an overlapping of
mean fasting blood glucose responses between
JMR 127 E6 (3) - 2020
glucose and IR50404 BR (5.2 mmol/L), indicating
that there was no significant difference between
them (p > 0.05). Next, at minute 15, the blood
glucose response of IR50404 Brown Rice was
5.6 mmol/L. Compared to the reference food
(6.3 mmol/L), the difference was significant (p
< 0.05). Following that, mean blood glucose
response of IR50404 BR measured at minute
30 showed a significant difference with that of
reference food as well (p < 0.05). The mean
blood glucose of IR50404 BR was 7.2 mmol/L
while the value of glucose was 7.8 mmol/L. A
steady rise in blood glucose was evident after
ingestion of reference and test meals with
the peak reaching at minute 45. The mean
peak value of IR50404 (7.3 mmol/L) was
lower than the reference meal glucose (8.1
mmol/L), but the difference between them was
27
JOURNAL OF MEDICAL RESEARCH
not significant (p > 0.05). Findings from this
study demonstrated that at minute 60, mean
blood glucose response of reference food was
reduced to 7.4 mmol/L and significantly higher
than mean blood glucose response of IR50404,
which was maintained temporarily at 6.3
mmol/L. Subsquently, at minute 90, mean blood
glucose response of IR50404 was significantly
reduced to 5.4 mmol/L and significantly lower
than the reference food (6.4 mmol/L). Finally,
at minute 120, mean blood glucose responses
of IR50404 showed no statistically significant
difference with that of the reference food (p >
0.05).
Table 4. Postprandial blood glocose levels after consumption of Glucose solution
and cooked IR50404 Brown Rice
Postprandial blood glucose (mmol/L)
Time
Reference meal (Glucose)
Test meal
(Cooked IR50404 BR)
p-value*
0 min
5.2 ± 0.4
5.2 ± 0.4
0.9769
15 min
6.3 ± 0.5
5.6 ± 0.4
0.0015
30 min
7.8 ± 0.7
7.2 ± 0.6
0.0496
45 min
8.1 ± 0.8
7.3 ± 1.2
0.0831
60 min
7.4 ± 1.1
6.3 ± 1.1
0.0209
90 min
6.4 ± 0.8
5.4 ± 0.7
0.0072
120 min
5.1 ± 1.2
4.9 ± 0.4
0.5636
*: Mann – Whitney U test
Although each portion contained the same
amounts of carbohydrate, there was an almost
two – fold range in blood glucose responses
between two foods with the test food (IR50404
BR) creating a smaller increase in blood
glucose response compared to the reference
food (Glucose).
3. The glycemic index (GI) of cooked
IR50404 Brown Rice
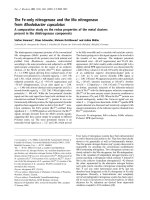
The iAUCs of each participant reflected
28
changes in their blood glucose over 2 hours
after consuming different test meals. As shown
in Figure 2, both the iAUCs after eating the
cooked IR50404 BR and after drinking glucose
varied considerably among all participants.
However, their results shared a common trend.
Each individual’s iAUC for glucose solution
was significantly greater than their iAUC for
cooked IR50404 BR, despite the fact that the
portions had the same amount of 50 grams of
carbohydrates.
JMR 127 E6 (3) - 2020
JOURNAL OF MEDICAL RESEARCH
Figure 2. The incremental area under curve (iAUC) after consuming Glucose solution
and IR50404 Brown Rice of all partcipants
As shown in Table 5, the mean iAUC value of IR50404 BR was 100.3 ± 56.7 mmol·min/L,
significantly lower compared to the reference food (190.6 ± 73.3 mmol·min/L). The mean value of
GIRice (Mean ± SD) was 51.6 ± 14.7, which was significantly lower than the reference food (GI = 100).
Table 5. The iAUC and GI of IR50404 Brown Rice and Glucose
Mean (95% CI)
Men
Women
p*
iAUCRice
(mmol×min/L)
100.3 ± 56.7 (67.5 – 133.1)
95.3 ± 73.2
105.3 ± 40.6
0.3358
iAUCGluco
(mmol×min/L)
190.6 ± 73.3 (142.8 – 225.5)
170.0 ± 89.6
211.2 ± 52.7
0.1495
51.6 ± 14.7 (43.2 – 60.2)
53.6 ± 16.5
49.6 ± 13.9
0.6310
GIRice
*: Mann – Whitney U test between men and women
Due to natural differences, such as body
weight and metabolism, blood glucose
responses to the same food varied among
different individuals. The use of the reference
food to calculate GI values reduced the
variation between the subjects’ blood glucose
results to the same food arising from those
differences. Therefore, the GI values for the
JMR 127 E6 (3) - 2020
same food varied less among the subjects than
their glucose iAUC values.
Table 5 also showed that the mean value
of iAUCRice, iAUCGluco, GIRice among male
participants were 95.3 ± 73.2 (mmol·min/L),
170.0 ± 89.6 (mmol·min/L), 53.6 ± 16.5,
respectively. The mean iAUCRice and iAUCGluco
values were higher among female participants
29
JOURNAL OF MEDICAL RESEARCH
(105.3 ± 40.6 mmol·min/L and 211.2 ± 52.7
mmol·min/L, respectively). However, the
mean GIRice among female participants was
lower (49.6 ± 13.9). There were no statistical
differences in the mean iAUCRice, iAUCGluco, and
GIRice values between men and women (p >
0.05).
IV. DISCUSSION
Findings from this study indicated that
there was a significantly greater inter-subject
variation of blood glucose response to glucose
solution than to IR50404 BR at all measurement
intervals up to 2 hours. The blood glucose
levels rose consistently from the baseline,
reached the peak at minute 45, decreased,
and lowered than the baseline value at minute
120. We also observed a slow reduction of
mean blood glucose responses of IR50404
BR after 90 minutes (5.4 mmol/L) until 120
minutes (4.9 mmol/L). This situation was vital
in prolonging satiety duration of participants
after ingestion of brown rice. These results
were in line with results from Bui Thi Nhung
et al. That study was designed to evaluate the
effect of a 4 - month pre–germinated brown rice
(PGBR) administration on various parameters
in Vietnamese women aged 45 – 65 years
with impaired glucose tolerance (IGT). Sixty
subjects were divided into white rice (WR)
or PGBR group. In the PGBR group, blood
glucose was (p < 0.0001) significantly reduced
after intervention (5.31 mmol/L) compared to
the baseline (6.05 mmol/L). In the WR group,
the results found no reduction but an increase
from 5.73 mmol/L to 5.89 mmol/L (p = 0.246).11
In the study mentioned above, the results of
the fasting blood sugar concentration were
higher than ours (6.05 mmol /L compared to
4.7mmol/L). It was possibly due to differences
in age of subjects between 2 studies (45 - 65
30
years of age compared to 20-25).11 Since our
study included younger subjects, they likely
were able to regulate blood sugar better than
older individuals. On the other hand, this
difference could be explained by the different
criteria for selecting subjects between 2 studies.
The results of glycemia changes over time
of subjects in our study were also lower than
those in Nghiem Nguyet Thu’s study using
Vibigaba 2 Rice.12 In our study, changes in
postprandial blood glucose after ingestion of
IR50404 BR in comparison to the baseline were
recorded as increases of 0.4 ± 0.0 mmol/L after
15 minutes, 2.0 ± 0.1mmol/L after 30 minutes,
2.1 ± 0.7mmol/L after 45 minutes, 1.1 ± 0.6
mmol/L after 60 minutes, 0.2 ± 0.2 mmol/L
after 90 minutes, and a final decrease of 0.3 ±
0.1mmol/L after 120 minutes; while these data
in the study using Vibigaba 2 Rice were 1.2 ±
0.7, 2.4 ± 0.8, 2.2 ± 1.2, 1.2 ± 0.8, 0.2 ± 1.3,
0.4 ± 0.7, respectively. This finding indicated
that the carbohydrate metabolism of IR50404
Brown Rice was slower than that of Vibigaba 2
Rice at the same time after eating rice cooked
from these two types of rice. The reason was
probably due to the difference not only in the
composition of protein and fat, but also in the
quality of carbohydrate content between these
two types of rice.
The GI is an important parameter of food
quality which compares the hyperglycemic
effect of a tested meal with a standard food,
such as pure glucose. Results obtained from
our study revealed that IR50404 BR had low
GI value (51.6 ± 14.7). Many studies have
shown large variations in the GI of rice, and
consequently, these findings have led to large
disagreements as to whether rice should be
considered a high or low GI food. The great
difference in GIs of rice is thought to be due to a
number of reasons. Some studies have shown
JMR 127 E6 (3) - 2020
JOURNAL OF MEDICAL RESEARCH
that the classification of rice as low or high GI
food appeared to mainly depend on the amylose
content of the commercial varieties.13 Miller et al
determined the GI of white and brown varients
of three rice varieties (Doongara, Clarose,
and Pelde) and concluded that rice with a
high amylose fraction of about 28% produced
a lower blood glucose and insulin response.
Doongara, a high amylose rice (28% amylose
rice) produced significantly lower GIs for both
the white (GI = 64) and brown types (GI = 66).
well as GI values 16. In high temperature for a
long period, the carbohydrate structure would
changed. White basmati rice cooked for 10
minutes and had a low GI of 50, but basmati
and wild rice, brown and white basmati rice,
cooked for 25 minutes, were considered high
GI foods.16
To date, previous studies in human has
indicated that brown rice was a better selection
to prevent glycemia after meal and intolerance
of blood glucose, type 2 diabetes.18,19,20
The other two medium amylose (20%) varieties,
Calrose and Pelde, had higher GI values
(Calrose WR – 83, Calrose BR – 87, Pelde WR
– 93, Pelde BR – 76).14 Findings from a study
on three common varieties of Bangladeshi rice
by Fatema et al also confirmed these results.
The amylose content of the three tested rice
samples (BR - 14, BR - 29 and BR - 44) were
27, 29.4 and 27.2% respectively and they could
be categorized as having low GI values of 54.5,
50.3, 43.1, respectively.15 Studies conducted
on local rice varieties showed similar trends.
White basmati rice, a popular Indian rice with a
medium amylose content (20 – 25%) had a GI
around 50 – 58.16
Food processing methods also effect the
GI of the final product. In this study, IR50404
BR was eaten in the boiled form as rice is
predominantly boiled in daily life. It is evident
that the method of cooking directly correlates
with digestibility and the glycemic response.
In a study among Vietnamese processed rice
products, Tran Quoc Cuong et al reported that
red rice and sticky rice had high GIs (75.1 ± 8.9
and 79.7 ± 4.3 respectively) while steamed, thin
rice pancakes, rice vermicelli and broken rice
had low GI values (the GI are 38.7 ± 4.4; 51.2
± 5.1 & 53.0 ± 6.6 respectively) 17. In addition,
Ranawana et al stated that a longer cooking
time elicited greater glycemic responses as
Until now, diabetes associations have been
recommended to use low or moderate GI foods
in clinical nutrition and GI has been recognized
as an indicator for classification of rich
carbohydrate food. Thus, low and moderate
GI rice varieties, such as IR50404 Brown Rice
in this study, are ideal to prevent NCDs, and
it would be a promising product in controlling
posprandial blood glucose for Vietnamese.
In our study, due to limited resources, we
didn’t perform a multivariate statistical analysis.
According to Bronus et al, for routine use of
the GI method, glucose measurement was
enough, and until now, most GI studies have
not measured the postprandial insulinemic
responses accompanying the glycemic
responses of the test food examined. However,
measurement of insulin response to foods,
and the introduction of an insulinemic index
concept21 could be value in investigating
health issues. Therefore, measurement of both
glucose and insulin was recommended for more
metabolic studies.22
JMR 127 E6 (3) - 2020
V. CONCLUSION
Based on the clinical trial of 12 participants
through 2 experiments, we concluded:
The glycemic response after consumption of
50 grams carbohydrate from cooked IR50404
Brown Rice was lower than after consumption
31
JOURNAL OF MEDICAL RESEARCH
of 50 grams carbohydrate from glucose at all
time points of the experiments.
Finding from the study demonstrated that
IR50404 Brown Rice is a low – GI food with a
GI value of 51.6.
ACKNOWLEDGEMENT
We would like to express our special thanks
to all fellow members of the research team, who
are working at National Institute of Nutrition,
for their dedicated involvement in every step
throughout the entire process. We also would
like to extend our thanks to all participants for
voluntarily taking part in this project from the
very beginning until the end.
Conflict of interest: The authors declare no
conflict of interest.
REFERENCES
1. NCD Risk Factor Collaboration (NCDRisC). Worldwide trends in diabetes since
1980: a pooled analysis of 751 populationbased studies with 4·4 million participants.
Lancet Lond Engl. 2016; 387(10027): 1513 1530. doi:10.1016/S0140-6736(16)00618-8
2. International Diabetes Federation. IDF
Diabetes Atlas, 8th Edn. Brussels, Belgium:
International Diabetes Federation; 2017. https://
diabetesatlas.org.
3. National Hospital of Endocrinology. Report
on the national epidemiological mapping survey
of diabetes in Vietnam 2012. National Hospital
of Endocrinology; 2012.
4. Chung T. Nguyen, Ngoc Minh Pham,
Lee AH, Binns CW. Prevalence of and Risk
Factors for Type 2 Diabetes Mellitus in
Vietnam: A Systematic Review. Asia Pac
J Public Health. 2015; 27(6): 588 - 600.
doi:10.1177/1010539515595860
5. Phan Si Quoc, Charles M-A, Nguyen Huy
Cuong, et al. Blood Glucose Distribution and
32
Prevalence of Diabetes in Hanoi (Vietnam).
Am J Epidemiol. 1994; 139(7): 713 - 722.
doi:10.1093/oxfordjournals.aje.a117061
6. USDA Economics, Statistics and
Market Information System. Grain: World
Markets and Trade. May 2019. https://usda.
library.cornell.edu/concern/publications/
zs25x844t?locale=en.
7. Le Trong Hai. The Rice Situation in Viet
Nam.
2012.
/>documents/rice-situation-viet-nam-tacr.
Accessed May 16, 2019.
8. Vietnam National Institute of Nutrition.
General Nutrition Survey 2009 - 2010.
2010.
/>doc_details/358-general-nutritionsurvey-2009-2010.html. Accessed May 2, 2019.
9. Vietnam Standards and Quality Institute
(VSQI). Food Products. Determination of the
Glycaemic Index (GI) and Recommendation
for Food Classification. Vol 10036: 2013;
2013. />view?sohieu=TCVN+10036%3A2013.
Accessed June 10, 2019.
10. Food and Agriculture Organization
of the United, World Health Organization.
Carbohydrates in Human Nutrition: Report of
a Joint FAO/WHO Expert Consultation, Rome,
14-18 April 1997. Food & Agriculture Org. 1998.
11. Bui Thi Nhung, Le Thi Hop, Nguyen Do
Huy, et al. Pre-Germinated Brown Rice Reduced
Both Blood Glucose Concentration and Body
Weight in Vietnamese Women with Impaired
Glucose Tolerance. J Nutr Sci Vitaminol (Tokyo).
2014; 60(3): 183-187. doi:10.3177/jnsv.60.183
12. Nghiem Nguyet Thu, Nguyen Anh Tuan,
Tran Thu Trang, Phan Bich Nga, Truong Tuyet
Mai. The Glycemic Index of Some Germinated
Rice. Viet Nam National Institute of Nutrition
13. Juliano BO, Goddard MS. Cause of
varietal difference in insulin and glucose
JMR 127 E6 (3) - 2020
JOURNAL OF MEDICAL RESEARCH
responses to ingested rice. Plant Foods
Hum Nutr. 1986; 36(1): 35 - 41. doi:10.1007/
BF01091751
14. Miller JB, Pang E, Bramall L. Rice: a
high or low glycemic index food? Am J Clin
Nutr. 1992; 56(6): 1034 - 1036. doi:10.1093/
ajcn/56.6.1034
15. Fatema K, Rahman F, Sumi N, Kobura
K, Ali L. Glycemic index of three common
varieties of Bangladeshi rice in healthy subjects.
Afr J Food Sci. 2010; 4: 531 - 535.
18. Bornet FR, Costagliola D, Rizkalla SW,
et al. Insulinemic and glycemic indexes of six
starch-rich foods taken alone and in a mixed
meal by type 2 diabetics. Am J Clin Nutr. 1987;
45(3): 588 - 595. doi:10.1093/ajcn/45.3.588
19. Jenkins DJ, Kendall CW, Augustin LS,
et al. Glycemic index: overview of implications
in health and disease. Am J Clin Nutr. 2002;
76(1): 266S - 273S. doi:10.1093/ajcn/76/1.266S
20. Ludwig DS. The glycemic index:
physiological mechanisms relating to obesity,
16. Ranawana DV, Henry CJK, Lightowler
HJ, Wang D. Glycaemic index of some
commercially available rice and rice products in
Great Britain. Int J Food Sci Nutr. 2009; 60 Suppl
4:99 - 110. doi:10.1080/09637480802516191
17. Tran Quoc Cuong, Nguyen Thi Anh
Van, Luong Thi Ngoc Ha, Le Thi Kim Qui.
Determination of glycemic index of some
Vỉetnamese food rich in carbohydrate. J Food
Nutr Sci. 2012; 8(3).
diabetes, and cardiovascular disease. JAMA.
2002; 287(18): 2414 - 2423.
21. Holt SH, Miller JC, Petocz P. An insulin
index of foods: the insulin demand generated by
1000-kJ portions of common foods. Am J Clin
Nutr. 1997; 66(5): 1264 - 1276. doi:10.1093/
ajcn/66.5.1264
22. Brouns F, Bjorck I, Frayn KN, et al.
Glycemic index methodology. Nutr Res Rev.
2005; 18: 145 - 171. doi: 10.1079/NRR2005100.
JMR 127 E6 (3) - 2020
33