Economic growth and economic development 71
Bạn đang xem bản rút gọn của tài liệu. Xem và tải ngay bản đầy đủ của tài liệu tại đây (116.68 KB, 1 trang )
Introduction to Modern Economic Growth
k(t+1)
45°
sf(k(t))+(1–δ)k(t)
k(t+1)
45°
k(t+1)
sf(k(t))+(1–δ)k(t)
45°
sf(k(t))+(1–δ)k(t)
k(t)
0
k(t)
0
Panel B
Panel A
k(t)
0
Panel C
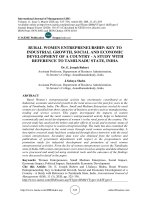
Figure 2.5. Examples of nonexistence and nonuniqueness of steady
states when Assumptions 1 and 2 are not satisfied.
Equation (2.18) and (2.19) then follow by definition.
Ô
Figure 2.5 shows through a series of examples why Assumptions 1 and 2 cannot
be dispensed with for the existence and uniqueness results in Proposition 2.2. In
the first two panels, the failure of Assumption 2 leads to a situation in which there
is no steady state equilibrium with positive activity, while in the third panel, the
failure of Assumption 1 leads to non-uniqueness of steady states.
So far the model is very parsimonious: it does not have many parameters and
abstracts from many features of the real world in order to focus on the question of
interest. Recall that an understanding of how cross-country differences in certain
parameters translate into differences in growth rates or output levels is essential for
our focus. This will be done in the next proposition. But before doing so, let us
generalize the production function in one simple way, and assume that
f (k) = af˜ (k) ,
where a > 0, so that a is a shift parameter, with greater values corresponding to
greater productivity of factors. This type of productivity is referred to as “Hicksneutral” as we will see below, but for now it is just a convenient way of looking
at the impact of productivity differences across countries. Since f (k) satisfies the
regularity conditions imposed above, so does f˜ (k).
57