U.S. Manufacture of Rail Vehicles for Intercity Passenger Rail and Urban Transit ppt
Bạn đang xem bản rút gọn của tài liệu. Xem và tải ngay bản đầy đủ của tài liệu tại đây (2.09 MB, 56 trang )
U.S. Manufacture of Rail
Vehicles for Intercity
Passenger Rail and
Urban Transit
A Value Chain Analysis
June 24, 2010
Marcy Lowe, Saori Tokuoka, Kristen Dubay,
and Gary Gereffi
Contributing CGGC researcher: Tali Trigg
U.S. Manufacture of Rail Vehicles for Intercity Passenger Rail and Urban Transit
Page 1
This research was prepared on behalf of Apollo Alliance with support from the Rockefeller Foundation
and Surdna Foundation. The authors would like to thank Matt Mayrl of the Apollo Alliance for
comments on early drafts. Many thanks also to the following reviewers: Doug Bowen, Chandra Brown,
Nora Friend, Ruggero Golini, Dennis Harwig, Hatsuhiko Kageyama, Mike Mekhiche, Richard Moss,
Matthew Palilla, Mike Pracht, Maryanne Roberts, Robin Stimson, and Chuck Wochele. Errors of fact or
interpretation remain exclusively with the authors. We welcome comments and suggestions.
The lead author can be contacted at
List of Abbreviations
APMs Automated People Movers
ARRA American Recovery and Reinvestment Act
CNR China North Locomotive and Rolling Stock Industry Group
CSR China South Locomotive and Rolling Stock Industry Group
DMUs Diesel Multiple Units
EMUs Electric Multiple Units
EMD Electro Motive Diesel
EWI Edison Welding Institute
FRA Federal Railroad Administration
FTA Federal Transit Administration
HSR High Speed Rail
IAMAW International Association of Machinists
IBEW International Brotherhood of Electrical Workers
LRT Light Rail Transit
NAICS North American Industry Classification System
OEM Original Equipment Manufacturer
PRIIA Passenger Rail Investment and Improvement Act of 2008
UNIFE Union des Industries Ferroviaires Européennes
U.S. PIRG Federation of State Public Interest Research Groups
Photo Permissions:
Cover photo by Dave Wilcox (2008), Tostie14, (2005) and Doug Beghtel (2009)
© June 22, 2010. Center on Globalization, Governance & Competitiveness
Duke University
U.S. Manufacture of Rail Vehicles for Intercity Passenger Rail and Urban Transit
Page 2
Table of Contents
EXECUTIVE SUMMARY 4
INTRODUCTION 6
PASSENGER AND TRANSIT RAIL: 6 TYPES 8
GLOBAL MARKET FOR PASSENGER AND TRANSIT RAIL VEHICLES 13
U.S. MARKET 16
Major players 16
Size of market 18
Domestic content requirements 22
Pent-up demand 23
U.S. VALUE CHAIN 25
Method 25
How the industry is organized 25
General characteristics 28
Tier 1 29
Tier 2 30
Full list of identified suppliers with U.S. manufacturing locations 30
FIRM-LEVEL DATA ON TIER 1 AND TIER 2 FIRMS 33
Tier 1 33
Tier 2 35
Gaps in the U.S. value chain 45
New U.S. entrants 46
U.S. MANUFACTURING JOBS IN TIER 1 AND TIER 2 48
FUTURE OF THE U.S. SUPPLY BASE 51
CONCLUSION 53
REFERENCES CITED 54
List of Figures
Figure 1. Rail vehicle manufacturing jobs in the broader context of total rail industry jobs 7
Figure 2. Global rail equipment market, by region, 2005-2007 13
U.S. Manufacture of Rail Vehicles for Intercity Passenger Rail and Urban Transit
Page 3
Figure 3. International comparison of high-speed rail vehicles and enabled track, 2008 15
Figure 4. U.S. market for passenger and transit rail vehicles, 2005-2007, by type (total market: $1,687
million ) 18
Figure 5. U.S. market for new railcars for regional, metro, light rail and streetcars 19
Figure 6. U.S. planned fixed guideway projects, according to local agencies’ long-range plans 23
Figure 7. Projected Amtrak new rail vehicle needs, 2010-2023 (number of units, by type) 24
Figure 8. Organization of U.S. manufacture of vehicles for passenger and transit rail 26
Figure 9. U.S. value chain for passenger and transit rail vehicles 27
Figure 10. U.S. manufacturing locations for passenger and transit rail vehicles and components 48
Figure 11. Estimated current U.S. jobs in the manufacture of passenger and transit rail vehicles 50
List of Tables
Table 1. Passenger rail and urban transit rail: types of power supply 9
Table 2. Passenger rail characteristics: intercity, high-speed rail, and regional rail 11
Table 3. Transit rail characteristics: metro, light rail, and streetcars 12
Table 4. Rail car and locomotive OEMs serving the U.S. market, with international footprint 17
Table 5. U.S. market share by rail car type, 2006-2009 21
Table 6. Passenger and transit railcars: share of value added 28
Table 7. Suppliers with U.S. manufacturing locations for passenger and transit rail vehicles 31
Table 8. Tier 1 firms with U.S. manufacturing and assembly locations: firm-level data 34
Table 9. Tier 2 firms with U.S. manufacturing and assembly locations: firm-level data 37
U.S. Manufacture of Rail Vehicles for Intercity Passenger Rail and Urban Transit
Page 4
Executive Summary
Since the 1950s, the United States has invested far more heavily in highways and air transport than in
rail transportation. There are signs, however, that the nation is beginning to step up its commitment to
rail by increasing funds for intercity passenger rail (Amtrak) and urban transit rail (metros, light rail and
streetcars). The 2009 American Recovery and Reinvestment Act (ARRA) provided a total of $17.7
billion for transit (including bus transit) and intercity rail programs combined,
1
including $1.3 billion for
Amtrak and $8 billion for new high-speed rail corridors and intercity passenger rail. These are small
investments compared to those in other countries with well-developed rail systems, but they constitute a
watershed in the nation’s commitment to passenger rail, and they have been presented as a “down
payment” on future investments (White House, 2010). Similarly, current proposals for the much-
anticipated renewal of the nation’s six-year surface transportation bill call for significantly greater
commitments to public transit, including rail.
If the United States is to increase its investment in passenger rail and transit rail, several important
questions arise: How much of the required “rolling stock”—the passenger locomotives and railcars—
will be manufactured in the United States? What gaps in the current U.S. supply chain need to be filled?
What are the relevant opportunities for U.S. manufacturing?
To determine the extent of U.S. manufacturing potential and show where it lies, we mapped out the U.S.
supply chain for six rail types: intercity passenger, high speed, regional, metro, light rail, and streetcars.
Key findings:
1) The supply chain includes at least 249 U.S. manufacturing locations in 35 states
. We identified a total
of 15 railcar builders, 5 locomotive builders, and 159 Tier 2 systems and component suppliers with
relevant U.S. manufacturing locations. These ranged from small firms with fewer than 20 employees
and only one manufacturing site, to large, diverse firms with thousands of employees and several
relevant U.S. manufacturing locations.
2) While U.S. domestic content rules have ensured that 60% of content is U.S made, higher-value
activities are still mostly performed abroad. In Tier 1 as well as Tier 2, railcar OEMs
2
and system
suppliers, many of which are non-U.S owned firms, predominantly keep their higher value activities
such as design and engineering in their home countries. They meet Buy America requirements by
completing the manufacturing and assembly in the United States, either at permanent facilities or at
temporary sites using local subcontractors.
3) The U.S. value chain includes several gaps—specific manufacturing activities that are not typically
performed in the United States. These gaps vary among the six target rail types. For example, a high-
1
Calculation by Michael Renner, Senior Researcher at Worldwatch Institute, based on data from the
GovernmentAccountability Office, Federal Transit Administration, and Federal Railroad Administration.
2
Original equipment manufacturers, or firms at the end of the supply chain that assemble the final product.
U.S. Manufacture of Rail Vehicles for Intercity Passenger Rail and Urban Transit
Page 5
speed rail component may currently be manufactured exclusively overseas, while the equivalent
component for regional rail is made domestically by several firms. Depending on the rail category,
activities often performed outside the United States may include propulsion systems, fabricated trucks,
3
electronic systems, and doors. Often these gap categories require complex machinery and special skills,
so companies typically invest in them only in overseas locations where there is a stronger market.
4) Manufacture and assembly of passenger and transit railcars and locomotives comprise an estimated
10,000 to 14,000 U.S. jobs. These include approximately 4,000 employees in Tier 1 and 6,000 - 10,000
employees in Tier 2 who devote at least a portion of their labor to the manufacture and assembly of
these vehicles and components.
5) These jobs may have a more positive impact than their numbers suggest. Compared with other job
sectors, manufacturing is estimated to have the largest multiplier effect—generating $1.40 of added
economic activity for each $1 of direct spending—and creating on average 2.5 additional jobs for each
manufacturing job (Hindery et al., 2009).
4
In addition, the majority of relevant manufacturing facilities
are in the Midwest and Northeast industrial states, in which the current economic recession has created
the severest job losses. There is also a modest degree of overlap between Tier 2 firms and the motor
vehicle industry: 24 of the firms we identified, or about 15%, also produce components for motor
vehicles. If current trends continue and the passenger and transit rail vehicle market continues to grow,
these firms—as well as their Tier 3 suppliers—may welcome the opportunity to supply a market that is
growing in the midst of the economic downturn.
6) Growing the U.S. industry will require committing much larger and more consistent U.S. investments
to intercity passenger and urban transit rail. Input we received from firms through online surveys, phone
interviews, and other contacts consistently emphasized this need for increased, steady demand in order
to stabilize the market and expand the relevant U.S. manufacturing base.
7) Several additional measures can help develop the U.S. industry and capture higher value activities in
the supply chain. These include improving the accountability and transparency of Buy America and Buy
American rules; revisiting U.S. standards and specifications to stabilize the market and bring down
costs; increasing government support for research and development (R&D), and adopting a
collaborative, orchestrated approach to expanding the supply chain, encouraging innovation, and
bringing new technologies all the way through prototyping and commercialization.
3
Also called “bogies,” or the undercarriage assembly incorporating the wheels, suspension, brakes and traction motors.
Definition from Wikipedia, />
4
At the upper end of this job multiplier, each high-tech manufacturing job is estimated to create 16 associated jobs.
U.S. Manufacture of Rail Vehicles for Intercity Passenger Rail and Urban Transit
Page 6
Introduction
Since the 1950s, the United States has invested far more heavily in highways and air transport than in
rail transportation. Recently the U.S. Public Interest Group, citing Congressional Budget Office data,
calculated that between 1956 and 2006, for every $1 invested in rail, the nation invested $6 in aviation
and $16 in highways (U.S. PIRG Education Fund, 2010). There are signs, however, that U.S. priorities
are shifting. The 2009 American Recovery and Reinvestment Act (ARRA) provided a total of $17.7
billion for transit (including bus transit) and intercity rail programs combined,
5
including $1.3 billion for
Amtrak and $8 billion for new high-speed rail corridors and intercity passenger rail.
While these are small investments compared to those in other countries with well-developed passenger
rail systems, they constitute a watershed in the nation’s commitment to passenger rail, and they have
been presented as a “down payment” on future investments (White House, 2010). Similarly, current
proposals for the much-anticipated renewal of the nation’s six-year surface transportation bill call for
significantly greater commitments to public transit, including rail.
If the United States is to increase its investment in passenger rail and transit rail, several important
questions arise: How much of the required “rolling stock”—the passenger locomotives and railcars—
will be manufactured in the United States? What gaps in the current U.S. supply chain need to be filled?
What are the relevant opportunities for U.S. manufacturing?
Indeed, the award of high-speed rail grants highlighted the need not only to improve transportation
choices but also to create U.S. jobs and revitalize the manufacturing sector. Transportation Secretary
Ray LaHood announced in December 2009 that more than 30 rail manufacturers, domestic- and foreign-
owned, had committed to establish or expand their U.S. operations if they were chosen by states
receiving the new high-speed rail grants (U.S. Federal Railroad Administration, 2009).
This report will map out the U.S. value chain for passenger and transit rail vehicles and identify the
nature and extent of the manufacturing that takes place in the United States. We will estimate the
number of U.S. manufacturing jobs involved in Tier 1 (rail car and locomotive builders) and Tier 2
(component parts manufacturers). Of course, these manufacturing jobs constitute just one category of
jobs in the rail industry, which comprises many other categories supported by investments in public
transportation, both on the capital side and the operating side. Previous research conducted on behalf of
the American Public Transit Association (APTA) has estimated the number of jobs supported per billion
dollars of public investment. On the capital side (jobs in manufacturing, construction, and project
management) it is estimated that for every $US billion dollars of capital investment, 24,000 jobs are
supported for one year. On the operating side, this figure is estimated at 41,000 jobs. The focus of this
study is current manufacturing employment in two categories that fall under the capital side: 1) railcar
5
Calculation by Michael Renner, Senior Researcher at Worldwatch Institute, based on data from the
GovernmentAccountability Office, Federal Transit Administration, and Federal Railroad Administration.
U.S. Manufacture of Rail Vehicles for Intercity Passenger Rail and Urban Transit
Page 7
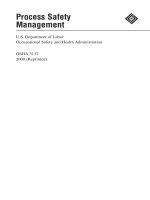
and locomotive builders, and 2) component parts manufacturers (See Figure 1). Several other large
categories of rail jobs lie outside the scope of this study, including infrastructure equipment
manufacture, infrastructure construction, project management, and additional agencies and firms
involved in operation and maintenance of rail systems.
Figure 1. Rail vehicle manufacturing jobs in the broader context of total rail industry jobs
Project management,
finance and leasing firms
Infrastructure construction
firms
Capital side:
Jobs in manufacturing,
construction, and project
management
Rail car and locomotive
builders
Infrastructure equipment
manufacturers
Component parts
manufacturers
EDRG estimate:
24,000 jobs per
$US billion of
capital
investment
1
Operating side:
Jobs in operating public transit
systems and maintaining
vehicles and infrastructure
Rail operating firms
Passenger and transit rail
agencies
Maintenance and
rebuild firms
EDRG estimate:
41,000 jobs per
$US billion of
operating
investment
1
CGGC
focus
1
Estimates by Economic Development Research Group. Jobs are defined as “jobs supported for one year.”
Source: CGGC; job estimates from (Economic Development Research Group, 2009).
U.S. Manufacture of Rail Vehicles for Intercity Passenger Rail and Urban Transit
Page 8
Passenger and transit rail: 6 types
In this report, we address the manufacture of railcars for six types of rail: intercity passenger rail, high-
speed rail, regional rail, metro, light rail, and streetcars. We will describe each of the six rail types in
Tables 2 and 3 below. First, however, it is useful to understand one of the major differences in the
vehicles that characterize each rail type: how it is powered. Each type of rail uses one or more of the
following power options, as shown in Table 1.
Diesel-electric. A diesel engine provides mechanical energy to an electric generator, which provides
power to traction motors that drive each axle. Traction motors, not the engine, drive the wheels. This is
the most common configuration in U.S. intercity passenger rail outside the Northeast Corridor.
Dual mode. The same diesel-electric configuration described above can be complemented by a power
grid connection. This way, on stretches where an overhead wire is available—as in the Northeast
Corridor—the train can shut off its diesel engine and instead power its traction motors directly from the
grid. The dual mode arrangement is not necessary where electrification is widely available, as it is in
Europe and Japan.
All-electric. A continuous connection to the power grid, either via overhead lines or an electrified third
rail, eliminates the need for an engine. This is typical in the urban rail categories (metro, light rail and
streetcars). It is also found in intercity passenger rail in Japan and much of Europe.
Hybrid-electric (prototype stage). Leveraging hybrid systems already in use in hybrid buses, a few firms
are developing rail applications in which a rechargeable battery is added to store surplus energy derived
from the engine and from the wheels during braking. This stored energy can be used to boost available
power when needed.
U.S. Manufacture of Rail Vehicles for Intercity Passenger Rail and Urban Transit
Page 9
Table 1. Passenger rail and urban transit rail: types of power supply
Type of Power Examples
Diesel electric
Nearly all U.S.
intercity passenger
rail except for the
Northeast Corridor
Dual mode
U.S. Northeast
Corridor
All electric
Metros, light rail,
streetcars
Intercity passenger
rail in Japan and
much of Europe
Hybrid-electric (prototype stage)
Under development
by BAE Systems,
General Electric
Source: CGGC.
Key characteristics of each of the six target rail categories are found below, in Table 2 and Table 3.
Intercity passenger rail.
Service links large cities, typically at speeds of 50-110 miles per hour. In the
United States, all intercity passenger rail service is offered by Amtrak, operating on track that is shared
with the freight rail network. U.S. passenger trains are powered chiefly by diesel electric locomotives. In
Europe, right of way is much less frequently shared with freight rail. Most European intercity passenger
U.S. Manufacture of Rail Vehicles for Intercity Passenger Rail and Urban Transit
Page 10
trains are powered by all electric, or in some cases, electro-diesel (diesel-electric configurations
complemented by a connection to the power grid).
High-speed rail (HSR). Service connects cities up to 500 miles apart, with special infrastructure and
railcar designs that allow trains to operate at higher speeds. In the United States, currently the only high-
speed line is the Acela in the Northeast Corridor, which is designed for speeds up to 150 mph, but
because of infrastructure limitations, in fact reaches much lower speeds. Because of long distances
between cities and track shared with freight, the U.S. potential for high-speed rail is different from many
other countries. Electrification (connection to the grid) is so far only available in the Northeast Corridor.
While the U.S. definition of HSR can be as low as 80 mph, the international definition for upgraded
lines is above 124 mph (200 km/hr), and for new lines, above 155 mph (250 km/hr).
Regional rail (commuter rail).
Service is over short distances connecting a city center to surrounding
towns and suburbs. More than 20 regional rail systems now serve 25 major U.S. metropolitan areas.
They often use electric multiple units (EMUs)—self-contained combinations of two or more rail cars
that have their own electric propulsion. EMUs thus can either be added to or dropped from a train at a
given station, according to need. Regional rail can also use diesel multiple units (DMUs), similar to
EMUs but with diesel-electric propulsion. On regional rail lines that are not electrified, DMUs offer the
flexibility to add or drop train cars at stations on a multi-city route, according to occupancy needs.
Metro (rapid transit).
Service is high frequency and for urban, short-distance trips. Trains operate on
exclusive right of way and are designed for many passengers to stand as well as sit. Speeds are typically
less than 80 mph (130 km/hr). Power supply is electric, using electric multiple units.
Light rail (LRT). Service is for busy urban corridors, connecting major destinations such as downtowns,
shopping and campuses. LRT typically uses exclusive right of way, although some systems share streets
with car traffic. Trains usually include 1-4 railcars, carrying up to 220 passengers and traveling up to 66
miles per hour (105 km/hr). LRT mostly uses electric multiple units but can use diesel multiple units.
Streetcars (trolleys).
Service offers frequent stops in a central urban area, often meant to attract “choice”
riders (those who have access to an automobile). Streetcars usually share city streets with car traffic and
are thus less expensive to build and operate than higher-speed and higher-capacity rail systems that
operate on exclusive right of way. Vehicles are lightweight, typically consisting 3-body cars with
capacity of up to 180 passengers. Electricity is most often provided by overhead lines. Unlike other
urban rail types, streetcars are typically ordered by city governments, not by transit authorities—
although streetcars are part of the federal government’s “livable communities” agenda, which qualifies
them for federal funding. Often cities invest in streetcars to enhance economic development in a
downtown. There are three types of streetcar: heritage cars (replicas), retrofitted cars and modern
streetcars (pictured in Table 3).
U.S. Manufacture of Rail Vehicles for Intercity Passenger Rail and Urban Transit
Page 11
Table 2. Passenger rail characteristics: intercity, high-speed rail, and regional rail
Passenger Rail
Category
Typical context Right of Way Capacity Speed Power
Supply
Intercity
passenger rail
(Wilcox, 2008)
Long distance
travel linking large
cities
US: Low frequency
of service
US: Shared
track with
freight
High capacity
for seated
passengers
Comfortable
seating
50 – 110 mph
(80-180 km/hr)
US: Mostly
diesel electric
locomotives
Europe: Mostly
all-electric
High-speed rail
(McCaughrin, 2007)
Connects cities at
short, medium and
long distances up to
500 miles (800 km)
US: Amtrak
Acela shares
track with
freight &
regional rail
Europe & Asia:
Mostly
exclusive right
of way
High capacity
for seated
passengers
US: Acela has
304 seats
Japan:
Shinkansen
double-decker
has 1,634 seats
US: Can be as
low as 80 mph
(130 km/h)
International*
definition:
New lines
above 155 mph
(250 km/hr);
Upgraded lines
above 124 mph
(200 km/hr)
US: In NE
corridor only,
diesel electric
with connection
to the grid
Japan and
Europe: All
electric
Regional rail
(also known as
commuter rail)
Intersystem Concepts, 1999
Short distances
from city center to
surrounding towns
& suburbs
Includes service to
low-density areas
US: More than 20
regional rail
systems now serve
25 major
metropolitan areas
Shares track
with intercity
or freight trains
High seating
capacity
More seating
than standing
room
60 - 185 seats
per car
30 to 125 mph
(50 to 200 km/h)
In Europe,
mostly uses
electric
multiple units;
can use diesel
multiple units
or electric
locomotives
*UIC definition (Union International des Chemins de Fer)
Source: CGGC, based on (Federal Railroad Administration, 2009; Parkinson & Fisher, 1996; TGVweb, 2001; Union
Internationale des Chemins de Fer, 2008; Wikipedia, 2010).
U.S. Manufacture of Rail Vehicles for Intercity Passenger Rail and Urban Transit
Page 12
Table 3. Transit rail characteristics: metro, light rail, and streetcars
Transit Rail
Category
Typical context Right of Way Capacity Speed Power Supply
Metro
(also rail rapid
transit, subway,
underground, or
elevated)
Trevor Hart, 2004
High frequency
urban rail service
High capacity for
short-distance trips
Exclusive right
of way
Designed for
many
passengers to
stand during
short rides
Range 3 - 12
cars per train;
Max. 150
passengers per
train
Less than 80
mph (130 km/hr)
Electric -
electric multiple
units (EMUs)
Light rail
Totsie14, 2005
Service on busy
urban corridors,
connecting major
destinations such as
downtowns,
shopping districts
and campuses
Usually
exclusive right
of way; some
systems share
streets with car
traffic
Typically 1 - 4
train cars; Max.
220 passengers
Train length
60 - 120 meters
Less than 66
mph (105 km/hr)
Usually uses
electric multiple
units; can use
diesel multiple
units
Streetcars
(also known as
trams, trolleys or
on-road light rail)
Doug Beghtel, 2009
Rail service with
frequent stops,
often meant to
attract “choice”
riders (those who
have access to an
automobile) and to
enhance economic
development
Usually share
city streets with
car traffic, but
may have
exclusive right
of way
Lightweight
vehicles with
low capacity;
usually 3-body
cars. Maximum
180 passengers
Less than 43
mph (70 km/hr)
Electric, usually
with catenary
(overhead lines)
Source: CGGC, based on (Parkinson & Fisher, 1996; Smatlak, 2010; Victoria Transport Policy Institute, 2010).
U.S. Manufacture of Rail Vehicles for Intercity Passenger Rail and Urban Transit
Page 13
Global market for passenger and transit rail
vehicles
Rail vehicles, also called rolling stock, are a subset of the global market for rail equipment, accounting
for 30% of total rail equipment by value. Rolling stock is the second largest product segment behind
services (43%)—a category that includes maintenance, spare parts and refurbishment for rail vehicles
and infrastructure. After services, the next largest segments are infrastructure (18% of total value), and
rail control (8%).
6
Rail vehicles for passenger rail and urban rail (as opposed to freight rail) account for
an estimated $19 billion, or about 40% of the global market for rolling stock.
The United States is by far the largest rail equipment market in the world.
7
This is thanks to the nation’s
highly developed freight rail system. In the 1950s, the percentage of U.S. and European freight moved
by rail was about equal (approximately 58 percent). By 2000, the share of U.S. freight transported by
rail was 38 percent, while in Europe it was only 8 percent (Vassallo & Fagan, 2005). As of 2002, the
Americas accounted for roughly one-third of the world’s diesel locomotives and freight wagons (U.S.
PIRG Education Fund, 2010).
A study conducted for UNIFE, the association of the European rail industry, estimated that in 2005-2007
the total global market for rail equipment was $159 billion (see Figure 2). The market considered
“accessible”—meaning open to foreign suppliers—equaled an estimated $111 billion. Looking ahead,
UNIFE projects a 2.0 - 2.5% annual growth rate for the world accessible market between 2007-2016.
According to Global Mass Transit Report, the European rail market is growing below the average, while
Asia has become the world’s fastest growing market (Global Mass Transit Report, 2009).
Figure 2. Global rail equipment market, by region, 2005-2007
Source: CGGC, based on (Roland Berger & UNIFE, 2008)
6
Percentages add up to 99% due to rounding.
7
The next largest single-country markets are China and Russia.
U.S. Manufacture of Rail Vehicles for Intercity Passenger Rail and Urban Transit
Page 14
A handful of companies dominate the global rail vehicle industry. In 2005, the total sales of the three
largest players—Bombardier (Canada), Alstom (France) and Siemens (Germany)—equaled roughly half
of the world’s rail vehicle market (Mellier, 2005). However, the total rail equipment market, including
infrastructure, rail control and services, is changing rapidly as a result of rail expansion in China.
According to one recent analysis, two Chinese companies, China CNR and China South Locomotive and
Rolling Stock Industry Group (CSR), have edged out Siemens to become the third and fourth respective
top rail equipment firms in the world, shifting Siemens to fifth place. Transmashholding (Russia) is now
in sixth place, followed by three U.S. freight rail equipment firms: GE, Trinity Industries, and Electro-
Motive Diesel (EMD). Kawasaki (Japan) occupies the number ten spot (Leenen & Briginshaw, 2009).
Several countries’ increased investments in high-speed rail will continue to have a dramatic effect on the
global rail equipment market. According to China’s rail ministry, China is opening 1,200 miles of high-
speed rail in 2010, with the goal of linking all provincial capitals with bullet trains. Externally, China is
seeking to build high-speed routes in the United States and Brazil, and has already begun construction in
Saudi Arabia, Turkey and Venezuela (Bradsher, 2010).
In the United States, however, the high-speed rail segment is notably small. While the recent
commitment of $8 billion in stimulus funds to HSR is a significant step, it is negligible compared to
plans to develop and expand such systems in Europe and Asia. Because of low levels of investment and
the sharing of track with freight rail, HSR in the United States will involve much lower train speeds than
those found in Europe and Asia.
8
It will also require very different infrastructure as a result of the
nation’s longer distances and lack of electrified lines. For these reasons, the U.S. context will likely
continue to look quite different from that in other countries. HSR development will likely have an early
focus on improving existing infrastructure so that Amtrak’s newer passenger trains can reach speeds
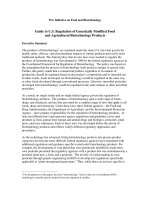
they were designed for (up to 155 mph). As of 2008, the United States had 20 such HSR vehicles, while
Japan had 427, and Europe had 1,050. An international comparison of HSR vehicles and miles of
enabled track is shown in Figure 3.
8
According to the American Association of Railroads (AAR), more than 90 percent of Amtrak service runs on rights-of-way
owned by freight railroads (Association of American Railroads, 2010).
U.S. Manufacture of Rail Vehicles for Intercity Passenger Rail and Urban Transit
Page 15
Figure 3. International comparison of high-speed rail vehicles and enabled track, 2008
Source: (Milmo, 2009).
U.S. Manufacture of Rail Vehicles for Intercity Passenger Rail and Urban Transit
Page 16
U.S. market
The U.S. market for passenger and transit rail is the most open market in the world. While many
countries’ rail vehicle markets include major domestic-owned OEMs (for instance, Alstom in France,
Siemens in Germany, or Talgo in Spain), the U.S. market has had no such players of its own for nearly
three decades. The only exceptions are General Electric, EMD (formerly GM-EMD), and Motive Power
(Wabtec), three makers of freight locomotives that also serve the passenger rail industry. As a result of
the lack of domestic rail car firms, an unusually large number of foreign-owned rail car manufacturers
participate in the U.S. market.
Major players
Table 4 shows 20 firms at the Tier 1 OEM level that serve the U.S. market for at least one of the six rail
types. Several firms are large players active internationally in most or all categories, even if they serve
the U.S. market only in selected ones; these firms include AnsaldoBreda, CAF, Hyundai Rotem,
Kawasaki, Kinkisharyo, Nippon Sharyo, and Siemens. One global firm, Bombardier, supplies the U.S.
market in all types except streetcars. Alstom, another global player with a footprint in all categories,
serves the U.S. market in all the “heavy rail” types (those other than light rail and streetcars).
Seven of the 20 Tier 1 OEMs are U.S. firms. These include the following:
• EMD, GE and Motive Power, each of which make locomotives for intercity and regional rail for
U.S. and non-U.S. markets
• Three vintage streetcar firms: Brookville, a freight rail player that rebuilds streetcars; Kasgro
Rail, a freight rail company that supplies vintage streetcars, and Gomaco, which makes vintage
streetcars
• United Streetcar, a new entrant that makes modern streetcars (discussed in detail on page 46)
• US Railcar Company, a new entrant that plans to make diesel multiple units (DMUs) for regional
rail (discussed in detail on page 47).
U.S. Manufacture of Rail Vehicles for Intercity Passenger Rail and Urban Transit
Page 17
Table 4. Rail car and locomotive OEMs serving the U.S. market, with international footprint
Builder
Intercity
Passenger
Rail
High
Speed Rail
Regional
Rail
Metro
Rail
Light
Rail
Streetcar
Alstom
AnsaldoBreda
Bombardier
Brookville
CAF USA
EMD
a
L
L
Gomaco
GE
L
L
Hyundai Rotem
Inekon Trams
*
Kasgro Rail Corp.
b
Kawasaki
Kinkisharyo
Motive Power
L
L
Nippon Sharyo
Siemens
Skoda
c
Talgo
d
United Streetcar
US Railcar
Firm serves U.S.
railcar
market
L
Firm serves U.S. locomotive
market
Firm serves non-U.S. market
Notes:
a
Between 1976 and 1981, EMD supplied locomotives to Amtrak that are still part of the active fleet.
b
Kasgro Rail Corporation, predominantly a freight rail company, supplied vintage streetcars for Galveston, TX.
c
Skoda Transportation is leasing its streetcar technology to United Streetcar, which is manufacturing streetcars in the United
States. Skoda does not have a U.S. manufacturing/assembly location.
d
Worldwide, Talgo is solely focused on intercity passenger rail with speeds of 79 - 235 mph. Talgo does not yet have a U.S.
manufacturing location; however, the company since 1998 has operated a maintenance facility in Seattle, WA, where it
maintains trains it built for Amtrak. In 2010 Talgo will open a plant in Milwaukee, WI to build high-speed trainsets (see page
49).
Source: CGGC, based on company websites, interviews and news releases. Image source: (Richtom80, 2007).
U.S. Manufacture of Rail Vehicles for Intercity Passenger Rail and Urban Transit
Page 18
Size of market
According to UNIFE estimates, the value of the U.S. rail vehicle market for passenger and transit rail in
2005-2007 was $1.7 billion (UNIFE, 2010). A breakdown of the market is found in Figure 4. Measured
by value, the largest segment was metro, at $798 million, accounting for 47% of the total. Next were
multiple units for regional rail ($500 million), accounting for 30%, and passenger coaches ($273
million), accounting for 16%. Finally, LRT and streetcars ($116 million) accounted for 7% of the total.
New York City constitutes the single largest market, such that the U.S. picture for supply and demand
changes significantly based on whether New York is acquiring new cars or rebuilding existing cars (D.
Bowen, 2010).
Figure 4. U.S. market for passenger and transit rail vehicles, 2005-2007, by type (total
market: $1,687 million )
Metro
$798 M
47%
Regional
multiple units
$500 M
30%
Passenger
coaches
$273 M
16%
LRT/ streetcars
$116 M
7%
Source: UNIFE data for 2005-2007.
An approximate picture of the leading firms’ U.S. market share is shown in Figure 5. These figures are
based on Railway Age Magazine data on the total number of new rail cars produced for regional and
urban transit rail categories during the 4-year period ending in 2010—during which the only intercity
(Amtrak) activity consisted of rebuilding old railcars. Bombardier (Canada) is the largest supplier,
accounting for 28% of the total market for heavy and light rail. Alstom Transport and Kawasaki Railcar
each also account for roughly 20% of the U.S. market. Other market leaders include Hyundai-Rotem
USA, Kinkisharyo International, LLC, and Siemens.
U.S. Manufacture of Rail Vehicles for Intercity Passenger Rail and Urban Transit
Page 19
Figure 5. U.S. market for new railcars for regional, metro, light rail and streetcars
Note: Percentages based on number of new rail cars delivered 2006 - 2009 and undelivered cars in progress as of Jan 1, 2010
Source: Railway Age Magazine data sets from 2007-2010: (D. J. Bowen, 2008; Luczak, 2007; Miller, 2009, 2010)
Table 5 breaks out the U.S. market data for 2006-2009 by rail car type, also highlighting the major role
played by rebuilt rail cars. Measured in number of units, the largest new car market in the period was for
metro cars (2,231 units). Regional/intercity followed (1,583 new units for regional), then light rail (771
units), and streetcars (32 units).
These market share figures show the following:
Regional/intercity. Bombardier is the leading supplier of new regional rail cars with approximately 50%
of the market, followed by Hyundai-Rotem (21%) and Kawasaki (20%). Bombardier’s largest contracts
during the period were for commuter cars serving New Jersey Transit and Long Island Rail Road. The
rebuild market for regional and intercity cars largely consisted of Amtrak rail cars, primarily done by
Amtrak. Bombardier held 11% of this market, more than half of which was work done on behalf of
Amtrak.
Metro
. Two large firms led the market: Alstom Transport (42%) and Kawasaki Rail Car (36%). In a
contract awarded in July 2002, these companies partnered to supply the New York City Transit system
with a total of 1,662 metro cars, the largest mass transit contract in the United States (Alstom Transport,
2008).
9
In the target four-year period, Bombardier held 18% of the market. In rebuilding and
maintenance, Alstom was the only firm active during the period, although a greater number of metro
cars were refurbished in house by the Bay Area Rapid Transit System’s rolling stock shop.
9
Alstom provided 1,002 cars and Kawasaki provided 660 cars (Wochele, 2010).
U.S. Manufacture of Rail Vehicles for Intercity Passenger Rail and Urban Transit
Page 20
Light rail and streetcars. Builders of light rail vehicles account for nearly all of the light rail/streetcar
market, led by Kinkisharyo (43%), Siemens (32%), and AnsaldoBreda (14%). In streetcars, by contrast,
a handful of manufacturers supply fewer than 10 cars each. Several of these streetcar builders are U.S.
companies, including Brookville Equipment Corporation and Kasgro Rail (two predominantly freight
rail firms), and United Streetcar, discussed in detail on page 46. Bombardier and CAF USA lead the
rebuild and maintenance market for light rail vehicles, while Brookville and in-house rebuilds in New
Orleans accounted for most streetcar rebuilds.
U.S. Manufacture of Rail Vehicles for Intercity Passenger Rail and Urban Transit
Page 21
Table 5. U.S. market share by rail car type, 2006-2009
Car Type New Cars Rebuilt Cars
Regional/
Intecity
1,583 units
1,560 units
Metro
2,231 units
799 units
Light Rail
and
Streetcars
803 units
121 units
Note: Based on number of new and rebuilt cars delivered 2006-2009 and undelivered in progress as of Jan 1, 2010
Source: Railway Age Magazine data sets from 2007-2010: (D. J. Bowen, 2008; Luczak, 2007; Miller, 2009, 2010)
U.S. Manufacture of Rail Vehicles for Intercity Passenger Rail and Urban Transit
Page 22
Domestic content requirements
The United States has longstanding legislation on domestic content. Procurements supported by
agencies such as the Department of Defense (DOD), Federal Highway Administration (FHWA), Federal
Railroad Administration (FRA), and Federal Transit Administration (FTA) have each been subject to
such provisions for decades.
In 1978, a “Buy America” provision was added to the federal transportation bill, specifically applying to
procurements funded by grants to state and local agencies through the FTA, FHWA, and FRA. This Buy
America provision states that final assembly of trains, buses, ferries, and other vehicles purchased with
the support of federal funds must occur in the United States. The provision further requires 60%
domestic content; in other words, the cost of components manufactured domestically must represent
more than 60% of the cost of all components. Waivers from these domestic purchasing requirements can
be obtained for the following three reasons (Apollo Alliance, 2010):
1) Preference for the domestic product is “inconsistent with the public interest,” a broad category
that can include impacts on project outcomes or on domestic markets or firms.
2) The product is not available in the United States in sufficient and reasonable quantity or
satisfactory quality.
3) Procuring the product or component domestically would increase project costs by more than
25%.
FTA and FHWA-funded projects also require all steel and manufactured products used in infrastructure
projects to be 100% U.S manufactured, with the same set of permissible waivers. Domestic content
requirements for Amtrak vehicles differ slightly from those that apply to other vehicles purchased with
federal transportation dollars. Amtrak passenger rail purchases costing more than $1 million must
include “substantially” U.S made components, which has previously been interpreted to mean that at
least 51% of components must be domestically sourced. The domestic content requirements that apply
to Amtrak rolling stock also allow for a fourth waiver, if equipment cannot be bought and delivered in
the United states within a reasonable time.
In 2009, ARRA reinforced and expanded existing domestic content rules, specifying that they also apply
to vehicles purchased with ARRA funds. FTA-funded vehicle purchases will continue to follow the
existing Buy America rules described above—requiring final assembly in the United States and 60%
U.S manufactured content. Amtrak rolling stock will continue to be subject to a similar, though
separate set of rules (Foshay, 2010).
U.S. Manufacture of Rail Vehicles for Intercity Passenger Rail and Urban Transit
Page 23
Pent-up demand
The U.S. market appears poised for growth. In urban transit rail, industry analysts forecast growth due to
a combination of pent-up demand for rail service and a backlog of needed capital investment. According
to a recent nationwide analysis of transit agencies’ and municipal planning organizations’ long-range
plans,
10
at least 400 rail, streetcar and bus rapid transit projects are in the planning (see Figure 6). In
total, these projects represent over $248 billion of investment in 76 regions in 37 states, including 10
projects worth over $10 billion. The analysis emphasizes, however, that it remains to be seen how much
of this demand will be satisfied by adequate funding. Constructing all of these projects at the current rate
of federal funding would take an estimated 77 years (Reconnecting America, 2009).
Figure 6. U.S. planned fixed guideway projects, according to local agencies’ long-range plans
Source: (Reconnecting America, 2009)
An important aspect of future investment is the need to bring existing systems into a state of good repair.
In a recent speech, FTA Administrator Peter M. Rogoff noted that the backlog of deferred maintenance
at our seven largest rail operators alone is more that $50 billion. He cited an FTA assessment of all of
the nation’s public transit assets—including rail, bus and paratransit
11
—which found that fully 29
10
Conducted by Reconnecting America, a project of the Center for Transit-oriented Development. Website:
/>
11
Individualized transportation service that supplements larger, fixed-route public transit.
U.S. Manufacture of Rail Vehicles for Intercity Passenger Rail and Urban Transit
Page 24
percent are in poor or marginal condition. The investments needed to bring all of these 690 separate rail
and bus systems to a state of good repair is an estimated $78 billion (Rogoff, 2010).
Similarly, the U.S. intercity passenger rail system is in need of investments that have long been
postponed. Amtrak, because of funding constraints, has not ordered new rolling stock since 2001. The
average age of Amtrak rolling stock is 25 years, and the fleet includes some railcars that are 60 years
old—older than Amtrak itself, because they were purchased used (Uznanski, 2010). Amtrak calculates
that, in the next 14 years, it will need to buy 1,200 railcars, 334 locomotives, and 25 high-speed
trainsets
12
(see Figure 7). This represents a total investment of $11 billion in 2009 dollars (Amtrak,
2010). More broadly, a 2007 report commissioned by the National Surface Transportation Policy and
Revenue Study Commission found that to re-establish the national intercity passenger rail network
would require capital investments of an estimated $8.1 billion annually through 2050 (Passenger Rail
Working Group, 2007).
Figure 7. Projected Amtrak new rail vehicle needs, 2010-2023 (number of units, by type)
Source: Data from Amtrak Fleet Strategy (Amtrak, 2010)
12
Indivisible blocks of railcars.