Authors libby rittenberg 479
Bạn đang xem bản rút gọn của tài liệu. Xem và tải ngay bản đầy đủ của tài liệu tại đây (401.03 KB, 1 trang )
firm, MR=P=AR . The marginal revenue curve has another meaning as well.
It is the demand curve facing a perfectly competitive firm.
Consider the case of a single radish producer, Tony Gortari. We assume
that the radish market is perfectly competitive; Mr. Gortari runs a perfectly
competitive firm. Suppose the market price of radishes is $0.40 per pound.
How many pounds of radishes can Mr. Gortari sell at this price? The
answer comes from our assumption that he is a price taker: He can
sell any quantity he wishes at this price. How many pounds of radishes will
he sell if he charges a price that exceeds the market price? None. His
radishes are identical to those of every other firm in the market, and
everyone in the market has complete information. That means the demand
curve facing Mr. Gortari is a horizontal line at the market price as
illustrated in Figure 9.5 "Price, Marginal Revenue, and Demand". Notice
that the curve is labeled d to distinguish it from the market demand
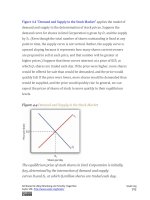
curve, D, inFigure 9.3 "The Market for Radishes". The horizontal line
in Figure 9.5 "Price, Marginal Revenue, and Demand" is also Mr. Gortari’s
marginal revenue curve, MR, and his average revenue curve,AR. It is also
the market price, P.
Of course, Mr. Gortari could charge a price below the market price, but
why would he? We assume he can sell all the radishes he wants at the
market price; there would be no reason to charge a lower price. Mr. Gortari
faces a demand curve that is a horizontal line at the market price. In our
subsequent analysis, we shall refer to the horizontal line at the market
price simply as marginal revenue. We should remember, however, that this
same line gives us the market price, average revenue, and the demand
curve facing the firm.
Attributed to Libby Rittenberg and Timothy Tregarthen
Saylor URL: />
Saylor.org
479
