Authors libby rittenberg 127
Bạn đang xem bản rút gọn của tài liệu. Xem và tải ngay bản đầy đủ của tài liệu tại đây (382.15 KB, 1 trang )
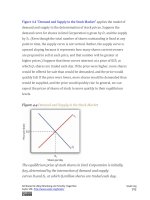
Figure 3.2 An Increase in Demand
An increase in the quantity of a good or service demanded at each price
is shown as an increase in demand. Here, the original demand
curve D1 shifts to D2. Point A on D1 corresponds to a price of $6 per
pound and a quantity demanded of 25 million pounds of coffee per
month. On the new demand curve D2, the quantity demanded at this
price rises to 35 million pounds of coffee per month (point A′).
Just as demand can increase, it can decrease. In the case of coffee, demand
might fall as a result of events such as a reduction in population, a
reduction in the price of tea, or a change in preferences. For example, a
definitive finding that the caffeine in coffee contributes to heart disease,
which is currently being debated in the scientific community, could change
preferences and reduce the demand for coffee.
A reduction in the demand for coffee is illustrated in Figure 3.3 "A
Reduction in Demand". The demand schedule shows that less coffee is
demanded at each price than in Figure 3.1 "A Demand Schedule and a
Attributed to Libby Rittenberg and Timothy Tregarthen
Saylor URL: />
Saylor.org
127
