Authors libby rittenberg 123
Bạn đang xem bản rút gọn của tài liệu. Xem và tải ngay bản đầy đủ của tài liệu tại đây (368.8 KB, 1 trang )
population of the town, were to change. That is why we add the qualifier
that other things have not changed to the definition of quantity demanded.
A demand schedule is a table that shows the quantities of a good or service
demanded at different prices during a particular period, all other things
unchanged. To introduce the concept of a demand schedule, let us consider
the demand for coffee in the United States. We will ignore differences
among types of coffee beans and roasts, and speak simply of coffee. The
table in Figure 3.1 "A Demand Schedule and a Demand Curve" shows
quantities of coffee that will be demanded each month at prices ranging
from $9 to $4 per pound; the table is a demand schedule. We see that the
higher the price, the lower the quantity demanded.
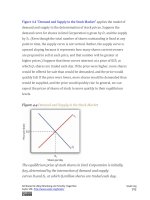
Figure 3.1 A Demand Schedule and a Demand Curve
The table is a demand schedule; it shows quantities of coffee demanded
per month in the United States at particular prices, all other things
unchanged. These data are then plotted on the demand curve. At point
A on the curve, 25 million pounds of coffee per month are demanded at
Attributed to Libby Rittenberg and Timothy Tregarthen
Saylor URL: />
Saylor.org
123
