Authors libby rittenberg 117
Bạn đang xem bản rút gọn của tài liệu. Xem và tải ngay bản đầy đủ của tài liệu tại đây (428.23 KB, 1 trang )
1. Putting capital goods per period on the horizontal axis and
consumer goods per period on the vertical axis, graph the
production possibilities curve for the economy.
2. If the economy is producing at alternative B, what is the
opportunity cost to it of producing at alternative C instead?
3. If the economy is producing at alternative C, what is the
opportunity cost to it of producing at alternative D instead?
4. Is it possible for this economy to produce 30 units of
consumer goods per period while producing 1 unit of
capital goods? Would this combination of goods represent
efficient or inefficient production? Explain.
5. Which point, B or C, would lead to higher economic
growth? Explain your answer.
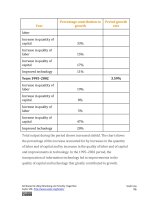
7. The exhibit below shows the sources of growth in the United
States between 1909 and 1929 and between 1950 and 1979,
according to a study by Edward Denison. [1] (Note: The sources
of economic growth are cumulative and, taken collectively,
explain 100% of total growth over the period.)
Attributed to Libby Rittenberg and Timothy Tregarthen
Saylor URL: />
Saylor.org
117
