Authors libby rittenberg 446
Bạn đang xem bản rút gọn của tài liệu. Xem và tải ngay bản đầy đủ của tài liệu tại đây (400.48 KB, 1 trang )
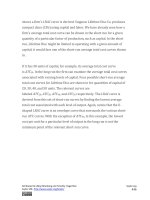
shows a firm’s LRAC curve is derived. Suppose Lifetime Disc Co. produces
compact discs (CDs) using capital and labor. We have already seen how a
firm’s average total cost curve can be drawn in the short run for a given
quantity of a particular factor of production, such as capital. In the short
run, Lifetime Disc might be limited to operating with a given amount of
capital; it would face one of the short-run average total cost curves shown
in .
If it has 30 units of capital, for example, its average total cost curve
is ATC30. In the long run the firm can examine the average total cost curves
associated with varying levels of capital. Four possible short-run average
total cost curves for Lifetime Disc are shown in for quantities of capital of
20, 30, 40, and 50 units. The relevant curves are
labeled ATC20, ATC30, ATC40, and ATC50 respectively. The LRAC curve is
derived from this set of short-run curves by finding the lowest average
total cost associated with each level of output. Again, notice that the Ushaped LRAC curve is an envelope curve that surrounds the various shortrun ATC curves. With the exception of ATC40, in this example, the lowest
cost per unit for a particular level of output in the long run is not the
minimum point of the relevant short-run curve.
Attributed to Libby Rittenberg and Timothy Tregarthen
Saylor URL: />
Saylor.org
446
