Social impact, business benefits, and investor returns pdf
Bạn đang xem bản rút gọn của tài liệu. Xem và tải ngay bản đầy đủ của tài liệu tại đây (1.23 MB, 118 trang )
Social impact, business benefits, and investor returns
by Terence Lim, Ph.D.
CorporatePhilanthropy.org
“A great reference tool for those of us in the field. It will
spur dialogue in the industry about the future of corporate
philanthropy investments.”
— Caroline Roan, Vice President of Corporate Responsibility, Pfizer Inc
“This report should be required reading about the practice
of corporate philanthropy.”
— Michael Bzdak, Director of Corporate Contributions,
Johnson & Johnson
“A thorough, well-crafted, and thought-provoking overview —
essential reading on the topic.”
— Ray Fisman, Lambert Family Professor of Social Enterprise,
Columbia Business School
“This is perhaps the most comprehensive study of corporate
philanthropy that I have seen.”
— Christopher Marquis, Assistant Professor of Business Administration,
Harvard Business School and HBS Social Enterprise Initiative
This publication was printed with soy-based ink on 10% post-consumer waste
paper fiber, made with wind-generated electricity by a Forest Stewardship Council
certified printer.
E
About CECP
The Committee Encouraging Corporate Philanthropy (CECP) is the only
international network of CEOs and chairpersons actively working to effect
positive change through corporate giving. Its mission is to lead the business
community in raising the level and quality of corporate social engagement.
CECP’s 170 members include CEOs and chairpersons of the world’s largest
and most well-regarded corporations from a diverse and broad range of
industry sectors. For more information, visit CorporatePhilanthropy.org.
CECP welcomes your feedback on this report. Contact information:
Committee Encouraging Corporate Philanthropy
110 Wall Street, Suite 2-1
New York, NY 10005
212.825.1000
ISBN: 978-0-615-34109-5
© 2010, Committee Encouraging Corporate Philanthropy
MEASURING THE VALUE OF
CORPORATE PHILANTHROPY:
SOCIAL IMPACT, BUSINESS BENEFITS,
AND INVESTOR RETURNS
by
Terence Lim, Ph.D.
Preface
H
ow to measure the value and results of corporate philanthropy remains
one of corporate giving professionals’ greatest challenges. Social and
business benefits are often long-term or intangible, which make
systematic measurement complex. And yet: Corporate philanthropy faces
increasing pressures to show it is as strategic, cost-effective, and value-enhancing
as possible. The industry faces a critical need to assess current practices and
measurement trends, clarify the demands practitioners face for impact evidence,
and identify the most promising steps forward in order to make progress on these
challenges.
This report aims to meet that need, by providing the corporate
philanthropic community with a review of recent measurement studies, models,
and evidence drawn from complementary business disciplines as well as the social
sector. Rather than present another compendium of narrative accounts and case
studies, we endeavor to generalize the most valuable concepts and to recognize
the strengths and limitations of various measurement approaches. In conjunction
with the annotated references that follow, the analysis herein should provide an
excellent starting point for companies wishing to adapt current methodologies in
the field to their own corporate giving programs.
To realize meaningful benefits, philanthropy cannot be treated as just
another “check in the box,” but rather must be executed no less professionally,
proactively, and strategically than other core business activities. Our hope is
that this work will enlighten giving professionals, CEOs, and the investor
community to the many mechanisms by which philanthropic investments can
be measured and managed to achieve long-term business value and meet
critical societal needs.
Terence Lim, Ph.D.
Report Author and Manager, Standards and Measurement
Committee Encouraging Corporate Philanthropy
(through the 2008–2009 Goldman Sachs Public Service Program)
TABLE OF CONTENTS
Introduction . . . . . . . . . . . . . . . . . . . . . . . . . . . . . . . . . . . . . . . . . . . . . . . . . . . . . . . . . . . 1
CONVERSATION ONE.
Between grant recipients and the Chief Giving Officer (CGO) . . . . . . . . . . . . . . . . . . . . 4
Question 1. How to assess whether grantees are achieving intended results? . . . . . 5
Impact evaluation. . . . . . . . . . . . . . . . . . . . . . . . . . . . . . . . . . . . . . . . . . . . . . . . . 11
Outcomes measurement . . . . . . . . . . . . . . . . . . . . . . . . . . . . . . . . . . . . . . . . . . . 12
Assessing impact-achievement potential . . . . . . . . . . . . . . . . . . . . . . . . . . . . . . . 15
Summary. . . . . . . . . . . . . . . . . . . . . . . . . . . . . . . . . . . . . . . . . . . . . . . . . . . . . . . 17
Question 2. How to measure the return on social investment from grants? . . . . . 18
Cost-effectiveness analysis . . . . . . . . . . . . . . . . . . . . . . . . . . . . . . . . . . . . . . . . . . 19
Cost-benefit analysis . . . . . . . . . . . . . . . . . . . . . . . . . . . . . . . . . . . . . . . . . . . . . . 21
Estimating leverage effects . . . . . . . . . . . . . . . . . . . . . . . . . . . . . . . . . . . . . . . . . 24
Summary . . . . . . . . . . . . . . . . . . . . . . . . . . . . . . . . . . . . . . . . . . . . . . . . . . . . . . 26
CONVERSATION TWO.
Between the Chief Giving Officer (CGO) and the Chief Executive Officer (CEO) . . . . 28
Question 3. How to measure business benefits and make a business case? . . . . . . 28
Employee engagement . . . . . . . . . . . . . . . . . . . . . . . . . . . . . . . . . . . . . . . . . . . . 29
Customer loyalty. . . . . . . . . . . . . . . . . . . . . . . . . . . . . . . . . . . . . . . . . . . . . . . . . 37
Managing reputational risk. . . . . . . . . . . . . . . . . . . . . . . . . . . . . . . . . . . . . 42
Innovation and growth opportunities . . . . . . . . . . . . . . . . . . . . . . . . . . . . . . . . 46
Summary . . . . . . . . . . . . . . . . . . . . . . . . . . . . . . . . . . . . . . . . . . . . . . . . . . . . . . 50
CONVERSATION THREE.
Between the Chief Executive Officer (CEO) and the investor community . . . . . . . . . . . 52
Question 4. How to measure the value of corporate philanthropy
for traditional investors? . . . . . . . . . . . . . . . . . . . . . . . . . . . . . . . . . . . 52
Empirical evidence on share-price valuations and profitability . . . . . . . . . . . . . 53
Summary . . . . . . . . . . . . . . . . . . . . . . . . . . . . . . . . . . . . . . . . . . . . . . . . . . . . . . 55
Question 5. How to attract responsible investors?. . . . . . . . . . . . . . . . . . . . . . . . . 56
Effect on cost of capital and share prices. . . . . . . . . . . . . . . . . . . . . . . . . . . . . . 56
Mainstream responsible investing . . . . . . . . . . . . . . . . . . . . . . . . . . . . . . . . 58
Summary . . . . . . . . . . . . . . . . . . . . . . . . . . . . . . . . . . . . . . . . . . . . . . . . . . . . . . 62
Conclusion . . . . . . . . . . . . . . . . . . . . . . . . . . . . . . . . . . . . . . . . . . . . . . . . . . . . . . . . . . 64
Appendices
A. Glossary . . . . . . . . . . . . . . . . . . . . . . . . . . . . . . . . . . . . . . . . . . . . . . . . . . . . . . . . . . 67
B. References . . . . . . . . . . . . . . . . . . . . . . . . . . . . . . . . . . . . . . . . . . . . . . . . . . . . . . . . 75
C. Annotated bibliography and classification scheme. . . . . . . . . . . . . . . . . . . . . . . . . . 81
D. Acknowledgements . . . . . . . . . . . . . . . . . . . . . . . . . . . . . . . . . . . . . . . . . . . . . . . . . 110
1
Introduction
C
orporate philanthropy is as vital as ever to business and society, but it
faces steep pressures to demonstrate that it is also cost-effective and
aligned with corporate needs.
1
Indeed, many corporate giving
professionals cite measurement as their primary management challenge.
2
Social
and business benefits are often long-term, intangible, or both, and a systematic
measurement of these results can be complex. Social change takes time. The
missions and intervention strategies involved are diverse. For these reasons, the
field of corporate philanthropy has been unable to determine a shared definition
or method of measurement for social impact. Similarly, the financial value of
enhancing intangibles such as a company’s reputational and human capital
cannot be measured directly and may not be converted into tangible, bottom-line
profits in the near term. Corporate givers and grant recipients often use less
formal, anecdotal methods to convey impact. While stories may vitalize and
publicize a program’s successes, it is more systematic measurement that brings
rigor and discipline to the field. Data-based evidence quantifies the positive effects
of corporate philanthropy, thus making a more persuasive case for why
companies should engage in philanthropic causes.
If corporate philanthropy is to make progress in meeting these challenges,
the industry must meaningfully assess current practices and measurement trends,
clarify precisely what is needed in terms of impact evidence, and then identify the
most promising and practical steps forward. This report is designed to aid that
critical agenda.
Interviews with senior corporate management and giving professionals
revealed a set of common questions they often face. These questions fall naturally
into a hierarchy of three conversations:
CONVERSATION ONE. Between grant recipients and their corporate
funder’s Chief Giving Officer (CGO). The funder wants to know:
• How to assess whether grantees are achieving the intended results, and
• How to estimate a “return on investment” (ROI) numeric for comparing
and/or aggregating the effectiveness across different grants in achieving
social results.
CONVERSATION TWO. Between the CGO and Chief Executive
Officer (CEO).
• When pressing the CEO for significant commitment to philanthropic
programs, the CGO is often asked to articulate a “business case” and
demonstrate how supporting the philanthropic initiative will be valuable
to business.
CONVERSATION THREE. Between the CEO and the investor community.
• Investors want assurance that spending on corporate philanthropy enhances
(or at least does not diminish) shareholder value.
• Concurrently, a growing number of investors ask that the companies in which
they invest demonstrate greater philanthropic leadership and
social responsibility.
Indeed, investors increasingly esteem companies that demonstrate strong
social performance, believing that this represents management quality and
valuable intangibles. The ability to attract a large base of investors lowers costs of
capital and raises share-price valuations, which in turn should incentivize
companies to cultivate sustainable philanthropic programs that meet society’s
critical needs.
The question is: How? Advanced by sophisticated private foundations and
governmental agencies, a wide range of impact-assessment methodologies
already exists in the social sector. This report examines how some of these
methodologies may be applied to the specific needs and motivations of corporate
givers, programs, and grants. A wide review of academic and industry literature
on the link between corporate social performance and financial performance
reinforces the idea that philanthropic initiatives create long-term financial value
by enhancing a company’s employee engagement, customer loyalty, reputational
capital, and market opportunities. But these benefits accrue as intangible assets
rather than as short-term cash flows and thus are more complex to measure;
moreover, the mechanisms involved have not yet been well-researched and
understood. Consequently, some companies pay little attention to assessing
philanthropy’s financial returns; their engagement is primarily motivated by
wanting to meet community obligations and “do the right thing.”
3
By analyzing
complementary disciplines such as human resources, marketing, risk
Introduction
2
Introduction3
management, and capital budgeting, corporate philanthropy can improve its
measurement methods and identify long-term financial benefits.
The next three parts of this report present in greater detail the
conversations summarized above, along with our analyses thereof. The last
section presents conclusions as well as recommendations for how industry
members might best proceed. An extensive glossary, references, and annotated
bibliography follow.
1 See The Future of Corporate Philanthropy (Business Week, 2008, December 8).
2 A survey of 77 multinational companies conducted by The Conference Board (2006) found that more than
one-third of responding companies cite measuring results and outcomes as the biggest challenge they will face
in managing their corporate contributions programs.
3 Center on Philanthropy at Indiana University (2007), p. 22.
4
CONVERSATION ONE.
Between grant recipients and the
Chief Giving Officer (CGO)
T
he nonprofit sector employs a broad range of frameworks, tools, and
methodologies to measure the social impact of programs and grants.
4
Many of these approaches have evolved through application by
sophisticated private foundations and government agencies, reflecting these
organizations’ own unique preferences, priorities, and social values. Companies
are encouraged to assess whether these approaches can be applied to corporate
giving programs.
Corporate givers generally demonstrate two types of philanthropic
motivation.
5
The first is a response to community obligations and may
characterize an employee- or community-directed grant or volunteer program
not necessarily aligned with any strategic giving objective. The second
motivation seeks to define and differentiate the company through large, visible
signature programs that tackle critical issues, perhaps even on a global scale.
These programs typically involve the approval and engagement of senior
executives, multi-year partnerships with nonprofit organizations, and (in addition
to cash) non-cash contributions such as in-kind products and access to company
expertise, training, and connections. When evaluating grant requests or designing
signature programs, corporate funders seek to engage nonprofit partners in
developing more systematic ways to assess whether the intended results are
being achieved and how effectiveness across multiple grants can be aggregated
and compared.
Conversation between grantees and CGO5
Financial statements are expressed in
common and objective monetary units, but
social results are much more varied,
subjective, and abstract. A review of
measurement methodologies did not turn
up a “silver bullet” or single numeric
against which performance can be
universally gauged. Rather, this reading
reinforced the notion that, to an extent,
measurement is its own reward. It encourages improvement, management, and
the explicit formulation of assumptions and expectations. Measurement should
be viewed as a process whereby the greatest value is achieved through
organizations building up and learning from data and evidence over time.
Question 1.
How to assess whether grantees
are achieving intended results?
The most basic forms of performance metrics comprise two categories. These are
“activities,” such as the number of staff trained or amount of goods purchased,
and “outputs,” such as the number of clients served, products distributed, and
areas reached. With respect to giving programs comprising primarily short-term,
one-off grants driven by community obligations, simply identifying activities and
measuring output may be all that is feasible.
However, output and activity metrics alone cannot indicate that positive
societal changes are being achieved or if unintended harm is being caused. In the
case of program initiatives such as signature projects, companies share a strong
connection with the cause and are concerned about the social outcomes of their
efforts. Managers of these programs and their nonprofit partners must articulate
the process by which changes and results are expected to occur. They should
outline clearly how success is defined and track whether and how the programs
are affecting their beneficiaries.
Jeffrey Brach, Thomas Tierney, and Nan Stone (2008) of The Bridgespan
Group address how nonprofit organizations can meet the mounting pressures
they face from funders to demonstrate the effectiveness of their programs. They
Measurement should be
viewed as a process
whereby the greatest
value is achieved through
organizations building up
and learning from data
and evidence over time.
Assessing grantee results
6
recount cases of several successful nonprofits’ “journey from aspirations to
impact” and suggest that nonprofit and program leaders rigorously answer the
following interdependent questions:
1. What are the results for which we will hold ourselves accountable?
2. How will we achieve them?
3. What will they really cost?
4. How do we build the organization we need to deliver these results?
The classic article by John Sawhill and David Williamson (2001) of The
Nature Conservancy provides another constructive account of the journey of a
nonprofit organization toward developing its model for assessing mission success.
For decades, The Nature Conservancy had measured advancement toward its
goal—conserving biodiversity by protecting the land and water that rare species
need to survive—by adding up the value of all charitable donations received and
land acreage acquired. These indicators, known as “bucks and acres,” “enjoyed
strong organizational support, and quite frankly, made us look good,” according
to Sawhill and Williamson, but there lurked a nagging question as to whether
these input and output metrics represented actual progress. The Conservancy
decided then to develop a new measurement system, the centerpiece of which
was a list of 98 leading indicators of state program performance. However,
when the Conservancy tried to implement a pilot test, it collapsed under its own
weight. Field staff and managers complained about the laborious record-keeping
and glut of information; moreover, they had no way of judging which measures
were most important and felt that the system was biased against smaller,
resource-poor programs.
Lessons the Conservancy took away from this experience include:
1. Links among the mission, programs, and measures must be clearly defined
and articulated in order to narrow the number of required indicators.
2. The measures should be easily collectible and communicable.
3. The measures should be strategically designed and applicable across the
organization at all levels, while also encouraging of operating units to
focus on high-level strategies.
4. Above all, the measures must address progress toward the mission and
illustrate whether and how the organization’s actions make a difference.
Conversation between grantees and CGO7
The Conservancy settled on two impact measures that it believed could
serve as surrogates for mission success: biodiversity health and threat abatement.
The first was straightforward and could be assessed through regular evaluation of
the organisms the Conservancy was trying to protect, using existing scientific
surveys as a point of comparison. The second measure, which had to account for
the inconsistent nature of biodiversity health and threats, assessed the extent to
which the Conservancy identified and devised strategies to abate critical threats
at each site.
Grantees, nonprofit partners, and corporate philanthropic programs are
more likely to be successful if they address these questions at the outset.
Developing a theory of change and explaining how the program will achieve its
intended impact are critical components of this preparatory work.
To consider a specific example: The use of bednets helps reduce the
transmission of malaria in endemic communities—and Figure 1 illustrates a
theory of change (often also called a “logic model”) for bednet distribution
programs commonly applied in malaria-prevention work.
Figure 1: Logic Model of Bednet-Distribution Program for Malaria Prevention
Source: Adapted from McLaughlin C., Levy, J., Noonan, K., & Rosqueta, K. (February 2009).
To further clarify the language of
measurement: “outcomes” are those
benefits or changes realized as a direct
result of a program’s activities and other
outputs while “impact” refers to long-term
results and ultimate social value. Ideally,
one could measure along the entire chain of results, from initial activities through
intermediate outcomes to final impact, and prove that the program directly
resulted in the changes observed.
In practice, however, the rigorous evaluation of impact is complicated
twofold. First, it often takes a long time before final impact can be observed and
this involves a lengthy measurement process. Second, one must establish
statistically validated causality between services and observed impact in order to
prove without doubt that the program in question is responsible. To gauge a
grant’s success, corporate funders may use other assessment approaches that may
be less precise but more timely and practical. Ranked from most-to-least precise,
common measurement approaches can be grouped into three categories:
1. Formal impact evaluations. Commissioning formal program studies is
often the only way to measure and prove the impact arising from a grant.
Many such impact studies are expensive and rigid, requiring significant data
and a control group (i.e., of participants who do not receive the program’s
treatments) to be statistically reliable.
2. Outcomes-measurement systems. Measuring intermediate outcome
metrics may be a practical alternative to formal impact evaluations.
Monitoring near-term outcomes can identify opportunities for mid-stream
improvements. Applying the models and results of other, already-existing
studies can project impact. Definitive causation and attribution are not
formally proved, but evidence from other similar treatments may be sufficient
to establish that a reasonable link exists between the measured outcomes and
ultimate impact.
3. Assessment of the organization’s impact-achievement potential. With
respect to some grants, corporate funders may choose not to be involved in the
design or management of the program or measurement process, relying instead
entirely on the grantee organization’s own metrics, data, and standards. In the
social sector, evaluation experts have proposed standardized criteria for assessing
Assessing grantee results
8
Monitoring near-term
outcomes can identify
opportunities for mid-
stream improvements.
Conversation between grantees and CGO9
Figure 2: Characteristics of Three Measurement Approaches
Measurement Approach
F
ormal Impact Outcomes Measurement Impact-Achievement
Evaluation Potential Assessment
W
hat
outcome
m
etrics are
m
easured?
O
utcome and/or output
metrics, which rely upon
t
he grantee organization’s
o
wn theory of change
and measurement
standards (funder
a
ssesses the
organization’s potential
to achieve impact
according to its claims).
I
ntermediate outcomes.Long-term impact as well
as intermediate
o
utcomes.
How are
outcome
metrics
designed
and tracked?
Self-reported by grantee
organization.
The corporate funder
participates in designing
the program and its
measurement process,
partnering with grantee
organizations. Domain-
area experts may be
consulted. Data is
collected and analyzed in-
house by the grantee with
the corporate partner’s
technological and/or
management assistance.
Draws from knowledge
and experience of
third-party domain-area
experts engaged to
collect (and/or supervise
the collection of) data
and then to conduct
evaluation analysis.
How is
impact
measured?
Estimates or actual
measures of impact may
be available from
grantee’s measurement
process.
May be estimated by
applying a model based
on assumptions or other
evidence about the
expected effectiveness of
the intervention.
Long-term impact results
are measured and
attributed.
To which
programs
should the
approach
be applied?
1. Start-up programs in
their early stages of
maturity and stability.
2. Programs wherein the
funder is not involved in
the program’s design or
management.
1. Programs wherein the
funder is involved in the
program’s design and
management and shares
responsibility for its
success.
2. Programs wherein
funders and grantees
desire frequent and early
indicators in order to
make real-time
adjustments to
interventions and
strategy.
1. Reasonably mature
programs that represent
an innovative solution
and wherein the funder
and/or grantee seeks to
prove to other funders or
NGOs that it should be
scaled-up.
2. Programs wherein the
cost and risk of failure is
high (e.g., those with
highly vulnerable
beneficiaries).
What serves
as the
counter-
factual
comparison?
(i.e., evidence
of what
would occur
if not for the
program)
Grantee organization’s
own research may
provide comparable
measures and
demographics from
external publications to
proxy as benchmarks.
Externally collected
national or regional
datasets can be used to
calculate comparison
benchmarks with similar
characteristics as the
target groups.
Typically, a comparison
group is tracked, often
using rigorous
experimental design
techniques such as
Randomized Control
Trials (RCTs).
an organization’s potential for achieving measurable and improvable impact.
Such assessment can increase confidence among funders that a nonprofit is
effecting positive change according to its claims. High-performing characteristics
include capable leadership, clear objectives, diligent quality-data collection and
analysis, and the informed adjustment of processes to improve.
Choosing which approach or combination of approaches to adopt depends
partly on how much confidence funders require in measurement precision and
data quality:
• The rigor of formal evaluation places the greatest demand on the quality of
underlying data. It also requires the most time. If grantmakers need to make
timely decisions, it may be more practical to choose and measure a proximate set
of nearer-term outcome indicators believed to be predictors of ultimate impact.
• Programs that are not yet mature or stable may not be ready for formal
evaluation, as their theory and implementation are still evolving. In evaluations,
treatments cannot be changed without invalidating the test, while control group
participants cannot receive the program’s services.
• Other evidence, such as the social science literature, may already prove that
similar types of interventions work well in certain contexts. Regarding programs
designed largely around evidence-based processes, outcomes measurement and/
or impact-potential assessment can reasonably demonstrate that they are on track.
• Existing national and regional datasets can be identified to construct reasonable
comparison benchmarks in lieu of formal control groups. (For example, an
extensive collection of regional and worldwide statistics on the prevalence of
obesity by age, gender, ethnicity, and other population characteristics already
exists—and therefore can inform an assessment of programs addressing the
obesity issue.)
• For programs wherein the corporate funder is actively involved in design and
management, it is worthwhile to implement outcomes-measurement systems or
conduct a formal impact-evaluation study when the program becomes more
mature.
• If the risk and costs of failure are high, such as when beneficiaries are very
vulnerable and the program untested, a formal evaluation may make sense to
ensure the program is not causing unintended harm.
Assessing grantee results 10
• When a program is innovative and stable and the funder is seeking to attract
other funders or Non-Governmental Organizations (NGOs) in order to
replicate or expand it, it may be time to generate independent proof and
attribution, as well as to measure the program’s broader effects through formal
evaluation.
Figure 3 suggests a decision-making map whereby program managers may
choose the best measurement approach for them. Here, the choice can be seen as
depending on the motivation for giving and on the confidence needed in the
precision of results and quality of data.
Conversation between grantees and CGO11
Figure 3: Measurement Approaches and Motivation for Grant
Impact evaluation
Formal impact evaluations seek to measure evaluation points along the result
chain and prove whether the program under review has been effectual.
Independent evaluators who possess domain and analytical expertise are usually
engaged, as they bring unbiased knowledge and credibility to the analysis. An
evaluator designs the methodology for gathering and analyzing data, taking into
consideration factors such as sample sizes, potential biases, and how to establish a
control group. Once implemented, the program collects data until a sufficient
sample size has accumulated. Then, sophisticated statistical tools analyze the data
for evidence of attribution. Finally, an evaluation report is drawn up and
presented to stakeholders. The detailed quantitative analysis contained therein is
designed to satisfy a high burden of statistical proof: proof of positive impact in
the treatment group and that is not found in the control group.
Because formal evaluations employ the highest level of precision and rigor—
as well as the engagement of a credible, external evaluator—they can be
relatively lengthy, costly, and/or complex. Planning and budgeting in advance is
imperative. At the same time, formal evaluations are inherently retrospective, to
an extent; after all, results cannot be reasonably anticipated until a program is
underway and often not confirmed until completion or long thereafter.
Evaluations can be disagreeably rigid in many situations because there is little
room, if any, for mid-course methodology adjustment—which could invalidate
the data already collected.
6
Formal evaluations remain a staple of the social sector when program
effectiveness must be demonstrated meticulously. Requiring program stability and
a high quality of data, formal evaluations are more suited to mature programs.
Funders and grantees should discuss at the outset whether the evaluation’s
potential benefits will justify the expenditure of resources involved. Programs that
strategically and innovatively address a social issue are good candidates for
independent evaluations because the evaluation can prove attribution and
credibly demonstrate to additional funders or NGOs that the programs are worth
replicating or expanding. Also good candidates are programs whose cost and risk
of failure are high, such as when the targeted beneficiaries are extremely
vulnerable. In such cases, “negative” results that discourage continuing the
program are of equal or even greater informational value than “positive” ones.
Assessing grantee results 12
Outcomes measurement
Outcomes-measurement approaches track intermediate changes that are linked
to ultimate impact. One example of the social sector’s progress with this
approach is United Way of America, which emphasizes the importance of
outcomes and provides its own local chapters with advice summarized in a
guidebook entitled Measuring Program Outcomes: A Practical Approach and Focusing on
Outcome. Another approach has been jointly developed by The Urban Institute
and The Center for What Works (December 2006) to assist nonprofit
organizations in developing new outcomes-monitoring processes and/or
improving their existing systems. This approach consists of a general framework
for identifying common outcome indicators and sector-specific metrics applicable
to fourteen program areas.
Although outcomes measurement encourages a focus on results, this
approach alone cannot declare definitively whether a program is actually
effecting change. Outcomes measurement may involve before-and-after
measurement techniques, but not the randomized designs or control groups
needed as counterfactual comparisons for formal proofs. Still, whether the
program is achieving its intended results can be determined, to an extent,
according to the following logic:
1. Existing national and regional datasets can serve as reasonable comparison
benchmarks.
2. Related evaluation studies or social science research offer corroborating
evidence.
3. There already exists a considerable amount of confidence in the quality of the
program’s theory of change.
4. The measured data align with judgments suggested by close knowledge of the
grantee and interactions with the program’s beneficiaries.
Outcomes measurement may generate information on a quarterly or more
frequent basis, thus providing funders and grantees with almost real-time
information about the project’s progress. Used as part of performance
management, this approach allows grantees to make mid-stream improvements to
their intervention based on the latest data. Often, results are managed in a kind
of “dashboard,” e.g., an array of charts depicting the project’s performance
Conversation between grantees and CGO13
according to a variety of metrics, over time
and relative to targets. Giving even more
structure to the process, some performance-
management systems integrate quality-
control concepts already established by
business management: these include the
“Balanced Scorecard”
7
and “Six Sigma”
8
principles. Corporate givers are especially
apt to assist nonprofits in outcomes
measurement because they can draw on
company-wide experience in devising
metrics, collecting data in a disciplined
manner, and drawing appropriate
conclusions to recommend action.
The specific logic model and performance metrics that should be
implemented in an outcomes-measurement approach are best developed jointly
by the program’s funder and grantees. The grantee organization knows its own
infrastructure and local conditions and this knowledge is complemented by
domain expertise and familiarity with the broader social sector. For the benefit of
certain causes and strategies already well-researched and evaluated, NGOs,
research organizations, and funders have collaborated to endorse a set of
common core outcomes and impact metrics.
Including the grantee in the process of devising a measurement framework
contributes to a greater sense of partnership and leverages grantee-domain
expertise; sometimes grantees even take the lead in defining data collection and
measurement design. Allowing the grantee this flexibility reduces the burden of
responding to different funders who ask frequently for the same basic
information. Moreover, a partnership approach gives grantees a greater sense of
ownership—and makes their decision-makers more likely to act on results.
Throughout program implementation, the logic model may be re-examined and
modified based on the latest data available. According to the W. K. Kellogg
Foundation: “The process [of developing a model] is an iterative one. … Gaps in
activities, expected outcomes, and theoretical assumptions can be identified,
resulting in changes being made.” As Sonal Shah, director of the White House
Office of Social Innovation and Civic Participation, has said: “Just like business,
which sometimes needs to course-correct, nonprofits and social business should
Assessing grantee results 14
Corporate givers are
especially apt to assist
nonprofits in outcomes
measurement because
they can draw on
company-wide experience
in devising metrics,
collecting data in a
disciplined manner, and
drawing appropriate
conclusions to
recommend action.
be able to course-correct and make changes. They should only be considered a
failure if they fail to correct the problem.”
9
Outcomes measurement tracks the social changes a program targets, but
the tracked metrics appear early along the results chain. To estimate ultimate
impact, one can apply a model drawn from external evidence and adjusted
to current local conditions pertaining to ultimate effectiveness. This external
evidence includes quantitative data from prior studies and consultations with
sector experts.
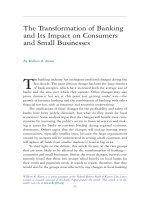
To expand on the earlier example of bednet distribution for malaria
prevention: Figure 4 outlines how an estimate of impact results (e.g., number of
child lives saved) can be calculated by tracking a key outcome indicator. This
indicator might be the additional number of children that now use bednets.
Evaluators then make informed assumptions about the relevant demographics
and anticipated effectiveness of treatment based on prior observations and studies
adjusted for local conditions.
Assessing impact-achievement potential
For grants in which the corporate funder is not involved in program design or
management, the funder may choose to rely on the grantees’ own measurement
process, standards, and data. The funder typically asks grantees to self-report
regularly on the following information:
1. What results they are committed to achieve;
2. What measurable evidence will be provided to verify success;
Conversation between grantees and CGO15
Measure
intermediate
outcomes
Change in
coverage
(additional
% of children
that use
bednets)
e.g., 80% of
population
use bednets
after program
Estimate
affected
population
Predicted
number of
deaths and
illnesses in
community
from malaria
e.g., 13.5/1000
rural children
die each
year
Estimate
real-world
conditions
Influence of
human
behavior
e.g., bednets
are used
correctly
only 65% of
the time
Estimate
tool
effectiveness
Protective
effect under
ideal
conditions
e.g., bednets
are 50%
effective
when used
correctly
Estimate
impact
Number of
child lives
saved
e.g., 3.5/1000
rural children
saved
Figure 4: Example of a Model for Estimating the Impact of Bednet Distribution
Source: Adapted from McLaughlin, C., Levy, J., Noonan, K., & Rosqueta, K. (February 2009).
x
x
x
=
x
x
x
=
3. What baseline results will serve as a point of comparison for the new data; and
4. How the grantee will track results and adjust methodology mid-course.
When results are self-reported, assessing impact-achievement potential in a
way that also measures general organization capabilities can increase funders’
confidence that the organization is achieving the outcomes it claims. As an
example of standardized ratings criteria for assessing impact potential, the
Alliance for Effective Social Investing has developed and proposed the “Outcome
Potential Assessment” framework. Their framework assumes that, regardless of
what the nonprofit intends to achieve, there are certain organizational
characteristics that tell an investor whether the organization is likely to
accomplish its goals. For instance, if an organization does not have a theory of
change, or does not diligently collect quality data supporting its effectiveness, or
does not use the data it does collect to improve, the organization is unlikely to
succeed. Using this framework, nonprofit organizations are rated according to
their diligence and acumen in collecting, interpreting, and using data to improve
services at the organizational level. Comparisons should be confined to
Assessing grantee results 16
Methodology for the Alliance for Effective Social Investing’s
Social Value Assessment Tool
To determine an organization’s capacity and potential to deliver high social
value, the Alliance for Effective Social Investing (2009) proposes that analysts
use a Social Value Assessment Tool, which comprises 26 questions and scores
organizations against six indicators:
• Diligence in collecting data.
• Possession of a clear set of outcomes and a logic model that together
describe how the organization intends to achieve the desired outcomes.
• Relation of efforts (outputs) to outcomes, to determine whether the
organization’s intervention is indeed producing the observed outcomes.
• Flexibility in adjusting the service approach given the latest data and
changing circumstances.
• Substantiation of the value of the program through data collection and
analysis.
• Capacity to deliver program services as they were designed.
Source: Alliance for Effective Social Investing (2009).
organizations working toward comparable outcomes with similar populations.
Charity Navigator, the largest charity evaluator in the country, is looking to
adopt
10
such an assessment framework so that its final ratings will not just
evaluate a charity’s financial performance, but also take into account its
potential to achieve intended outcomes.
High impact-potential organizations must invest in tools, training, and
operational resources needed for measurement. Corporate funders may rely on
grantees’ own measurement processes, but should also bear in mind that a quality
measurement process is vital to achieving impact value and should always be
budgeted at the source.
Summary
“Activities” and “output” metrics and targets are the most basic set of trackable
performance measures. (In programs comprising short-term, one-off grants,
activities and output metrics might very well be the only trackable measures.) By
themselves, however, output metrics offer little indication that social change is
being achieved or unintended harm caused. The three measurement approaches
outlined above summarize options for assessing the success of programs wherein
corporate givers are concerned about achieving social impact. Formal evaluations
(approach 1) are the only way to prove rigorously that an impact is the result of
an organization’s efforts and therefore validates a logic model. Outcomes
measurement (approach 2) focuses on nearer-term changes that allow real-time
adjustments to the intervention strategy and logic model in place and provide
indications that the program itself is causing the desired outcomes. Impact-
achievement potential assessment (approach 3) helps to determine whether an
organization has high-performing characteristics that will increase the likelihood
that self-reported outcomes are being deliberately achieved. These three
approaches are not necessarily exclusive; they can be combined. For example, a
young program may still be evolving strategically; its processes may not yet be
stable enough to withstand outcomes measurement or formal impact assessment.
The organization’s potential for achieving impact should still be assessed,
however—and as the program matures it may become worthwhile to develop
processes by which more precise measurement of actual impact may be applied
as well.
Conversation between grantees and CGO17
Question 2.
How to measure the return on social
investment from grants and giving programs?
Return on investment (ROI) is a highly favored business concept. Given a
standardized ratio of financial benefits-to-costs, decision-makers can gauge how
well a project is performing overall, compare the project’s efficiency to
alternatives, and even aggregate ROIs across multiple projects.
There has also been enthusiasm particularly among sophisticated private
foundations for applying ROI techniques to measure the social efficiency of
philanthropic programs. In a study commissioned by the Bill & Melinda Gates
Foundation, Melinda Tuan (2008) performed a critical review of eight selected
approaches for integrating cost into the measurement of social value creation and
noted that all of these different methodologies essentially reflected one concept:
expected return.
Expected Return = (Outcome or Benefit x Probability of Success)
Cost
A major difference among methodologies is whether benefits are monetized.
Methodologies in which benefits are monetized are classically described as cost-
benefit analysis. Methodologies in which benefits are not monetized are called
cost-effectiveness analysis. Measurement ratios based on cost-effectiveness are easier to
implement and require fewer data assumptions, because they sidestep the challenge
of having to convert different aspects of program benefits into common monetary
units. However, they can only account for one area of program impact at a time,
since impact for different program causes may be measured only in their programs’
respective natural units (e.g., lives saved, as in the bednet/malaria example).
As for comparing and aggregating impact across multiple grants: A key
challenge here is that diverse grants in dissimilar program areas seek different
outcomes. Corporate givers who choose to focus high-value grants to just one
cause issue are likely to be able to quantify impact in a common natural unit and
achieve measurable impact linked back to these grants. For programs such as
these, cost-effectiveness analysis is most appropriate. By contrast, cost-benefit
analyses assume that grant benefits can be monetized—and therefore the analysis
is potentially applicable to aggregating the value of grants applied to many
Return on social investment 18
different issues. But cost-benefit analysis makes greater demands on data, funders’
assumptions, and value judgments. Funders must collect the data needed to
estimate monetary benefits arising from the program and additionally make many
subjective judgments about the relative worth of the different social outcomes
achieved by different program types. When corporate funders would prefer not to
engage on this level (e.g., because they do not have the expertise to collect and
calculate the necessary data or make the essential value judgments—or both), the
only practical alternative may be to aggregate common output units such as
number of activities organized, products distributed, or beneficiaries served.
Figure 5 summarizes this decision framework for guiding the choice of
measurement approach. The choice of ROI analysis (if any) to consider depends
on the relative focus of the giving programs in question, as well as on the
expertise of the funders to calculate and use monetized benefits. The options
themselves are discussed in more detail below.
Cost-effectiveness analysis
Cost-effectiveness analysis features the calculation of a ratio of costs (i.e., total
contributions to the program) to a non-monetary benefit or outcome. In other
words, it indicates a project’s “bang for the buck.” Program impact is measured in
natural units—such as number of children graduated or beneficiaries’ life years
saved. This comparative analysis requires programs to pursue the same domain
Conversation between grantees and CGO19
Figure 5: Approaches for Comparing and Aggregating Social Impact
Results Across Corporate Grants
area and hence will be more applicable to corporate giving programs that focus
fewer high-value grants on a single program area.
One cost-effectiveness approach to calculating ROI is that of the Center for
High Impact Philanthropy at the University of Pennsylvania. The Center has
been developing its cost-per-impact methodology since 2006. The purpose of its
analysis is to provide philanthropists with an answer to the question “How much
does change cost?” The example below features a project by the Children’s
Literacy Initiative (CLI) to train pre-kindergarten through third-grade teachers in
effective literacy teaching techniques.
Return on social investment 20
Methodology for University of Pennsylvania Center for High Impact
Philanthropy’s Cost per Impact
Step 1: Project future cost or take actual cost from previous implementations.
Example: Based on prior experience, CLI estimated that teachers would need
three years of training to effect sufficient change and lasting impact. The
estimated cost to train twenty teachers for three years is $1,000,000.
Step 2: Obtain empirical results from past implementations of the model and
use those to project the impact of current implementation.
Example: Based on national studies and prior experience, the Center and CLI
estimated an average kindergarten teacher’s tenure to be fourteen years. Since
three of those years would be given over to training, the average teacher tenure
post-training would be eleven years (14 minus 3). In an evaluation performed in
White Plains, NY, 49% of kindergarten students met literacy benchmarks before
the CLI training was provided to teachers. Post-training, the proportion
increased 32 percentage points to 81%.
Based on an average class size of 25, 25 x 20 teachers = 500 students who
would be “touched” by the project each year. Given an average teacher tenure of
eleven years, 500 students per year x 11 years = 5,500 students touched.
The incremental number of students meeting benchmarks would then be
32% x 5,500 students = 1,760 students.
Step 3: Divide cost obtained in Step 1 by results obtained in Step 2 to produce
cost per impact.
Example: Dividing the cost of $1,000,000 by the 1,760 additional students
meeting literacy benchmarks yields a cost per incremental student, or cost per
impact, of $568.18.
As discussed, one advantage of quantification is that it allows comparison
with other projects. Hence, a grantor could use the above cost-per-impact figure
to determine which grantee would provide the most “bang for the buck.”
Alternatively, a grantor could use this figure as a benchmarking tool to identify
effective trends and then work with his or her own grantee to improve their own
ratio over time.
Source: Rhodes, H. J., Noonan, K., & Rosqueta, K. (December 2008).