Information Visualization: PERCEPTION FOR DESIGN
Bạn đang xem bản rút gọn của tài liệu. Xem và tải ngay bản đầy đủ của tài liệu tại đây (22.08 MB, 537 trang )
Information
Visualization
This page intentionally left blank
Information
Visualization
PERCEPTION FOR DESIGN
Third Edition
Colin Ware
AMSTERDAM • BOSTON • HEIDELBERG • LONDON
NEW YORK • OXFORD • PARIS • SAN DIEGO
SAN FRANCISCO • SINGAPORE • SYDNEY • TOKYO
Morgan Kaufmann is an imprint of Elsevier
Acquiring Editor: Meg Dunkerley
Development Editor: Heather Scherer
Project Manager: Paul Gottehrer
Designer: Kristen Davis
Morgan Kaufmann is an imprint of Elsevier
225 Wyman Street, Waltham, MA 02451, USA
© 2013 Elsevier, Inc. All rights reserved.
No part of this publication may be reproduced or transmitted in any form or by any means, electronic or mechanical,
including photocopying, recording, or any information storage and retrieval system, without permission in writing from the
publisher. Details on how to seek permission, further information about the Publisher’s permissions policies and our
arrangements with organizations such as the Copyright Clearance Center and the Copyright Licensing Agency, can be
found at our website: www.elsevier.com/permissions.
This book and the individual contributions contained in it are protected under copyright by the Publisher (other than as may
be noted herein).
Notices
Knowledge and best practice in this field are constantly changing. As new research and experience broaden our
understanding, changes in research methods or professional practices, may become necessary. Practitioners and researchers
must always rely on their own experience and knowledge in evaluating and using any information or methods described
herein. In using such information or methods they should be mindful of their own safety and the safety of others, including
parties for whom they have a professional responsibility.
To the fullest extent of the law, neither the Publisher nor the authors, contributors, or editors, assume any liability for any
injury and/or damage to persons or property as a matter of products liability, negligence or otherwise, or from any use or
operation of any methods, products, instructions, or ideas contained in the material herein.
Library of Congress Cataloging-in-Publication Data
Ware, Colin.
Information visualization : perception for design / Colin Ware. – 3rd [edition].
pages cm – (Interactive technologies)
Summary: “This is a book about what the science of perception can tell us about visualization. There is a gold mine of
information about how we see to be found in more than a century of work by vision researchers. The purpose of this book is
to extract from that large body of research literature those design principles that apply to displaying information
effectively”–Provided by publisher.
Includes bibliographical references and index.
ISBN 978-0-12-381464-7 (hardback)
1. Visual perception. 2. Visualization. 3. Information visualization. I. Title.
BF241.W34 2012
152.14–dc23
2012009489
British Library Cataloguing-in-Publication Data
A catalogue record for this book is available from the British Library.
For information on all MK publications
visit our website at www.mkp.com
Printed in China
1213141516 10987654321
Typeset by: diacriTech, Chennai, India
Contents
Preface xv
About the Author xxi
Chapter 1 Foundations for an Applied Science of Data Visualization 1
Visualization Stages 4
Experimental Semiotics Based on Perception 5
Semiotics of Graphics 6
Are Pictures Arbitrary? 7
Sensory versus Arbitrary Symbols 9
Properties of Sensory Representation 12
Testing Claims about Sensory Representations 15
Representations That Are Arbitrary 15
The Study of Arbitrary Conventional Symbols 17
Gibson’s Affordance Theory 17
A Model of Perceptual Processing 20
Stage 1. Parallel Processing to Extract Low-Level Properties of the Visual Scene 21
Stage 2. Pattern Perception 21
Stage 3. Visual Working Memory 22
Attention 22
Costs and Benefits of Visualization 23
Types of Data 25
Entities 26
Relationships 26
Attributes of Entities or Relationships 26
Data Dimensions: 1D, 2D, 3D, … 26
Types of Numbers 27
Uncertainty 28
Operations Considered as Data 28
Metadata 29
Conclusion 29
Chapter 2 The Environment, Optics, Resolution, and the Display 31
The Environment 32
Visible Light 32
Ecological Optics 32
Optical Flow 34
Textured Surfaces and Texture Gradients 35
The Paint Model of Surfaces 36
The Eye 41
The Visual Angle Defined 42
Lens 43
Optics and Augmented-Reality Systems 44
Optics in Virtual-Reality Displays 47
Chromatic Aberration 48
Receptors 49
Simple Acuities 50
Acuity Distribution and the Visual Field 52
Brain Pixels and the Optimal Screen 55
Spatial Contrast Sensitivity Function 59
Visual Stress 62
The Optimal Display 63
Aliasing 64
Number of Dots 66
Superacuities and Displays 66
Temporal Requirements of the Perfect Display 67
Conclusion 68
Chapter 3 Lightness, Brightness, Contrast, and Constancy 69
Neurons, Receptive Fields, and Brightness Illusions 70
Simultaneous Brightness Contrast 73
Mach Bands 74
The Chevreul Illusion 74
Simultaneous Contrast and Errors in Reading Maps 75
Contrast Effects and Artifacts in Computer Graphics 75
Edge Enhancement 76
Luminance, Brightness, Lightness, and Gamma 79
Constancies 79
Luminance 80
Displaying Details 82
Brightness 82
Monitor Gamma 83
Adaptation, Contrast, and Lightness Constancy 84
Contrast and Constancy 85
Contrast on Paper and on Screen 85
Perception of Surface Lightness 87
Lightness Differences and the Gray Scale 88
Contrast Crispening 89
Monitor Illumination and Monitor Surrounds 90
Conclusion 93
Chapter 4 Color 95
Trichromacy Theory 96
Color Blindness 98
Color Measurement 98
Change of Primaries 100
vi Contents
Chromaticity Coordinates 102
Color Differences and Uniform Color Spaces 105
Opponent Process Theory 108
Naming 108
Cross-Cultural Naming 109
Unique Hues 109
Neurophysiology 110
Categorical Colors 110
Properties of Color Channels 111
Spatial Sensitivity 111
Stereoscopic Depth 112
Motion Sensitivity 112
Form 113
Color Appearance 114
Monitor Surrounds 114
Color Constancy 114
Color Contrast 115
Saturation 116
Brown 117
Applications of Color in Visualization 117
Application 1: Color Specification Interfaces and Color Spaces 117
Color Spaces 118
Color Naming Systems 120
Color Palettes 122
Application 2: Color for Labeling (Nominal Codes) 122
Application 3: Color Sequences for Data Maps 128
Form and Quantity 129
Interval Pseudocolor Sequences 132
Ratio Pseudocolors 132
Sequences for the Color Blind 133
Bivariate Color Sequences 134
Application 4: Color Reproduction 135
Conclusion 138
Chapter 5 Visual Salience and Finding Information 139
Eye Movements 140
Accommodation 142
The Eye Movement Control Loop 142
V1, Channels, and Tuned Receptors 143
The Elements of Form 145
The Gabor Model and Visual Distinctness 147
A Differencing Mechanism for Fine Discrimination 149
Feature Maps, Channels, and Lessons for Visual Search 150
Preattentive Processing and Ease of Search 152
Attention and Expectations 156
Highlighting and Asymmetries 157
Contents vii
Coding with Combinations of Features 158
Coding with Redundant Properties 159
What Is Not Easily Findable: Conjunctions of Features 159
Highlighting Two Data Dimensions: Conjunctions That Can Be Seen 160
Integral and Separable Dimensions: Glyph Design 162
Restricted Classification Tasks 163
Speeded Classification Tasks 164
Integral–Separable Dimension Pairs 167
Representing Quantity 168
Representing Absolute Quantities 169
Multidimensional Discrete Data: Uniform Representation
versus Multiple Channels 170
Stars and Whiskers 172
The Searchlight Metaphor and Cortical Magnification 173
Useful Field of View 173
Tunnel Vision, Stress, and Cognitive Load 173
The Role of Motion in Attracting Attention 174
Motion as a User Interrupt 174
Conclusion 176
Chapter 6 Static and Moving Patterns 179
Gestalt Laws 181
Proximity 181
Similarity 182
Connectedness 183
Continuity 183
Symmetry 185
Closure and Common Region 186
Figure and Ground 189
More on Contours 191
Representing Vector Fields: Perceiving Orientation and Direction 193
Comparing 2D Flow Visualization Techniques 194
Showing Direction 196
Texture: Theory and Data Mapping 199
Tradeoffs in Information Density: An Uncertainty Principle 201
Primary Perceptual Dimensions of Texture 202
Texture Contrast Effects 202
Other Dimensions of Visual Texture 203
Nominal Texture Codes 204
Using Textures for Univariate and Multivariate Map Displays 205
Quantitative Texture Sequences 209
Perception of Transparency: Overlapping Data 211
Perceiving Patterns in Multidimensional Discrete Data 213
Pattern Learning 218
Priming 220
Vigilance 220
The Visual Grammar of Node–Link Diagrams 221
viii Contents
The Visual Grammar of Maps 227
Patterns in Motion 229
Form and Contour in Motion 231
Moving Frames 232
Expressive Motion 233
Perception of Causality 233
Perception of Animated Motion 235
Enriching Diagrams with Simple Animation 236
The Processes of Pattern Finding 236
Chapter 7 Space Perception 239
Depth Cue Theory 240
Perspective Cues 241
The Duality of Depth Perception in Pictures 242
Pictures Seen from the Wrong Viewpoint 244
Occlusion 246
Shape-from-Shading 247
Shading Models 248
Cushion Maps 24 9
Surface Texture 2 50
Cast Shadows 253
Distance Based on Familiar Size 255
Depth of Focus 255
Eye Accommodation 256
Structure-from-Motion 256
Eye Convergence 258
Stereoscopic Depth 258
Problems with Stereoscopic Displays 260
Frame Cancellation 261
The Vergence–Focus Problem 261
Distant Objects 262
Making Effective Stereoscopic Displays 262
Cyclopean Scale 264
Virtual Eye Separation 264
Artificial Spatial Cues 266
Depth Cues in Combination 269
Task-Based Space Perception 272
Tracing Data Paths in 3D Graphs 272
Judging the Morphology of Surfaces 276
Conformal Textures 277
Guidelines for Displaying Surfaces 280
Bivariate Maps–Lighting and Surface Color 281
Patterns of Points in 3D Space 282
Perceiving Patterns in 3D Trajectories 283
Judging Relative Positions of Objects in Space 284
Judging the Relative Movements of Self within the Environment 285
Contents ix
Selecting and Positioning Objects in 3D 286
Judging the “Up” Direction 288
The Aesthetic Impression of 3D Space (Presence) 289
Conclusion 290
Chapter 8 Visual Objects and Data Objects 293
Image-Based Object Recognition 294
Priming 296
Searching an Image Database 297
Life Logging 298
Structure-Based Object Recognition 299
Geon Theory 299
Silhouettes 299
The Object Display and Object-Based Diagrams 303
The Geon Diagram 305
Faces 308
Coding Words and Images 311
Mental Images 312
Labels and Concepts 313
Object Categorization 313
Canonical Views and Object Recognition 315
Concept Mapping 316
Concept Maps and Mind Maps 316
Iconic Images versus Words versus Abstract Symbols 320
Static Links 321
Scenes and Scene Gist 322
Priming, Categorization, and Trace Theory 322
Conclusion 323
Chapter 9 Images, Narrative, and Gestures for Explanation 325
The Nature of Language 326
Sign Language 326
Language Is Dynamic and Distributed over Time 328
Is Visual Programming a Good Idea? 328
Images versus Sentences and Paragraphs 331
Links between Images and Words 332
Integrating Visual and Verbal and the Narrative Thread 333
Linking Text with Graphical Elements of Diagrams 333
Gestures as Linking Devices in Verbal Presentations 333
Deixis 334
Symbolic Gestures 336
Expressive Gestures 336
Animated versus Static Presentations 337
Visual Narrative 339
Animated Images 341
Conclusion 343
x Contents
Chapter 10 Interacting with Visualizations 345
Data Selection and Manipulation Loop 346
Choice Reaction Time 346
Two-Dimensional Positioning and Selection 347
Hover Queries 348
Path Tracing 349
Two-Handed Interaction 349
Learning 350
Control Compatibility 351
Exploration and Navigation Loop 353
Locomotion and Viewpoint Control 354
Spatial Navigation Metaphors 355
Wayfinding, Cognitive Maps and Real Maps 359
Landmarks, Borders, and Place 361
Frames of Reference 362
Egocentric Frame of Reference 362
Exocentric Frames of Reference 363
Map Orientation 364
Focus, Context and Scale in Nonmetaphoric Interfaces 366
Distortion Techniques 368
Rapid Zooming Techniques 370
Elision Techniques 371
Multiple Simultaneous Views 372
Conclusion 373
Chapter 11 Visual Thinking Processes 375
The Cognitive System 376
Memory and Attention 377
Working Memories 378
Visual Working Memory Capacity 379
Change Blindness 380
Spatial Information 381
Attention 383
Object Files, Coherence Fields, and Gist 384
Long-Term Memory 386
Chunks and Concepts 388
Knowledge Formation and Creative Thinking 388
Knowledge Transfer 389
Visualizations and Mental Images 392
Review of Visual Cognitive System Components 393
Early Visual Processing 393
Pattern Perception 393
Eye Movements 393
The Intrasaccadic Scanning Loop 393
Working Memory 394
Contents xi
Mental Imagery 394
Epistemic Actions 394
Visual Queries 396
Computational Data Mappings 396
Visual Thinking Algorithms 397
Algorithm 1: Visual Queries 398
Algorithm 2: Pathfinding on a Map or Diagram 400
Visual Query Construction 401
The Pattern-Finding Loop 402
Algorithm 3: Reasoning with a Hybrid of a Visual Display
and Mental Imagery 403
Algorithm 4: Design Sketching 405
Algorithm 5: Brushing 407
Algorithm 6: Small Pattern Comparisons in a Large Information Space 408
Algorithm 7: Degree-of-Relevance Highlighting 412
Algorithm 8: Generalized Fisheye Views 415
Algorithm 9: Multidimensional Dynamic Queries with Scatter Plot 417
Algorithm 10: Visual Monitoring Strategies 420
Conclusion 422
Appendix A Changing Primaries 425
Appendix B CIE Color Measurement System 427
Appendix C The Perceptual Evaluation of Visualization Techniques and Systems 431
Research Goals 431
Psychophysics 433
Detection Methods 434
Method of Adjustment 435
Cognitive Psychology 435
Structural Analysis 436
Testbench Applications for Discovery 436
Structured Interviews 437
Rating Scales 438
Statistical Exploration 438
Principal Components Analysis 438
Multidimensional Scaling 439
Clustering 439
Multiple Regression 439
Cross-Cultural Studies 439
Child Studies 440
Practical Problems in Conducting User Studies 440
Experimenter Bias 440
How Many Subjects to Use? 441
Combinatorial Explosion 442
xii Contents
Task Identification 44 2
Controls 443
Getting Help 443
Appendix D Guidelines 445
Bibliography 459
Index 497
Contents xiii
This page intentionally left blank
Preface
T
here are two major changes in this latest edition of Information Visualization:
Perception for Design. The first is intended to make the design implications of
research in perception clearer. To this end, 168 explicit guidelines for the design
of visualizations have been added to the text in highlighted boxes. These guidelines
should be taken as suggestions to support design decisions, not as hard and fast rules.
Designing visualizations is a complex task, and it is not possible with a succinct guide-
line to set out all the circumstances under which a particular rule may apply. Graphic
designers must take into account interactions between small symbols and large areas
of color and texture as well as shading effects, shape effects, the grouping of symbols,
and so on. Different tasks may dictate changes in what should be highlighted and
what should be deemphasized. Often a designer must use an existing color scheme
or symbol set, and this also constrains the design problem. Because of this complexity,
it is important to understand the theory behind a guideline before it is applied; under-
standing the mechanisms of perception and the processes of visual thinking can make
it clear when and how that guideline should be applied and when it does not apply.
The second major change is an increased emphasis on the process of visual thinking.
The book now more fully incorporates the modern view that perception is an active
process in which every part of the visual system is retuned several times a second to
meet the needs of the current visual task. The greatest change is a radical reworking
of the final chapter, which now sets out the key components of the architecture of
the visual brain and follows this with a description of ten visual thinking algorithms.
These describe how people think using common visualization tools and techniques.
They are intended to help a designer take a visualization design problem and create
a novel and well-designed visual thinking tool.
In addition to these major changes, the book has been revised and updated through-
out to take recent research into account. Hundreds of new references have been added,
and most of the figures have been redrawn to take advantage of full-color printing.
Now let me tell you how this book came about. In 1973, after I had completed my
master’s degree in the psychology of vision, I was frustrated with the overly focused
academic way of studying perception. Inspired by the legacy of freedom that seemed
to be in the air in the late 1960s and early 1970s, I decided to become an artist and
explore perception in a very different way. But after three years with only very small
success, I returned, chastened, to the academic fold, though with a broader outlook, a
great respect for artists, and a growing interest in the relationship between the way we
present information and the way we see. After obtaining a doctorate in the psychology
of perception at the University of Toronto, I still did not know what to do next.
I moved into computer science, via the University of Waterloo and another degree,
and have been working on data visualization, in one way or another, ever since. In a
way, this book is a direct result of my ongoing attempt to reconcile the scientific study
of perception with the need to convey meaningful information. It is about art in the
sense that “form should follow function,” and it is about science because the science
of perception can tell us what kinds of patterns are most readily perceived.
Why should we be interested in visualization? Because the human visual system is a pat-
tern seeker of enormous power and subtlety. The eye and the visual cortex of the brain
form a massively parallel processor that provides the highest bandwidth channel into
human cognitive centers. At higher levels of processing, perception and cognition are clo-
sely interrelated, which is the reason why the words “understanding” and “seeing” are
synonymous. However, the visual system has its own rules. We can easily see patterns
presented in certain ways, but if they are presented in other ways they become invisible.
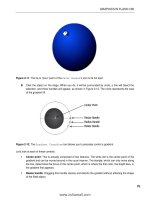
Thus, for example, the word goggle, shown in the accompanying figure, is much more
visible in the version shown at the bottom than in the one at the top. This is despite the
fact that identical parts of the letters are visible in each case and in the lower figure there
is more irrelevant “noise” than in the upper figure. The rule that applies here, apparently,
is that when the missing pieces are interpreted as foreground objects then continuity
between the background letter fragments is easier to infer. The more general point is that
when data is presented in certain ways the patterns can be readily perceived. If we can
understand how perception works, our knowledge can be translated into guidelines for
displaying information. Following perception-based rules, we can present our data in
such a way that the important and informative patterns stand out. If we disobey these
rules, our data will be incomprehensible or misleading.
This is a book about what the science of perception can tell us about visualization.
There is a gold mine of information about how we see to be found in more than a cen-
tury of work by vision researchers. The purpose of this book is to extract from that
large body of research literature those design principles that apply to displaying infor-
mation effectively.
Visualization can be approached in many ways. It can be studied in the art-school tra-
dition of graphic design. It can be studied within computer graphics as an area con-
cerned with the algorithms needed to display data. It can be studied as part of
semiotics, the constructivist approach to symbol systems. These are valid approaches,
but a scientific approach based on perception uniquely promises design rules that
transcend the vagaries of design fashion, being based on the relatively stable structure
of the human visual system.
The study of perception by psychologists and neuroscientists has advanced enor-
mously over the past three decades, and it is possible to say a great deal about how
we see that is relevant to data visualization. Unfortunately, much of this information
is stored in highly specialized journals and usually couched in language that is accessi-
ble only to the research scientist. The research literature concerning human perception
is voluminous. Several hundred new papers are published every month, and a surpris-
ing number of them have some application in information display. This information
xvi Preface
can be extremely useful in helping us design better displays, both by avoiding mistakes
and by coming up with original solutions. Information Visualization: Perception for Design
is intended to make this science and its applications available to the nonspecialist. It
should be of interest to anyone concerned with displaying data effectively. It is
designed with a number of audiences in mind: multimedia designers specializing in
visualization, researchers in both industry and academia, and anyone who has a deep
interest in effective information display. The book presents extensive technical informa-
tion about various visual acuities, thresholds, and other basic properties of human
vision. It also contains, where possible, specific guidelines and recommendations.
The book is organized according to bottom-up perceptual principles. The first chapter
provides a general conceptual framework and discusses the theoretical context for a
vision-science-based approach. The next four chapters discuss what can be considered
to be the low-level perceptual elements of vision, color, texture, motion, and elements
of form. These primitives of vision tell us about the design of attention-grabbing fea-
tures and the best ways of coding data so that one object will be distinct from another.
The later chapters move on to discussing what it takes to perceive patterns in data:
first two-dimensional pattern perception, and later three-dimensional space percep-
tion. Visualization design, data space navigation, interaction techniques, and visual
problem solving are all discussed.
Here is a road map to the book: In general, the pattern for each chapter is first to
describe some aspect of human vision and then to apply this information to some pro-
blem in visualization. The first chapters provide a foundation of knowledge on which
the later chapters are built. Nevertheless, it is perfectly reasonable to randomly access
the book to learn about specific topics. When it is needed, missing background infor-
mation can be obtained by consulting the index.
Chapter 1: Foundation for a Science of Data Visualization A conceptual framework
for visualization design is based on human perception. The nature of claims about sen-
sory representations is articulated, with special attention paid to the work of percep-
tion theorist J.J. Gibson. This analysis is used to define the differences between a
design-based approach and an approach based on the science of perception. A classi-
fication of abstract data classes is provided as the basis for mapping data to visual
representations.
Chapter 2: The Environment, Optics, Resolution, and the Display This chapter
deals with the basic inputs to perception. It begins with the physics of light and the
way light interacts with objects in the environment. Central concepts include the struc-
ture of light as it arrives at a viewpoint and the information carried by that light array
about surfaces and objects available for interaction. This chapter goes on to discuss the
basics of visual optics and issues such as how much detail we can resolve. Human
acuity measurements are described and applied to display design.
The applications discussed include design of 3D environments, how many pixels are
needed for visual display systems and how fast they should be updated, requirements
Preface xvii
for virtual-reality display systems, how much detail can be displayed using graphics
and text, and detection of faint targets.
Chapter 3: Lightness, Brightness, Contrast, and Constancy The visual system does
not measure the amount of light in the environment; instead, it measures changes in
light and color. How the brain uses this information to discover properties of the sur-
faces of objects in the environment is presented. This is related to issues in data coding
and setting up display systems.
The applications discussed include integrating the display into a viewing environment,
minimal conditions under which targets will be detected, methods for creating grays-
cales to code data, and errors that occur because of contrast effects.
Chapter 4: Color This chapter introduces the science of color vision, starting with
receptors and trichromacy theory. Color measurement systems and color standards
are presented. The standard equations for the CIE standard and the CIEluv uniform
color space are given. Opponent process theory is introduced and related to the way
data should be displayed using luminance and chrominance.
The applications discussed include color measurement and specification, color selection
interfaces, color coding, pseudocolor sequences for mapping, color reproduction,
and color for multidimensional discrete data.
Chapter 5: Visual Salience and Finding Information A “searchlight” model of
visual attention is introduced to describe the way eye movements are used to sweep
for information. The bulk of the chapter is taken up with a description of the massively
parallel processes whereby the visual image is broken into elements of color, form,
and motion. Preattentive processing theory is applied to critical issues of making
one data object distinct from another. Methods for coding data so it can be percep-
tually integrated or separated are discussed.
The applications discussed include display for rapid comprehension, information coding,
the use of texture for data coding, the design of symbology, and multidimensional dis-
crete data display.
Chapter 6: Static and Moving Patterns This chapter looks at the process whereby
the brain segments the world into regions and finds links, structure, and prototypical
objects. These are converted into a set of design guidelines for information display.
The applications discussed include display of data so that patterns can be perceived,
information layout, node–link diagrams, and layered displays.
Chapter 7: Visual Objects and Data Objects Both image-based and 3D-structure-
based theories of object perception are reviewed. The concept of the object display is
introduced as a method for using visual objects to organize information.
The applications discussed include presenting image data, using 3D structures to orga-
nize information, and the object display.
Chapter 8: Space Perception and the Display of Data in Space Increasingly, informa-
tion display is being done in 3D virtual spaces as opposed to the 2D screen-based layouts.
xviii Preface
The different kinds of spatial cues and the ways we perceive them are introduced. The
latter half of the chapter is taken up with a set of seven spatial tasks and the perceptual
issues associated with each.
The applications discussed include 3D information displays, stereo displays, the choice of
2D versus 3D visualization, 3D graph viewing, and virtual environments.
Chapter 9: Images, Words, and Gestures Visual information and verbal information
are processed in different ways and by different parts of the brain. Each has its own
strengths, and often both should be combined in a presentation. This chapter
addresses when visual and verbal presentation should be used and how the two kinds
of information should be linked.
The applications discussed include integrating images and words, visual programming
languages, and effective diagrams.
Chapter 10: Interacting with Visualizations Major interaction cycles are defined.
Within this framework, low-level data manipulation, dynamic control over data
views, and navigation through data spaces are discussed in turn.
The applications discussed include interacting with data, selection, scrolling, zooming
interfaces, and navigation.
Chapter 11: Visual Thinking Processes This chapter begins by outlining the cogni-
tive system involved in thinking with visualizations. The second half of the chapter
provides ten common visual thinking algorithms that are widely applicable in interac-
tive visualization. These are processes that occur partly in a computer, partly in the
visual brain of the user. The output of the computer is a series of visual images that
are processed through the visual system of the user. The output of the user is a set
of epistemic actions, such as clicking on an object or moving a slider, which result in
the visualization being modified in some way by the computer.
The applications discussed include problem solving with visualization, design of interac-
tive systems, and creativity.
These are exciting times for visualization design. The computer technology used to
produce visualizations has reached a stage at which sophisticated interactive 3D
views of data can be produced on laptop and tablet computers. The trend toward
more and more visual information is accelerating, and there is an explosion of new
visualization techniques being invented to help us cope with our need to analyze
huge and complex bodies of information. This creative phase will not last for long.
With the dawn of a new technology, there is often only a short burst of creative
design before the forces of standardization make what is new into what is conven-
tional. Undoubtedly, many of the visualization techniques that are now emerging will
become routine tools in the near future. Even badly designed things can become
industry standards. Designing for perception can help us avoid such mistakes. If we
can harness the knowledge that has accumulated regarding how perception works,
we can make visualizations become more transparent windows into the world of
information.
Preface xix
I wish to thank the many people who have helped me with this book. The people who
most influenced the way I think about perception and visualization are Donald Mitch-
ell, John Kennedy, and William Cowan. I have gained enormously by working with
Larry Mayer in developing new tools to map the oceans, as well as with colleagues
Kelly Booth, Dave Wells, Tim Dudely, Scott Mackenzie, and Eric Neufeld. It has been
my good fortune to work with many talented graduate students and research assistants
on visualization-related projects: Daniel Jessome, Richard Guitard, Timothy Leth-
bridge, Sean Riley, Serge Limoges, David Fowler, Stephen Osborne, Dale Chapman,
Pat Cavanaugh, Ravin Balakrishnan, Mark Paton, Monica Sardesai, Cyril Gobrecht, Jus-
tine Hickey, Yanchao Li, Kathy Lowther, Li Wang, Greg Parker, Daniel Fleet, Jun Yang,
Graham Sweet, Roland Arsenault, Natalie Webber, Poorang Irani, Jordan Lutes, Irina
Padioukova, Glenn Franck, Lyn Bartram, Matthew Plumlee, Pete Mitchell, and Dan
Pineo. Many of the ideas presented here have been refined through their efforts.
Peter Pirolli, Leo Frishberg, Doug Gillan, Nahum Gershon, Ron Rensink, Dave Gray,
and Jarke van Wijk made valuable suggestions that helped me improve the manu-
script. I also wish to thank the editorial staff at Morgan Kaufmann: Diane Cerra,
Belinda Breyer, and Heather Scherer. Finally, my wife, Dianne Ramey, read every
word three times (!), made it readable, and kept me going.
Figure P.1 The word goggle is easier to read when the overlapping bars are visible.
(Redrawn from Nakayama, Shimono, and Silverman (1989)).
xx Preface
About the Author
C
olin Ware takes the “visual” in visualization very seriously. He has advanced
degrees in both computer science (MMath, Waterloo) and the psychology of
perception (Ph.D., Toronto). He has published over 150 articles in scientific
and technical journals and at leading conferences, many of which relate to the use of
color, texture, motion, and 3D in information visualization. In addition to his research,
Professor Ware also builds useful visualization software systems. He has been
involved in developing 3D interactive visualization systems for ocean mapping for
over 20 years and directed the early development of the NestedVision3D system for
visualizing very large networks of information. Both of these projects led to commer-
cial spin-offs. Current projects involve tracking whales and visualizing ocean currents.
He is Director of the Data Visualization Research Lab in the Center for Coastal and
Ocean Mapping at the University of New Hampshire.
This page intentionally left blank
CHAPTER ONE
Foundations for an Applied
Science of Data Visualization
In his book The End of Science, science writer John Horgan (1997) argued that science is
finished except for the mopping up of details. He made a good case where physics is
concerned. In that discipline, the remaining deep problems may involve generating so
much energy as to require the harnessing of entire stars. Similarly, biology has its
foundations in DNA and genetics and is now faced with the infinite but often tedious
complexity of mapping genes into proteins through intricate pathways. What Horgan
failed to recognize is that cognitive science has fundamental problems that are still to
be solved. In particular, the mechanisms of the construction and storage of knowledge
remain open questions. He implicitly adopted the physics-centric view of science,
which holds that physics is the queen of sciences and in descending order come chem-
istry, then biology, with psychology barely acknowledged as a science at all. In this
pantheon, sociology is regarded as somewhere on a par with astrology. This attitude
is shortsighted. Chemistry builds on physics, enabling our understanding of materials;
biology builds on chemistry, enabling us to understand the much greater complexity
of living organisms; and psychology builds on neurophysiology, enabling us to under-
stand the processes of cognition. At each level is a separate discipline greater in com-
plexity and level of difficulty than those beneath. It is difficult to conceive of a value
scale for which the mechanisms of thought are not of fundamentally greater interest
and importance than the interaction of subatomic particles. Those who dismiss psy-
chology as a pseudo-science have not been paying attention. Over the past few dec-
ades, enormous strides have been made in identifying the brain structures and
cognitive mechanisms that have enabled humans to create the huge body of knowl-
edge that now exists. But we need to go one step further and recognize that a person
Information Visualization. DOI: 10.1016/B978-0-12-381464-7.00001-6
© 2013 Elsevier, Inc. All rights reserved.
working with the aid of thinking tools is much more cognitively powerful than that
person alone with his or her thoughts. This has been true for a long time. Artifacts
such as paper and pens, as well as techniques such as writing and drawing, have been
cognitive tools for centuries.
As Hutchins (1995) so effectively pointed out, thinking is not something that goes on
entirely, or even mostly, inside people’s heads. Little intellectual work is accomplished
with our eyes and ears closed. Most cognition is done as a kind of interaction with
cognitive tools, pencils and paper, calculators, and, increasingly, computer-based intel-
lectual supports and information systems. Neither is cognition mostly accomplished
alone with a computer. It occurs as a process in systems containing many people
and many cognitive tools. Since the beginning of science, diagrams, mathematical
notations, and writing have been essential tools of the scientist. Now we have power-
ful interactive analytic tools, such as MATLAB, Maple, Mathematica, and S-PLUS,
together with databases. The entire fields of genomics and proteomics are built on
computer storage and analytic tools. The social apparatus of the school system, the
university, the academic journal, and the conference are obviously designed to support
cognitive activity.
Cognition in engineering, banking, business, and the arts is similarly carried out
through distributed cognitive systems. In each case, “thinking” occurs through interac-
tion between individuals, using cognitive tools and operating within social networks.
Hence, cognitive systems theory is a much broader discipline than psychology. This is
emerging as the most interesting, difficult, and complex, yet fundamentally the most
important, of sciences.
Visualizations are an increasingly important part of cognitive systems. Visual displays
provide the highest bandwidth channel from the computer to the human. Indeed, we
acquire more information through vision than through all of the other senses combined.
The 20 billion or so neurons of the brain devoted to analyzing visual information pro-
vide a pattern-finding mechanism that is a fundamental component in much of our cog-
nitive activity. Improving cognitive systems often means optimizing the search for data
and making it easier to see important patterns. An individual working with a computer-
based visual thinking tool is a cognitive system where the critical components are, on
one side, the human visual system, a flexible pattern finder coupled with an adaptive
decision-making mechanism, and, on the other side, the computational power and vast
information resources of a computer coupled to the World Wide Web. Interactive visu-
alization is the interface between the two sides. Improving this interface can substan-
tially improve the performance of the entire system.
Until recently, the term visualization meant constructing a visual image in the mind
(Little et al., 1972). It has now come to mean something more like a graphical represen-
tation of data or concepts. Thus, from being an internal construct of the mind, a visua-
lization has become an external artifact supporting decision making. The way
visualizations can function as cognitive tools is the subject of this book.
2 Foundations for an Applied Science of Data Visualization