Biochemical Pharmacology Lecture Notes potx
Bạn đang xem bản rút gọn của tài liệu. Xem và tải ngay bản đầy đủ của tài liệu tại đây (6.85 MB, 145 trang )
Biochemical Pharmacology
Lecture Notes
Michael Palmer, Department of Chemistry, University of Waterloo, Canada
Third edition, January 2007
Contents
About these notes
vi
Chapter 1
.
Introduction
1
1.1. What are drugs? 1
1.2. Drugs and drug target molecules 2
1.3. Drug molecules may or may not have physiological counterparts 3
1.4. Synthetic drugs may exceed the corresponding physiological agonists in selectivity 4
1.5. Metabolism of physiological mediators and of drugs 5
1.6. Strategies of drug development 5
Chapter 2
.
Pharmacokinetics
9
2.1. Drug application and uptake 9
2.1.1. Oral drug application 9
2.1.2. Intravenous drug application 10
2.1.3. Other routes of drug applicaton 11
2.2. Drug distribution 12
2.2.1. Vascular permeability; the blood brain barrier 12
2.2.2. Drug hydrophobicity and permeation across membranes 12
2.2.3. L-DOPA as an example of drug distribution facilitated by specific transport 14
2.2.4. The ‘volume of distribution’ 14
2.2.5. Protein binding 15
2.2.6. Kinetics of drug distribution 15
2.3. Drug elimination: Kidneys 16
2.3.1. Kidney anatomy and function 16
2.3.2. Filtration, secretion, reuptake 18
2.3.3. Examples 20
2.4. Drug elimination: Metabolism 21
2.4.1. Example: Metabolism of phenobarbital and of morphine 21
2.4.2. Cytochrome P450 enzymes 22
2.4.3. Overview of drug conjugation reactions 23
2.4.4. Glucuronidation 24
2.4.5. Glutathione conjugation 24
2.4.6. Acetylation 25
2.4.7. Other reactions in drug metabolism 25
Chapter 3
.
Pharmacodynamics
27
3.1. Classes of drug receptors 27
3.2. Mechanisms and kinetics of drug receptor interaction 28
3.2.1. Mass action kinetics of drug-receptor binding 28
3.2.2. Reversible inhibition 28
3.2.3. Irreversible inhibition 29
3.2.4. Example: Inhibition of
α
-adrenergic receptors by tolazoline and phenoxybenzamine 30
3.3. Drug dose-effect relationships in biochemical cascades 31
3.4. Spare receptors 33
3.5. Potency and efficacy 33
3.6. Partial agonism and the two-state model of receptor activation 34
3.7. Toxic and beneficial drug effects 35
Chapter 4
.
The ionic basis of cell excitation
38
4.1. Ion gradients across the cell plasma membrane 38
4.2. The physics of membrane potentials 39
4.3. Voltage-gated cation channels and the action potential 41
4.4. The origin of cell excitation 43
4.5. Anion channels 44
Chapter 5
.
Drugs that act on sodium and potassium channels
47
5.1. Local anesthetics 48
5.2. Sodium channel blockers as antiarrhythmic agents 50
5.3. Sodium channel blockers in epilepsia 51
5.4. Potassium channel blockers 52
5.5. Potassium channel openers 53
Chapter 6
.
Some aspects of calcium pharmacology
55
6.1. Calcium in muscle cell function 55
6.2. Calcium channel blockers 57
6.3. Digitalis (foxglove) glycosides 58
6.4. Calcium-dependent signaling by adrenergic receptors 60
Chapter 7
.
Some aspects of neurophysiology relevant to pharmacology
63
7.1. Structure and function of synapses 64
7.2. Mechanisms of drug action on synapses 65
7.3. Pharmacologically important neurotransmitters and their receptors 65
7.4. Neurotransmitter receptors 67
7.5. Overview of the autonomic nervous system 68
Chapter 8
.
G protein-coupled receptors
72
8.1. Structure and function of G protein-coupled receptors 72
8.2. The complexity of G protein signalling 74
8.3. Agonist-specific coupling 74
8.4. GPCR oligomerization 75
8.5. ‘Allosteric’GPCR agonists and antagonists 75
Chapter 9
.
Pharmacology of cholinergic synapses
78
9.1. Structure and function of the nicotinic acetylcholine receptor 78
9.1.1. Overall structure 78
9.1.2. Location of the acetylcholine binding site 79
9.1.3. The nature of the receptor-ligand interaction 80
iii
9.1.4. Receptor desensitization 81
9.2. Cholinergic agonists 82
9.2.1. Muscarinic agonists 83
9.2.2. Nicotinic agonists 83
9.3. Cholinergic antagonists 84
9.3.1. Muscarinic antagonists 84
9.3.2. Nicotinic antagonists 84
9.3.3. Muscle relaxants 85
9.3.4. Nicotinic antagonists used as muscle relaxants 85
9.3.5. Depolarizing muscle relaxants 85
9.4. Cholinesterase antagonists 86
9.4.1. Chemical groups of cholinesterase inhibitors 87
9.4.2. Applications of cholinesterase inhibitors 88
Chapter 10
.
Pharmacology of catecholamines and of serotonin
90
10.1. Biosynthesis and degradation of catecholamines 90
10.2. Pharmacokinetic aspects 91
10.3. Drug targets in catecholaminergic synapses 91
10.4. Adrenergic receptor agonists and antagonists 92
10.4.1. Physiological effects of
α
- and
β
-selective adrenergic agonists 92
10.4.2. Physiological effects of
α
2
-adrenergic agonists 92
10.4.3.
β
-Adrenergic agonists 94
10.4.4.
α
-Adrenergic antagonists 94
10.4.5.
β
-Adrenergic antagonists 94
10.5. Inhibitors of presynaptic transmitter reuptake 95
10.6. Inhibition of vesicular storage 96
10.7. Indirect sympathomimetics 97
10.8. L-DOPA and carbidopa in the therapy of Parkinson’s disease 99
10.9. ‘False transmitters’ 99
10.10. Cytotoxic catecholamine analogs 99
10.11. Monoamine oxidase inhibitors 100
Chapter 11
.
Pharmacology of nitric oxide (NO)
103
11.1. Vascular effects of nitric oxide 103
11.2. Nitric oxide synthase and its isoforms 104
11.3. Biochemical mechanisms of NO signalling 105
11.4. Role of NO in macrophages 108
11.5. NO releasing drugs 109
11.6. NOS inhibitors 110
Chapter 12
.
Pharmacology of Eicosanoids
112
12.1. Biosynthesis of eicosanoids 112
12.2. Cyclooxygenase inhibitors 115
12.3. Lipoxygenases and related drugs 117
iv
Chapter 13
.
Some principles of cancer pharmacotherapy
122
13.1. Cell type-specific antitumor drugs 123
13.2. The cell cycle 124
13.3. Alkylating agents 124
13.4. Antibiotics 126
13.5. Antimetabolites 126
13.6. Inhibitors of mitosis 128
13.7. Monoclonal antibodies in tumour therapy 129
Chapter 14
.
Credits
133
Index
136
v
About these notes
These course notes have been assembled during several classes I taught on Biochemical Pharmacology. I welcome
corrections and suggestions for improvement.
Chapter 1. Introduction
What is ‘biochemical pharmacology’?
• A fancy way of saying ‘pharmacology’, and of hiding
the fact that we are sneaking a subject of medical inter-
est into the UW biochemistry curriculum.
• An indication that we are not going to discuss prescrip-
tions for your grandmother’s aching knee; we will focus
on the scientific side of thingsbut not on whether to take
the small blue pill before or after the meal.
What is it not?
• A claim that we accurately understand the mechanism
of action of each practically useful drug in biochemi-
cal terms.
• A claim that enzyme mechanisms and receptor struc-
tures, or even cell biology suffice as a basis to under-
stand drug action in the human body (how do you mea-
sure blood pressureon a cellculture?).Infact,weare go-
ing to spend some time with physiological phenomena
such as cell exitation and synaptic transmission that are
targeted by many practically important drugs.
1.1. What are drugs?
Dodrug moleculeshaveanythingincommon at all? Figure
1.1a shows the structure of the smallest drug - molecular
(or, more precisely, atomic) weight 6 Da.
On the other end of the scale, we have a rather large
molecules – proteins. Shown is the structure of tissue plas-
minogen activator (t-PA;Figure 1.1b).t-PA is a human pro-
tein. Its tissue concentration is very low, but by means of
recombinant expression in cell culture it can be obtained
in clinically useful amounts. t-PA is now the ‘gold stan-
dard’ in the thrombolytic therapy of brain and myocardial
infarctions.
The molecular weight of t-PA is about 70 kDa. Few drug
molecules (among them the increasingly popular bo-
tulinum toxin) are bigger than t-PA.
More typical sizes of drug molecules are shown in Figure
1.2. Most practically useful drugs are organic molecules,
with as molecular weight of roughly 200 to 2000, mostly
below 1000. Interestingly, this also applies to many natural
poisons (although on average they are probably somewhat
larger).Are there reasons for this?
Reasons for an upper limit include:
a)
b)
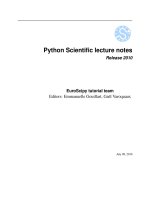
Figure 1.1.
A small drug and a large one. a: Lithium is a prac-
tically very important drug in psychiatry. Its mode of action is
still contentious – we will get into this later on in this course. b:
Tissue plasminogen activator is a protein that is recombinantly
isolated and used to dissolve blot clots. Lithium is shown on the
left for comparison.
N
N
S
N
H
C
H
3
O
S
N
H
2
O
O
Acetazolamide
C
H
2
C
H
2
C
H
C
O
O
C
H
2
C
H
3
N
H
C
H
C
H
3
C
O
N
C
O
O
H
Enalapril
O
H
N
H
C
O
C
H
3
Acetaminophen
Figure 1.2.
Some randomly chosen examples of drug molecules
to illustrate typical molecular size. These drugs are all enzyme
inhibitors but other than that have nothing in common. (Aceta-
zolamideinhibits carboanhydrase, enalapril inhibits angiotensin
converting enzyme, and acetaminophen inhibits cyclooxyge-
nase.)
1
2
Chapter 1. Introduction
1. Most drugs are chemically synthesized (or at least mod-
ified, e.g. the penicillins) – the larger the molecules,
the more difficult the synthesis, and the lower the yield
will be.
2. Drugs need to reach their targets in the body, which
means they need to be able to cross membrane barriers
by diffusion. Diffusion becomes increasingly difficult
with size.
One argument for a lower limit may be the specificity that
is required – drugs need to act selectively on their target
moleculesin order tobe clinically useful. There arenumer-
ous examples of low-molecular weight poisons – proba-
bly the better part of the periodic table is poisonous. There
are,however,interesting exceptionsto these molecular size
rules of thumb. One is lithium;another popular example is
shown in Figure 1.3.
1.2. Drugs and drug target molecules
Drugs need to bind to target molecules. Is there anything
remarkable about this statement at all? Well, two things:
1. It is a surprisingly recent insight – only about 100 years
old. (OK, so that is relative – long ago for you, but I’m
nearly there.)
2. It is not generally true.
The idea of defined receptor moleculesfor drugsor poisons
wasconceived by Paul Ehrlich (Figure 1.4).Ehrlich worked
on a varietyof microbesand microbialtoxins. Heobserved
C
C
O
H
H
H
H
H
H
Figure 1.3.
An interesting exception to the molecular size rules
of thumb.
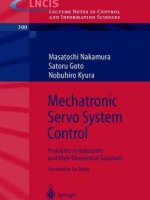
Figure 1.4.
Paul Ehrlich. Paul Ehrlich was a German Jewish
physician and scientist,who was inspired by and initially worked
with Robert Koch (who discovered the causative bacterial agents
of Anthrax, Tuberculosis, and Cholera). Left: Ehrlich’s portrait
on a 200 deutschmarks bill (now obsolete).
that many dyes used to stain specific structures in micro-
bial cells in microscopic examinations also exerted toxic
effects on the microbes. This observation inspired him to
systematically try every new dye he could get hold of (and
new dyes were a big thing in the late 19
th
century!) on his
microbes. Although not trained as a chemist himself, he
managed to synthesize the first effective antibacterial drug
– an organic mercury compound dubbed ‘Salvarsan’ that
was clinically used to treat syphilis for several decades,un-
til penicillin became available. Ehrlich screened 605 other
compounds before settling for Salvarsan. In keeping with
his enthusiasm for colors and dyes, Ehrlich is credited with
having possessed one of the most colorful lab coats of all
times (he also had one of the most paper-jammed offices
ever). His Nobel lecture (available on the web) is an inter-
esting read – a mix of brilliant and utterly ‘naive’ideasthat
makes it startlingly clear how very little wasknown in biol-
ogy and medicine only a century ago.
So, what molecules
are
targets of drugs? Some typical ex-
amples are found in the human renin-angiotensin system,
which is important in the regulation of blood pressure (Fig-
ure 1.5.Angiotensinogen isa plasma protein that,like most
Angiotensinogen
(MW 57000)
N’
-
Asp
-
Arg
-
Val
-
Tyr
-
Ile
-
His
-
Pro
-
Phe
-
His
-
Leu
-
Val
-
Ile
-
His
-
Asn
-
→
Renin
Asp
-
Arg
-
Val
-
Tyr
-
Ile
-
His
-
Pro
-
Phe
-
His
-
Leu
Angiotensin
I
Converting enzyme
Asp
-
Arg
-
Val
-
Tyr
-
Ile
-
His
-
Pro
-
Phe
Angiotensin
II
Peptidases (degradation)
Angiotensin
II
vascular smooth muscle cell
Receptor
G
-
protein
(inactive)
G
-
protein
(active)
Phospholipase
C
(inactive)
Phospholipase
C
(active)
PIP
2
IP
3
Ca
++
↑↑
contraction
blood pressure
↑↑
DAG
a)
b)
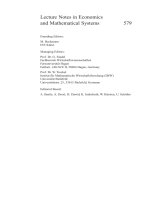
Figure 1.5.
The renin-angiotensin system. a) Angiotensinogen
is cleaved site-specifically by renin to yield angiotensin I. The
latter is converted by another specific protease (angiotensin con-
vertase or converting enzyme) to angiotensin II. b) Angiotensin
effects vasoconstriction by acting on a G protein-coupled recep-
tor that is found on smooth muscle cells. This ultimately leads to
increased availability of free Ca
++
in the cytosol and contraction
of the smooth muscle cells.
1.2. Drugs and drug target molecules
3
plasma proteins, is synthesized in the liver. From this pro-
tein,the peptide angiotensin I is cleaved by the specificpro-
tease renin,which isfound in the kidneys(
ren
lt. = kidney).
Angiotensin I, which isonly weakly active as a mediator,is
cleaved further by angiotensin converting enzyme, which
is present in the plasma. This second cleavage releases an-
giotensin II, which is a very powerful vasoconstrictor. An-
giotensin II acts on a G protein-coupled receptor, amem-
brane protein that isfound onvascularsmooth muscle cells.
Through a cascade of intracellular events, this receptor
triggers contraction of the muscle cell, which leads to con-
striction of the blood vesselsand an increase of blood pres-
sure).
Increased activity of the renin-angiotensin system is fre-
quently observed in kidney disease, which may lead to ab-
normallyhigh releaseof renin. Severalpointsin the system
areamenabletopharmacologicalinhibition. Thefirst oneis
renin itself,which splitsa specificbond in theangiotensino-
gen polypeptide chain (Figure 1.5a). An inhibitor of renin
is remikiren (Figure 1.6a).
Remikiren (Figure 1.6a) is effective but has several short-
comings, such as low ‘bioavailability’– which means that
the drug does not efficiently get into the systemic circula-
tion after oral uptake. Of course, oral application is quite
essential in the treatment of long-term conditions such as
hypertonia. A major cause of low bioavailability of drugs
is their metabolic inactivation. Drug metabolism mostly
happensin the liver (and sometimes in the intestine)and of-
ten isa major limiting factor of a drug’sclinical usefulness.
Remikiren contains several peptide bonds, which likely are
a target for enzymatic hydrolysis.
The most practically important drugs that reduce an-
giotensin activity are blockers not of renin but of an-
giotensin converting enzyme blockers, such as enalapril
(Figure 1.6b). These have a major role in the treatment of
hypertonia. In contrast to remikiren,enalapril isof smaller
size and hasonly one peptide bond,which is also lessacces-
sible than those of remikiren. These features correlate with
a bioavailability higher than that of remikiren.
1.3. Drug molecules may or may not have physiological
counterparts
The vasoconstricting action of angiotensin can also be
countered at the membrane receptor directly. One such
inhibitor that has been around for quite a while is saralasin
(Figure 1.6c).
Saralasin illustrates that the structure of the physiological
mediator or substrate is a logical starting point for the syn-
thesisof inhibitors. However,itisnot acompletelysatisfac-
tory drug, because it cannot be orally applied – can you see
why? The more recently developed drug valsartan (Figure
CH
2
CH
2
C
H
CH
2
CH
2
C
H
2
CH
CH
CH
CH
C
H
CH
3
CH
3
CH
3
S C
H
2
O
O
C
H
CH
2
N
H
O
C
H
CH
2
N
C
H
N
H
CH
N
H
O
C
H
CH
2
C
H
OH
C
H
2
C
H
OH
C
H
CH
2
C
H
2
CH
CH
CH
CH
C
H
C
H
2
C
H
2
C
H
C
O
O C
H
2
CH
3
N
H
C
H
CH
3
C
O
CH
2
N
C
H
CH
2
C
H
2
C
O
OH
Sar-Arg-Val-Tyr-Val-His-Pro-Ala
N
OH
O
O
N
N
N
N
H
a)
b)
c)
d)
Figure 1.6.
Drugs that act on the renin-angiotensin system. a:
Remikiren, an inhibitor of renin. Can you see the similarities
with the physiological substrate? b: Enalapril, an inhibitor of
angiotensin converting enzyme. Enalapril has a higher bioavail-
ability than remikiren does, which is probably related toits small-
er size and lower number of peptide bonds. c: Sequence of the
synthetic peptide angiotensin antagonist saralasin. Sar = sarco-
sine (N-methylglycine).Amino acid residuesnot occurring in an-
giotensin are underlined. d: Valsartan, an angiotensin receptor
antagonist. Note the low degree of similarity with the physiolog-
ical agonist.
1.6d) is orally applicable, but has very limited similarity to
the physiological agonist.
Enalapril and valsartan represent the two practically most
important functional groups of drugs, respectively – en-
zyme inhibitors, and hormone or neurotransmitter recep-
tor blockers. Another important group of drugs that act on
hormone and neutotransmittor receptors are ‘mimetic’ or
agonistic drugs. However, there is no clinically useful ex-
ample in the renin-angiotensin pathway; we will see exam-
ples later.
4
Chapter 1. Introduction
1.4. Synthetic drugs may exceed the corresponding
physiological agonists in selectivity
Angiotensin is an example of a peptide hormone. Peptide
hormones and neurotransmitters are very numerous, and
new ones are constantly being discovered, as are new loca-
tions and receptors for known ones. While several drugs
exist that act on peptide receptors (most notably, opioids),
drug development generally lags behind the physiological
characterization. The situation is quite different with an-
other group of hormones / transmitters, which are small-
er molecules, most of them related to amino acids. With
many of these, the availability of drugs has enabled the
characterization of different classes of receptors and their
physiologicalroles. Theclassicalexampleisthedistinction
of
α
- and
β
-adrenergicreceptors (which we will consider in
more detail later on in this course).While both epinephrine
and norepinephrine act on either receptor (though with
somewhat different potency), the distinction became very
clear with the synthetic analog isoproterenol, which acts
very strongly on
β
-receptors but is virtually inactive on
α
-receptors (Figure 1.7).
Agonists and antagonists that are more selective than the
physiological mediators are both theoretically interesting
and of great practical importance. As a clinically signifi-
cant example of a selective receptor antagonist, we may
consider the H
2
histamine receptor in the stomach, which is
involved inthe secretion of hydrochloricacid (Figure1.8a).
The mediator itself – histamine – was used as starting point
in the search for analogs that would bind to the receptor but
not activate it. The first derivative that displayed strongly
reduced stimulatory activity (while still binding to the re-
ceptor, of course) was N-guanylhistamine (Figure 1.8b).
Further structural modification yielded cimetidine, which
was the first clinically useful H
2
receptor blocker. It rep-
resented a major improvement in ulcer therapy at the time
and is still in use today, although more modern drugs have
largely taken its place.
Isoproterenol
N
H
2
O
H
O
H
O
H
N
H
O
H
O
H
O
H
C
H
3
Norepinephrine
Epinephrine
N
H
O
H
O
H
O
H
C
C
H
3
C
H
3
Figure 1.7.
Structures of the natural adrenergic agonists, nore-
pinephrine and epinephrine,and the synthetic
β
-selective agonist
isoproterenol.
Histamine
stomach mucosa epithelial cell
H
2
-Receptor
response: HCl secretion
ulcer
NH
N
CH
2
CH
2
NH
2
NH
N
CH
2
CH
2
NH C
NH
NH
2
Histamine
Cimetidine
N-guanylhistamine
a)
b)
C
H
NH
C C
N
CH
3
CH
2
S CH
2
CH
2
NH
C
N
C N
NH CH
3
Figure 1.8.
Histamine H
2
receptors and receptor antagonists. a:
Function of histamine in the secretion of hydrochloric acid from
the stomach epithelium. Hypersecretion promotes formation of
ulcers. b: Development of H
2
-receptor antagonists by variation
of the agonist’s structure. Cimetidine was the first clinically
useful antagonist.
While H
2
-selective blockers retain some structural resem-
blancetothe original mediator (histamine),thesamecannot
be said of the likewise clinically useful H
1
blockers, which
were developed for the treatment of allergic diseases such
as hay fever (Figure 1.9).
Indeed, the H
1
blockers do seem to be plagued by signifi-
cant ‘cross-talk’toreceptorsother thanhistaminereceptors.
This is not uncommon – many agents, particularly those
that readily penetrate into the central nervous system, have
incompletely defined receptor specificities, although they
are usually given a label suggesting otherwise. They are
Histamine
H
1
receptor
Allergic
reaction
H
2
receptor
Ulcer
N
H
N
C
H
2
C
H
2
N
H
2
N
H
N
C
H
2
C
H
2
C
H
2
C
H
2
N
H
C
N
N
H
C
H
3
C
H
3
C
N
Cimetidine
C
H
N
N
C
H
3
Cyclizine
Figure 1.9.
Comparison of H
1
and H
2
receptor antagonists. Cy-
clizine shows very little structural resemblance of the agonist
histamine.
1.4. Synthetic drugs may exceed the corresponding physiological agonists in selectivity
5
frequently used regardless on a empirical basis, often for
fairly diverse indications
1
.
1.5. Metabolism of physiological mediators and of
drugs
So far,we have encountered tworeasonsfor designing drug
moleculesthat are structurally different from physiological
mediators:
1. Turning an agonist into an inhibitor, and
2. Increasing receptor selectivity.
Both these reasons relate directly to the interaction of the
drug molecule with its target. A third rationale for varying
thestructureof the drugmoleculeisthat most physiological
mediators are rapidly turned over in the organism, which
is usually undesirable with drugs. E.g., angiotensin lives
only for a few minutes (as does saralasin);the same applies
to epinephrine and norepinephrine
2
.With these,one impor-
tant pathway of inactivation consistsin methylation(Figure
1.10).
The drug phenylephrine (Figure 1.10, right) lacks the cru-
cial hydroxyl group that normally initiates inactivation of
epinephrine and therefore persists for hours rather than
minutes in the organism, making it more practically useful
in pharmacotherapy (‘take this twice daily with the meal’).
Its lower intrinsic affinity to the receptor (about 100fold
lower than that of adrenaline) can be offset by increasing
the absolute amount applied.
N
H
O
H
O
H
O
H
C
H
3
N
H
O
C
H
3
O
H
O
H
C
H
3
N
H
O
H
O
H
C
H
3
COMT
Figure 1.10.
Inactivation of epinephrine by catechol-O-methyl-
transferase. The synthetic adrenergic agonist phenylephrine es-
capes inactivation because its phenyl ring lacks the 4-hydrox-
yl group.
1
E.g., H
1
-blockersare prescribed to treat insomnia - but I found them not
very reliable in thisindication. Probably,you have to be driving your car
for this to work.
2
Notable exceptions are the steroid hormones, which are rather stable;
some of these can therefore be directly used for therapy, e.g. hydrocor-
tisone.
In practical pharmacotherapy, a drug’s metabolism and
elimination are of equal importance as its specific mecha-
nism of action. There are several reasons for this:
1. Drugs may be extensively metabolized in the liver.
Since all orally applied drugs are passed through the liv-
er before reaching the systemic circulation,thiscan lead
to impracticallylow effectivelevelsat the relevant target
site. Example: Remikiren (above).
2. Sometimes,the metabolic products are more active than
the parent drug,or they may have poisonous effects that
were not observed with the parent compound itself
3
.
3. Diseases – or concomitant use of other drugs – may
significantly change the rate of metabolism and thereby
change the bioavailability of the drug, leading to loss of
desired effects or unacceptably severe side effects.
In the foregoing, we have seen several examples of one
frequently used approach to drug development: The struc-
ture of a physiological mediator is used as a starting point;
a large number of variants are synthesized, and from the
pool of variants those with the desired agonistic or antag-
onistic properties are ‘screened’ using appropriate
in vitro
assays and animal experiments. This approach does not al-
ways work. Below are some examples of other successful
approaches to drug development. You will note that some
of these are not completely general either.
1.6. Strategies of drug development
Drug development strategies may be classified as follows:
1. Rational design
2. Brute force
3. Traditional medicine / natural products
4. Mere chance.
Note that these distinctions are not really sharp in practice.
E.g., the development of H
2
-receptor blockers described
above would be a mixture of strategies 1 and 2. In reality,
one will alwaystry to rationally make use of as much infor-
mation as possible and then play some kind of lottery to do
the rest.
An example of the rational approach to drug design is pro-
vided by the development of HIV (human immune defi-
ciency virus) protease inhibitors. HIV protease cleaves vi-
ral polyproteins – the initial products of translation – into
the individual protein components and thus is essential for
3
E.g., prontosil (Figure 1.12) is entirely inactive on bacterial cultures.
Only after its reductive cleavage in human metabolism the active
metabolite sulfanilamide is released, and antibacterial activity becomes
manifest.
6
Chapter 1. Introduction
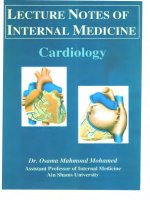
Figure 1.11.
Structure of HIV protease, with the inhibitor
saquinavir (red) bound in its active site. The sliced view (right)
shows the close fit of inhibitor and active site.
the maturation of virus particles. The crystal structure of
HIV protease was used to design synthetic molecules that
would snugly fit into the active site. Figure 1.11shows the
inhibitor saquinavir bound to the the enzyme. HIV pro-
tease inhibitors have become one of the mainstays of HIV
therapy; their use in combination with reverse transcrip-
tase inhibitors greatly extends the life expectancy of HIV
patients.
The brute-force approach involves the following steps:
1. Systematically test every new (or old) compound for
drug activity in all kinds of drug activity assays – no
matter which purpose it was designed for
2. If you stumble upon something, figure out how it
works
A classic success case of the brute-force approach is the
discovery of ‘Prontosil rubrum’, the first sulfonamide type
N
H
2
S
N
H
2
O
O
N
H
2
O
O
H
p
-
Aminobenzoic
acid
Sulfanilamide
‘
Prontosil rubrum’
N
N
S
N
H
2
O
O
N
H
2
N
H
2
Figure 1.12.
Structures of the sulfonamide drug ‘prontosil
rubrum’, its antibacterially active metabolite sulfanilamide, and
thebacterialmetabolitep-Aminobenzoicacid. Sulfanilamideacts
as an antimetabolite (i.e., competitive inhibitor) in the synthesis
of folic acid, of which aminobenzoic acid is a component.
antibacterial drug (Figure 1.12). ‘Rubrum’ means ‘red’ in
Latin – so thisisanother dye turned drug. The biochemical
mechanism was completely unknown by the time, but the
drug nevertheless was very active against a considerable
range of bacterial species. The discovery of sulfonamides
in the 1930s was a major reason for the delay in the devel-
opment of penicillin, the effect of which was discovered
in 1928 but which was not available for clinical use before
1942 (see below).
The brute force approach to drug discovery is still widely
used, and one of the reasons why drug design is now large-
ly done by major pharmaceutical companies. In fact, pron-
tosil was discovered at the biggest pharmaceutical compa-
ny of the era, the German ‘IG Farben’, which was disman-
tled after the war for itsinvolvement with the productionof
poisons used in the holocaust.
Traditional medicine is largely based on plants and their
various poisons. There is a fair number of drugs original-
ly isolated from plants that are still being used in clinical
medicine – even if most of them are now prepared synthet-
ically. This approach may be summarized as follows:
1. Isolate the active components from therapeutically
useful and / or toxic plants
2. Elucidate structure, mode of action
3. Find synthetic route, create novel derivatives with im-
proved properties
A classical example is atropine (Figure 1.13). It is isolated
from the plant
Atropa belladonna
. ‘Bella donna’is a com-
mon phrase in schmaltzy songs of (true or pretended) Ital-
ian origin and means ‘beautiful woman’. In the old days,
atropine was used by young women to augment their looks
beforeattendingfestivities. It widensthe pupilsof theeyes,
and it preventssweating,therefore leading to accumulation
of heat and to red cheeks. At higher dosages, it also caus-
C
H
3
C
O
O
C
H
2
C
H
2
N
+
C
H
3
C
H
3
C
H
3
Acetylcholine
Atropine
N
+
C
H
3
C
C
H
2
O
H
O
O
N
+
C
H
3
C
C
H
2
O
H
O
O
Ipratropium
Figure 1.13.
Structures of acetylcholine and its competitors
atropine and ipratropium. Atropine occurs naturally in
Atropa
belladonna
. Ipratropium is a synthetic derivative.
1.6. Strategies of drug development
7
es hallucinations, which may or may not be helpful with
fallinginlove. Thehallucinationsare,obviously,caused by
atropine entering the central nervous system. The central
effects are lessened by derivatization of the tertiary amine
found in atropine to a quaternary amine, as in ipratropium.
Because of its permanent charge, ipratropium does not eas-
ily cross the blood brain barrier by ‘non-ionic diffusion’,
and it is therefore often preferred over atropine in clinical
medicine.
The final approach to drug development consists in taking
advantage of mere chance. The most striking example
that comes to mind is the discovery of penicillin. Here is a
summary of this ‘strategy’:
1. Forget to properly cover your petri dish and
2. Have the petri dish contaminated by a mold that kills
bacteria (Sir Alexander Fleming, 1929),
3. Wait until somebody else purifies the active ingredi-
ent and makes it available for clinical use (Florey and
Chain, 1942).
S.A.Waksman took up this paradigm of drug discovery
in the 1940’s in a more systematic way, starting at stage 2
rather than 1. He succeeded in isolating a large number of
antibioticsfrom a wide variety of soil microorganisms,par-
ticularlystreptomycetes. Thefirst example wasthyrotricin,
which is useful for local treatment only. More prominent
discoveries of his are streptomycin and chloramphenicol,
which can be used systemically and still have their place in
therapy today.
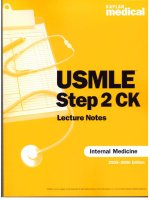
Figure 1.14.
The very petri dish that sparked the discovery of
penicillin. Thewhiteblobat thebottom isa colonyof
Penicillium
notatum
contaminating a plate streaked with
Staphylococcus au-
reus
(small, circular colonies). The penicillin diffusing from the
fungus radially into the agar has killed off the bacterial colonies
in its vicinity.
(Notes)
8
Chapter 1. Introduction
Chapter 2. Pharmacokinetics
Whatever the actual mechanism of action of a drug may
be, we will want to know: Does the drug actually reach its
site of action, and for how long does it stay there? This is
governed by three factors:
1. Absorption: Uptake of the drug from the compartment
of application into the blood
2. Distribution: Transport / equilibration between the
blood and the rest of the organism
3. Elimination: Filtration and secretion in the kidneys;
chemical modification in the liver
Broadly speaking, absorption and distribution determine
the whether a drug will be available at its target site at all,
while elimination determines for how long the drug effect
will last. The issues of drug absorption, distribution and
elimination are collectively referred to as ‘pharmacoki-
netics’.
2.1. Drug application and uptake
You are certainly aware that drugs are applied by various
routes; the choice depends largely on the pharmacokinetic
properties of the drug in question. Table 2.1 lists some
characteristics of the major routes.
We will look at the various routes of application in turn.
Oral uptake is the most common one, so let’s start with
this one.
2.1.1. Oral drug application
Inside the digestive tract,drug molecules encounter a quite
aggressivechemical milieu. E.g.,theacidicpH in thestom-
ach (pH ~2) and the presence of proteases and nucleasesin
the gut preclude the application of proteins, nucleic acids,
and other labile molecules. The gut mucous membrane
presents a barrier to uptake; many drugs are not able to ef-
ficiently cross it by way of diffusion.
For those drugs that make it from the gut lumen into the
blood, the liver presents another formidable barrier. All
blood drained from the intestines(as well as the spleen and
the pancreas) is first passed through the liver before being
released into the general circulation. This is schematically
depicted in figure 2.1.
Inside the liver, the blood leaves the terminal branches of
the portal vein andthe liver artery and isfiltered through the
liver tissue (Figure 2.3a).
Liver
Vena
portae
and tributaries
Liver artery
Liver vein
Systemic
circulation
Figure 2.1.
Schematic of the portal circulation. Blood drained
from all intestinal organs is collected into the portal vein and
conducted to the liver. The liver receives an additional supply of
oxygen-rich blood via the liver artery.
The liver tissue has a characteristic honey-comb structure
(Figure 2.3b). The individual hexagons of the honeycomb
are referred to as lobuli. The portal vein and liver artery
branches spread along the boundaries of the lobuli. The
blood that leavesthem is filtered through the tissue towards
the center of the lobulus, where it reaches the central vein.
The central veinsthen siphon the blood toward thesystemic
circulation.
A notable feature of the liver tissue is its lack of real blood
vessel walls along the way from the portal vein branches
to the central veins. Therefore,the blood gets into intimate
contact with the liver epithelial cells, which therefore can
very efficiently extract from the blood any compound they
see fit (Figure 2.3c).
The liver is a metabolically very versatile organ and is ca-
pable of chemically modifying a great many substrates –
including drugs – in a variety of ways and with great effi-
ciency. In fact, many drugs cannot be orally applied at all
because even during the initial passage the liver extracts
them quantitativelyfrom theportalvenousblood. Thisphe-
nomenon is called the ‘first pass effect’. An example of a
drug that undergoes a substantial first-pass effect is propra-
nolol (Figure 2.2).
Propranolol, which blocks
β
-adrenergic receptors, is com-
monly used in patientswith cardiovascular disease. Shown
beloware two metabolites. The left one (4-hydroxypropra-
nolol) is still active but not quantitatively very important.
The right one (naphthyloxymethyllactate) is entirely inac-
9
10
Chapter 2. Pharmacokinetics
Route Advantages Disadvantages
Oral Convenience – route of choice if possible Multiple barriers and obstacles to efficient
uptake into systemic circulation
1. Aggressive milieu in stomach and gut lu-
men
2. Liver barrier
Intravenous Efficient – quantitative delivery of drug to cir-
culation
Involved – needs skilled labor, risk of infec-
tion, enhanced risk of drug allergy
Pulmonic (inhalation) Fast, quantitative uptake Limited to gaseous agents (oxygen / nar-
cotics)
Topical High drug concentration can be achieved,
toxic side effects can be minimized
Limited to accessible sites (skin, mucous
membranes)
Table 2.1.
Drug application routes. Notethat inhalation of gasesis very different from inhalation of aerosols. Gaseswill,likeoxygen,
be systemicallydistributed,whereas the dropletsof aerosols will be deposited on the mucous membranes of the bronchi. Accordingly,
aerosols are mostly used for topical therapy of asthma.
O
C
H
2
O
H
C
H
3
C
O
O
H
Propranolol
O
C
H
2
O
H
C
H
3
C
H
2
N
H
C
H
3
C
H
3
O
C
H
2
O
H
C
H
3
C
H
2
N
H
C
H
3
C
H
3
O
H
Figure 2.2.
Propranolol and two of its major metabolites. The
hydroxylated derivative still has
β
-antagonistic activity. The
other compound is inactive.
tive. Only about 30% of the propranolol ingested actually
shows up in the systemic circulation – the rest is either not
absorbed or metabolized in the liver during the first pas-
sage. The extent of this first pass effect showsconsiderable
inter-individual variation – which means that the required
dosage may vary considerably and has to be empirically
determined with each patient. The fraction that reaches the
systemiccirculation (~30%in our example)isdesignatedas
the ‘bioavailability’of the drug.
To sum up: Oral application has
• Advantages: Convenience – route of choice if possible
• Disadvantages:
1. Aggressive chemical milieu in the digestive tract –
precludes application of proteins, nucleic acids
2. Gut mucous membrane presents a barrier
3. Blood from the intestine is passed through the liver
– liver may immediately extract and metabolize the
drug (‘first pass effect’)
4. Absorption is slow (not suitable for emergency treat-
ment) and variable
2.1.2. Intravenous drug application
With intravenousapplication,we have the followingadvan-
tages:
• ‘Absorption’, even of large molecules, is quantitative
and instantaneous. This is essential if drug action is
needed immediately.
• Short-lived drugs can be continuously applied by in-
fusion, and the infusion rate can be controlled so as to
‘titrate’theclinicaleffect. Examples: Musclerelaxation
with succinylcholine during narcosis, control of blood
pressure in hypertonic crisis with sodium nitroprusside
(both drugs will be discussed later in this class).
• No exposure of drug to harsh conditions – proteins can
be applied this way
Disadvantages:
• Involved (needs trained professional for each applica-
tion – dangerous if not performed properly)
• Adverse reactions to drugs will be more instantaneous
and serious, too (example: penicillin allergy)
2.1. Drug application and uptake
11
Portal vein
and liver artery
Liver vein
a)
Portal vein branch (from intestine)
Liver artery branch
To Liver
vein
b)
c)
Figure 2.3.
Blood circulationand tissue perfusion in the liver. a:
Schematic of the blood circulation. Portal vein and liver artery
branch out in a parallel fashion. From the terminal branches,the
blood entersthe tissue and is then collected into the tributariesof
the liver vein. b: The liver tissue has a ‘honeycomb’ structure;
each hexagon is a liver lobule. The liver artery and portal vein
branchesare located at the corners;in themiddleof the lobule,we
find the ‘central vein’which merges with others to form the liver
vein. c: Higherpower view,showingthe sponge-likestructure of
the liver tissue. The blood gains intimate contact with virtually
every liver cell – diffusional barriers are absent, and distances
extremely short.
2.1.3. Other routes of drug applicaton
Dermal application has two cases:
• Topical application (treatment of skin disease). No
critical issues here; often preferable to systemic therapy
(high local drug concentrations,minimal side effectson
the rest of the body).
• Dermal application for systemic use.
– Uptake typicallyslowand inefficient(Mother Nature
gave us skin as a barrier,not as a conductor).Notable
exception: very hydrophobic compounds (organic
solvents, nerve gases).
– Retarded uptake can be utilized for sustaining pro-
longed, slow delivery (example: Nicotine for wean-
ing smokers)
Mucosal application exploits the fact that, compared to the
skin, the barrier is much thinner. Moreover, the veins un-
derlying the mucous membranes in the two favorite places
(nose and rectum) are not drained into the liver – i.e., the
first pass effect can be circumvented. Examples:
1. Nose: Cocaine, antidiuretic hormone (ADH). ADH
is a peptide – so even peptides can make it across the
mucosa
2. Rectum: Acetaminophen. Rectal application will in-
crease the bioavailability of this drug as compared to
oral uptake, because the first pass effect is absent.
1
Pulmonal application (Figure 2.4) has two modes:
• Gaseous drugs reach the alveoli. This mainly applies to
inhalation anesthetics(chloroform,ether,N
2
O,and their
more modern replacements). Very rapid transition into
the bloodstream – very rapid onset of action.
• Non-gaseous drugs can be conveyed by aerosols. The
droplets are actually deposited in the bronchi but do not
reach the alveoli (topical / mucosal application). Exam-
trachea
bronchial tree
alveoli
capillaries
Figure 2.4.
Schematic of gas exchange in the human lung. The
distance for diffusion is a mere ~20 µm. The total surface area
available for exchange is about 80 m
2
. Exchange of oxygen, CO
2
and ‘drug’gases such as narcotics is therefore very fast.
1
More precisely, diminished – the rectum is not drained toward the liver
at its very end, but a few centimeters above it is.
12
Chapter 2. Pharmacokinetics
ple: Steroids for asthma therapy (asthma is an affliction
of the bronchi).
Pulmonic absorption is very fast – just like the exchange of
oxygen and carbon dioxide. An adult’s lung has a full 80
m
2
of exchange-active area.
2.2. Drug distribution
Once the drug hasentered the systemic circulation,it needs
to reach its target site. Target sites may be located in vari-
ous compartments:
1. Within the blood vessels. Example: blood coagulation
/ clot dissolution. No problems of distribution here,
drug molecules of any sizeand shape can be used (when
intravenously applied).
2. In the organ tissue, outside the blood vessels, but extra-
cellular or superficially exposed on the cell surface. Ex-
ample: Most receptors for hormones and transmitters.
3. In the organ tissue, intracellularly located. Example:
Many enzyme inhibitors.
2.2.1. Vascular permeability;the blood brain barrier
An important factor in the distribution of drugs is the per-
meability of the capillaries. Capillaries are the microscop-
ically small blood vessels across the very thin walls of
which metabolites and gases are exchanged between blood
and tissues. Capillarieshave a cellular layer – the endothe-
lium,supported bya basalmembraneconsistingof proteins
and proteoglycans (Figure microcirculation).
In the general circulation, the endothelial cells have gaps
between them (and sometimes fenestrations across individ-
ual cells, to the same effect). The permeability then is de-
termined by the sieving properties of the basal membrane,
which permits diffusion of salts,small molecules,and even
some proteins, although most plasma proteins are retained.
This type of capillary does not present a barrier to the dis-
tribution of most drugs. However, in the brain and spinal
chord (the central nervous system, CNS), the endothelial
cells are tightly connected by structures called ‘tight junc-
tions’and do not have fenestrations. In addition, a second
contiguouscellular layer isformed aroundthecapillariesby
the glia cells. This adds up to four cell membranes layered
in series – a structure that is referred to as the
blood brain
barrier
. Therefore,even small molecules cannot freely mi-
grate into the brain tissue – or only so, if they are extraordi-
narily membrane-permeant.
Additional cell membrane barriers(plasma membrane,and
possibly organelle membranes) will have to be overcome
if the drug target is located intracellularly. It thus turns out
Artery Arteriole Capillary Venule
Basal membrane
(porous)
Endothelial cell
Astrocyte
Tight junction
a)
b) c)
Figure 2.5.
Anatomic features of the microcirculation. a:
Overview. Arteries branch into arterioles, which are important
in the regulation of blood pressure (see later).From the arterioles,
capillaries branch off. Here, gas and metabolite exchange takes
place; accordingly, capillaries have very thin vessel walls. They
emptyinto venules,whichmergeintolarger veins. b,c: Capillary
wall structure. In the general circulation (b),the endothelial cells
have gapsbetweenthem. The only barrieristhe basal membrane,
which isreadily permeable to smallmolecules. In contrast,in the
central nervous system (c) the endothelium is tightly sealed, and
the astrocytes form another tight seal around the exterior circum-
ference.
that cell membranes are of major importance as barriers
toward drug distribution.
2.2.2. Drug hydrophobicity and permeation across
membranes
Figure 2.6a shows the general structure of a lipid bilayer
(yawn). The obstacle to drug diffusion is the hydrophobic
core of the membrane. Substances that are lipophilic will
traverse the membrane more easily, because they readily
partition into this hydrophobic compartment (Figure 2.6b).
The lipid solubility of an organic molecule is influenced
in predictable ways by the functional groups it contains.
Charged and polar moietieswill reduce lipid solubility,and
therefore render the drug molecules less membrane-perme-
ant. Fig. 2.7a shows some examples.
To increaselipid solubility, a drug maybe applied as a ‘pro-
drug’ that has some hydrophilic groups masked by more
2.2. Drug distribution
13
P O
O
O
CH
3
O
O
CH
3
O
O
O
N
+
C
H
3
CH
3
CH
3
hydrophobic
phase
hydrophilic
phase
hydrophilic
phase
a)
b)
Figure 2.6.
The role of lipid membranes in drug distribution. a:
Structure of phosphatidylcholine (left), and schematic of a lipid
bilayer (right). The hydrophobic interior phase represents the ki-
netic barrier to drug absorption and distribution. b: Drug diffu-
sion across lipid bilayers. Partition into the bilayer is the rate-
limitingstep. Hydrophilicdrugmolecules(left)willnot efficient-
ly partition into the hydrophobic phase and therefore can’t get
across the membrane easily. In contrast, hydrophobic molecules
(right) will enter the membrane readily and therefore will cross
the membrane more efficiently.
hydrophobic ones. An exampleis bacampicillin,which is a
derivative of the antibiotic ampicillin (Figure 2.7b). Ester-
ification of the carboxylic acid in ampicillin facilitates up-
take from the gut lumen. Esterasespresent in the intestinal
mucosal cells will cleave the ester and release ampicillin,
which is then passed on into the circulation.
Masking hydrophilic groups also enhances the uptake of
drugs into the brain. A classical example is heroin, which
is the diacetylated derivative of morphine (Figure 2.7c).
Ironically, heroin was invented in an attempt to overcome
the addictive effects of morphine. Methadone was later
invented to avoid those of heroin.
Another strategy to improve the membrane permeant prop-
erties of a drug is based on the effect of ‘non-ionic diffu-
sion’. An example is provided by the two ‘ganglion-block-
ing’agents hexamethonium and mecamylamine, which act
as antagonists at certain receptors of the transmitter acetyl-
R CH
3
R
R
O
O R
R
O
O
R CH
2
OH
R N
+
Improve lipid
solubility:
Decrease lipid
solubility:
a)
NH
2
O
N
H
N
S
O
CH
3
CH
3
O
O
NH
2
O
N
H
N
S
O
CH
3
CH
3
O
O
CH
3
O
O
C
H
2
CH
3
b)
O
N
CH
3
OH
O
O
N
CH
3
O
O
CH
3
O
O
CH
3
c)
Figure 2.7.
The role of functional groups in drug distribution. a:
Some functional groups in drug molecules that affect lipid sol-
ubility and membrane permeability. b: Ampicillin (top) and its
‘resorption ester’bacampicillin (bottom).The pro-drug bacampi-
cillin is cleaved to release ampicillin after intestinal uptake. c:
Morphine (left) and heroin (right). The acetyl groups facilitate
distribution into the central nervous system, where they will be
cleaved off.
choline (Figure 2.8a) and were formerly used as antihyper-
tensive agents. Acetylcholine is a quaternary amine; so is
hexamethonium. Asa (dual)quaternaryamine,hexametho-
nium is not able to traverse membranes and thus can only
beapplied intravenously. Mecamylamine,however,isa ter-
tiary amine and canadopt an uncharged (though pharmaco-
logicallyinactive)formthattraversesmembraneswithease.
Having reached its target site, it can change back into the
charged form and exert its effect. It can therefore be orally
applied.
Non-ionic diffusion can also produce unwanted effects,
as in the case of aspirin (acetylsalicylic acid; figure 2.8b).
In the acidic milieu of the stomach, this molecule will be
protonated and thus uncharged, which promotes its diffu-
sion into the cells of the stomach mucous membrane. In-
side the cell,the pH is very close to neutral,which will lead
to deprotonation of aspirin. Diffusion of the deprotonated
(charged)form out of the cell will be much slower than en-
try, so that aspirin will accumulate inside the cells to con-
14
Chapter 2. Pharmacokinetics
C
H
3
N
+
CH
3
CH
3
CH
2
CH
2
CH
2
CH
2
CH
2
CH
2
N
+
C
H
3
CH
3
CH
3
C
H
3
CH
3
CH
3
N
H
CH
3
C
H
3
CH
3
CH
3
NH
2
+
CH
3
H
+
O
OH
O
O
CH
3
O
O
O
O
CH
3
O
OH
O
O
CH
3
O
O
O
O
CH
3
pH ≈ 2
H
+
(pH ≈ 7)
H
+
a)
b)
CH
3
N
+
CH
3
CH
3
CH
2
CH
2
O C
O
CH
3
Figure 2.8.
Non-ionic diffusion in drug distribution. a: Struc-
tures of acetylcholine and of its two antagonists hexamethonium
and mecamylamine. Diffusion is facile in the non-ionic form
(bottom left), whereas receptor binding requires the positive
chargeof theprotonated state. b: Acetylsalicylicacidisprotonat-
ed in theacidic milieu of thestomach(left)and then enterstheep-
ithelial cells by non-ionic diffusion. Deprotonation at the higher
intracellular pH leads to accumulation inside the cells.
centrations considerably higher than in the stomach lumen.
Aspirin, compared to other drugs that share its mechanism
of action (inhibition of cyclooxygenase; see later), has a
stronger tendency to trigger side effects such as gastritis
and gastric or duodenal ulcera.
Molecular size is another factor that is relevant to the ease
of membrane permeation. This may be illustrated by com-
paring dimethylether (which crossesmembranesreadily)to
polyethyleneglycol, which may formally be considered a
linear polymer of dimethylether (Figure 2.9). PEG is quite
efficiently excluded by membranes,particularly in its high-
er molecular weight varieties. It needs to be pointed out,
however, that this example is not entirely valid: PEG is
not only larger than dimethylether is but – for some subtle
C
H
3
O
C
H
3
O
O
O
O
C
H
3
C
H
3
Figure 2.9.
Structures of dimethylether and of PEG, which
formally (though not in practice) is a polymer of dimethylether.
Only the former is membrane-permeant.
reason even our renowned polymer chemist Jean Duhamel
was not sure about either – it is also more polar.
2.2.3. L-DOPA as an example of drug distribution
facilitated by specific transport
Another strategy to overcome membrane barriers is ex-
emplified by DOPA (dihydroxyphenylalanine), the precur-
sor of dopamine (Figure 2.10). Dopamine is lacking in the
brain in Parkinson’s disease. If dopamine itself is applied
as a drug, it will not be able to cross the blood brain bar-
rier. Although its precursor DOPA is too polar as well to
cross the membrane by means of non-specific permeation,
it can take advantage of the limited specificity of the aro-
matic amino acid transporter. This transporter is found in
the membranesthat make up the blood brain barrier,and its
function consists in keeping the brain supplied with pheny-
lalanine, tyrosine, and tryptophan. Evidently, this strategy
can be applied only in exceptional cases.
2.2.4. The ‘volume of distribution’
After their uptake into the systemic circulation, drugs
are distributed between different compartments. These
compartments are usually summed up as follows (Figure
2.11a):
The ‘interstitial volume’ is the extracellular volume out-
side of the blood vessels. Note that it is three times larger
than the intravascular volume! While itsionic composition
closely resembles that of blood plasma (with which it is in
equilibrium for allsmall solutesthat arenot protein-bound),
it has a considerably lower protein content.
Body fat isan important reservoir for lipophilicdrugs. This
volume is more variable than the other ones, so no general
volume fraction can be given. However,valuesin the range
of 5-15% are not uncommon.
Few drugs are evenly distributed among these compart-
ments. Factors that will affect the equilibrium distribution
include:
2.2. Drug distribution
15
Blood
Brain tissue
C
H
2
N
H
3
+
C
H
2
C
H
C
H
C
H
O
H
O
H
C
H
C
O
O
-
N
H
3
+
C
H
2
C
H
C
H
C
H
O
H
O
H
×
CO
2
DOPA
Dopamine
C
H
2
N
H
3
+
C
H
2
C
H
C
H
C
H
O
H
O
H
C
H
C
O
O
-
N
H
3
+
C
H
2
C
H
C
H
C
H
O
H
O
H
Figure 2.10.
Diffusion of DOPA across the blood brain barrier
by way of the aromatic amino acid transporter. In the brain,
DOPA is decarboxylated to dopamine.
• Membrane-impermeant drugswill be excluded from the
intracellular volume (Example: Lithium,which largely
resembles sodium in its distribution)
• Lipophilicdrugswillbe enriched in the fat tissue(exam-
ple: Thiopental – see later)
• Drugs with a high degree of protein binding will be
more enriched in the plasma (i.e., the intravascular vol-
ume) than in the interstitial fluid
An uneven distribution between the intravascular and the
(combined)extravascular spacesimplies that wecannot use
the plasma concentration of a drug as an immediate mea-
sure of the total amount in the body. To correct for uneven
distribution, a coefficient named ‘volume of distribution’
(V
d
) has been invented (Figure 2.11a).Thisis not a realvol-
ume but an experimentally determined number (with the
dimension of a volume, hence the fancy name).
2.2.5. Protein binding
A factor that favours retention of a drug in the intravascu-
lar volume (at least in the short term) is the binding of the
drug to proteins (Figure 2.12), particularly albumin. Pro-
tein binding is usually more pronounced with hydrophobic
drug molecules, which are often bound to
>
90% of their
total concentration in the blood plasma. Albumin is by far
the most abundant single plasma protein. Moreover, each
albumin molecule affordsmultiple drug bindingsites;these
do not only bind drugs but also fatty acids, which prevents
toxic effects of the fatty acids on cell membranes.
Protein binding is usually rapidly reversible, so that the
bound fraction is not ‘lost ’– it can yet dissociate and bind
to some drug target subsequently. However, one important
consequence of plasma protein binding is that it will pre-
Interstitial volume (15%)
Intravascular
volume (5%)
Intracellular
volume
(40%)
Body fat (several %)
Drug plasma concentration
V
d
=
Amount of drug in the body
Lipophilic drugs: V
d
> total
available volume
Extracellularly confined drugs:
V
d
< total available volume
Intravascularly confined drugs:
V
d
<< total available volume
a)
b)
Figure 2.11.
a: Compartmentsof drug distribution. Percentages
are relative to total body volume. Note that they don’t add up to
100%, as the volume taken by bone matrix, muscle proteins etc.
is not available for solute (drug) distribution. b: The ‘volume
of distribution’ (V
d
). From its definition, we can see that it will
be low for those drugs that are prevented from leaving the blood
stream (bottom) or from partitioning into cells (center). It will
be very high, often much higher than the real body volume, for
lipophilic drugs that accumulate in the fat tissue.
vent glomerular filtration of the drug in the kidneys,which
is an important step in drug excretion (see below).
2.2.6. Kinetics of drug distribution
The above considerations on drug partitioning mainly ap-
ply to the equilibrium of drug distribution. However, it is
important to realize that it may take some time until a drug
that is applied rapidly (e.g., by injection or inhalation) ac-
tually reaches equilibrium. A practically important exam-
ple of non-equilibrium distribution is provided by the drug
thiopental, which is a barbiturate used for short-duration
narcosis (Figure 2.13).
Thiopental is a very lipophilic drug that readily crosses
the blood brain barrier. Very shortly after injection, the
concentration in the brain peaks, and for a few minutes the
16
Chapter 2. Pharmacokinetics
Figure 2.12.
Schematic of drugs binding to proteins. Soluble
proteins (such as blood plasma proteins) usually have a largely
hydrophilic shell with some hydrophobic patches and crevices to
which hydrophobicdrug moleculeswill tend to bind. Albumin is
the single most important protein contributing to drug binding.
level is high enough to effect narcosis. This is due, among
other things, to the fact that the brain receives a very large
fraction of the cardiac output (~20%).
However,after a short time, the drug leaves the brain again
and accumulates in the lean tissues (such as muscle), from
where it finally redistributes to the body fat. This reflects
that the fat provides the most favourable (lipophilic) en-
vironment; however, since it is only weakly perfused, sub-
stance exchange works more slowly than with the other tis-
sues. Notethat,in thisparticular case,drugaction isnot ter-
minated by elimination of the drug (as is usually the case),
but solely by its redistribution from the site of action (the
brain) to inert reservoirs (muscle / fat). Ultimate elimina-
tion is very slow – it takes days to complete – and involves
hepatic metabolism of the drug, followed by urinary ex-
cretion.
0
20
40
60
80
100
0.1
1
10
100
1000
Blood
Brain
Lean tissues
Fat
N
H
N
H
S
O
O
C
H
3
C
H
3
C
H
3
Time after intravenous application (min.)
Fractional
distribution
(%)
Figure 2.13.
Kinetics of thiopental distribution. Thiopental is a
very hydrophobic barbiturate that is used for transient narcosis.
Duration of the narcosis is limited by redistribution of thiopental
from the brain to other body compartments (which is very fast)
rather than elimination of the drug (which is very slow).
2.3. Drug elimination: Kidneys
Ultimately, most drugs are eliminated from the body via
the kidney. As a rule of thumb, drugs can be directly elim-
inated there if they are hydrophilic; hydrophobic drug
molecules are typically metabolized to more hydrophilic
derivatives in the liver before elimination (Figure 2.14).
To understand drug elimination in the kidney,we first have
to consider some aspects of its structure and function.
2.3.1. Kidney anatomy and function
The kidneys are located close to the aorta (Figure 2.15a)
and, in terms of blood flow / tissue mass, are the most
strongly perfused organ. Urine is ‘distilled’from the blood
in several stages:
1. Filtration: The kidneys are perfused at a rate of ~1.2
l/min. Approximately 10% of the blood plasma vol-
ume is squeezed across a filtering membrane that re-
tains most macromolecules but lets through small
molecules.
2. Re-absorption: Most small solutes – glucose, salts, and
amino acids – are recovered from the filtrate and shut-
tled back into the blood by specific transporters. Water
is recovered by the ensuing osmotic gradient. Some so-
lutes are partially or totally excluded from reuptake.
3. Some substrates are actively secreted from the blood
into the nascent urine.
The kidney tissue has a very intriguing structure. It is orga-
nized into several thousand structural and functional units.
A singleunit – a ‘nephron’(Figure 2.15b)– spansthe better
part of the entire distance between the organ periphery and
the renal pelvis, which simply collects the final urine and
feeds it into the ureters
Urine production starts in the glomerulus (Figure 2.16a,b).
Arterial blood is passed along a flexuous stretch of special-
ized small arteries, the walls of which act as a sieve.
Hydrophilic drug molecule
Kidney
Urine
Hydrophobic drug molecule
Liver
More hydrophilic metabolite
Figure2.14.
Typical pathwaysof elimination of hydrophilicand
hydrophobic drugs
2.3. Drug elimination: Kidneys
17
a)
b)
Figure 2.15.
Kidney anatomy. a: Overview of kidney and uri-
nary tract. Left: Position of the kidneys, ureters, and urinary
bladder within the body. Right: The kidneysareconnected tothe
aorta (red, center, vertical) and the vena cava (blue, center, verti-
cal) by short, wide blood vessels and are strongly perfused. The
ureters(yellow)transport the urine to the urinary bladder. b: The
nephron. Left: Structural elements of the nephron. The yellow
blob with red lines (arterioles)is the glomerulus, which givesrise
to a tubule that has convoluted and straight sections and empties
into a collecting duct. Center: A single nephron, superimposed
on the longitudinal section of a kidney. Right: The true propor-
tions-the nephron hasa very elongated shape;thestraight section
(which is crucial in urine concentration)is very long.
Figure 2.16b shows the structure of the glomerular vessel
wall. The interior is covered by endothelial cells with mul-
tiple holes (’fenestrations’). The podocytes (= ‘foot cells’)
form a likewise discontinuous outer layer. Between them
is an acellular basal membrane, consisting of proteins and
proteoglycans, which has the smallest pore diameter of all
three and therefore, as in any the capillaries found else-
where in the body, represents the effective filter layer. The
filter hasa cut-off sizeof veryfewnanometers,so that most
protein molecules will be retained. Salt ions and small
molecules– if theyare not protein-bound – will be filtrated.
The amount of filtrate produced is about 150 l per day in a
healthy adult; this corresponds to about 1/10 of the blood
plasma volume that passes the kidneys.
The filtrate is funnelled into the tubule that leaves the
glomerulus and passed down all the tubular elements of the
afferent arteriole
efferent arteriole
proximal tubule
Bowman’s capsule
a)
Basal membrane
Endothelial cell with
fenestrations
Podocyte pseudopodia
Filtration slits
Primary filtrate
Blood
b)
Proximal tubule:
Reuptake of
glucose, amino
acids, other
substrates
Proximal tubule: Active
secretion of organic acids,
organic bases
Reuptake /
exchange of
ions;
reuptake of
water
Glomerulus:
Filtration
Distal tubule: Reuptake of
weak organic acids and bases
c)
Collecting
duct
Figure 2.16.
Nephron function. a: Filtration occurs in the
glomerulus. The filtrate is funneled into the tubule. b: Schemat-
ic of the blood vessel wall structure in the glomerulus. Both the
endothelium within and the podocytes outside the arterioles have
slits and fenestrations that are a few nanometers wide. As in the
capillaries elsewhere in the body, the basal membrane functions
as the sieve. c: In the tubule and the collecting duct, the filtrate
is extensively post-processed; water, substrates and ions are re-
absorbed but also actively secreted and exchanged. Tubular pro-
cessing is under hormonal control.
nephron (see Figure 2.15c). It is during this passage that
the volume of the filtrate is trimmed down to the final urine
volume,and the urine composition is changed and adjusted
in accordance with the prevailing physiological situation.
This filtrate post-processing involves both re-absorption
and active secretion bythe epithelialcellsin thetubuli(Fig-
ure 2.16c).
These occur at different segments of the nephron:
18
Chapter 2. Pharmacokinetics
1. Proximal tubule: Reuptake of glucose, amino acids,
bicarbonate; active secretion of uric acid, organic acids,
organic bases (including many drugs).
2. Loop of Henle: Reuptake of salt and water.
3. Distal tubule / collecting duct: Reuptake of salt and
water;adjustment of pH and ion concentrationsto meet
physiological needs;passivereuptakeof weak acidsand
bases (including drugs).
Mechanistically,most small solutes – glucose, salts, amino
acids – are taken up again by specific active transporters.
Active secretion likewise worksby way of active transport.
Typically,one transporter will pick up the substrate in ques-
tion from the interstitial space and move it to the cytosol,
from where a second transporter located in the apical mem-
brane expelsit into the nascent urine (see Figure 2.19).Wa-
ter isrecoveredbytheensuingosmoticeffect. Somesolutes
are partially or totally excluded from reuptake. Note that
the final urine volume is about 100 times smaller than the
primary filtrate. This means that the bulk of the fluid, salt
and metabolites are actually reabsorbed. Some drugs are
subject to reuptake to a similar extent, too.
2.3.2. Filtration, secretion, reuptake
For a solute (drug) that is quantitatively filtrated in the
glomerulus, the extent of excretion is determined by its
membrane permeability (Figure 2.17). If the solute is not
membrane-permeant,it will get more and more concentrat-
ed as the volume of the nascent urine gets reduced along
the tubule; however, the absolute amount of the solute re-
tained will not change. A model compound exemplifying
this behaviour is inulin, a polysaccharideof about 6000 Da
(Figure 2.18). Conversely, a drug that is fairly membrane-
permeant (such as ethanol) would just diffuse back into the
tissue (and, from there, the circulation). Its concentration
in the nascent urine would, at all times, remain in equilib-
rium with the interstitial fluid (which means,constant); the
amount of drug retained in the urine would therefore de-
creaseinproportion tothe urine volume. Itisfor thisreason
that ethanol is not eliminated efficiently by the kidneys but
rather more slowly by the liver. We might pause a moment
to lament this, although the high taxes in Canada suggest
otherwise.
Membrane-permeant drugs are thus not efficiently elim-
inated in the urine, even if they do get filtrated in the
glomeruli. On the other hand, membrane-impermeant
drugsget eliminated in proportion to theextent of glomeru-
lar filtration. Glomerular filtrationthereforeisan important
parameter in the elimination of drugs. It may vary consid-
erably between different patients (example: A patient who
has donated one kidney. Not the most common case of
reduced kidney function but a straightforward one). With
Ions,
H
2
O
Ions, H
2
O,
solute
impermeant
permeant
Fractions retained in
filtrate
Concentrations
Traveled tubule length
a)
b)
c)
Figure 2.17.
The effect of membrane-permeability of drugs on
their reuptake from nascent urine. a: A membrane-impermeant
solute such as inulin will become more and more concentrated
as the urine volume decreases due to water reuptake. Ideally,the
fraction retained in the urine will at all times remain at 100% (c,
left). b: A membrane-permeant solute such as ethanol will sim-
ply equilibrate between tubulus and interstitial fluid; its concen-
tration in the urine will ideally be constant, and the fraction re-
tained will decrease in proportion to the urine volume (c, right).
c: Idealcurvesfor urineconcentrationsand retentionfractionsfor
membrane-permeant and -impermeant drugs.
some drugs,it is important toknow the glomerularfiltration
rate in advance to their clinical application.
An elegant experimental method for its determination uses
inulin (Figure 2.18). Here is how this methods works:
Inulin is freely filtrated in the glomeruli,so that the concen-
tration in the filtrate equals that in the plasma:
2.3. Drug elimination: Kidneys
19
Plasma concentration
Urine concentration, flow rate
Filtrate concentration = plasma concentration
Figure 2.18.
Determination of the inulin clearance. Inulin is
injected intravenously (ideally by way of continuous infusion),
and its concentrations in blood and urine are determined. The
ratio of these concentrations will be inversely proportional to
the urine volume reduction after glomerular filtration;multiplied
by the urine flow, it thus provides an estimate of the glomerular
filtration rate.
(1) c
filtrate
= c
plasma
Inulin is quantitatively retained in the urine, so that the
number of molecules is the same in the filtrate and the fi-
nal urine:
(2) n
filtrate
= n
urine
The number of molecules is the product of concentration
and volume:
(3) c =n/V
⇔
n =c
×
V
therefore, with equation 2:
(4) c
urine
×
V
urine
= c
filtrate
×
V
filtrate
From equations 1, 3 and 4, we see:
(5) V
filtrate
= V
urine
×
c
urine
/ c
filtrate
Therefore, all we need is to apply inulin to a patient by in-
travenousinfusion,collect the urine for a certain amount of
time (typically 24 h), determine the urine and plasma con-
centrations, and apply equation 4 to calculate the volume
that has been filtrated during these 24 hours.
The parameter determined in this experiment:
V
urine
×
c
urine
/ c
plasma
is called the renal ‘clearance’ of inulin. It can of course
also be determined for other solutes.In clinical practice,the
endogenous marker creatinine (a metabolite of creatine,
from muscle tissue)iscommonlyused instead of inulin. Its
characteristics with respect to secretion and retention are
less clear-cut than those of inulin; its clearance therefore
is a less accurate measure of the glomerular filtration rate.
As the basis of an even less accurate estimate, the plasma
concentration of creatinine alone is frequently used, with-
out any actual measurements of urine volume and concen-
tration; the reasoning behind this is that the amount of cre-
atinin produced does usually not vary all that much. This
estimate is then used for determining initial drug dosages,
which may be adjusted according to assays of the plasma
concentrations of the drug itself later on.
Another model substance that is used experimentally for
the assessment of kidney function is para-aminohippuric
acid (p-AH).p-AH appearsin the urine not just by filtration
but mainly by active secretion in the proximal tubule. This
active transport process occurs in two steps (Figure 2.19a):
In the first step,p-AH is exchanged at the basolateral mem-
brane of the proximal tubule cell against
α
-ketoglutarateor
other divalent anions. This exchange isdriven by the mem-
brane potential (the interior of the tubule cell is electrically
negative relative to the outside,as is the case with essential-
ly all cells).
In the second step, p-AH is secreted from the tubule cell
into the tubule lumen. This involves exchange with mono-
valent anions from the filtrate, driven not by charge but by
concentration gradients.
Sincep-AHisnearlyquantitativelyextracted from allblood
plasma that reaches the kidney (the commonly reported
fraction is 92%), its clearance can actually be used to de-
termine the renal flow of blood plasma,without any serious
invasive action. Here is the rationale:
If a certain volume of blood passes through the kidneys,
p-AH is quantitativelytransferredfrom the blood plasma to
the (nascent) urine:
(6) n
plasma (before passage)
= n
urine (after passage)
With equation 3, we get
(7) c
urine
×
V
urine
= c
plasma
×
V
plasma(kidney)
with From equations 6 and 7, we see:
(8) V
plasma(kidney)
= V
urine
×
c
urine
/ c
plasma