Andersons pediatric cardiology 200
Bạn đang xem bản rút gọn của tài liệu. Xem và tải ngay bản đầy đủ của tài liệu tại đây (164.95 KB, 3 trang )
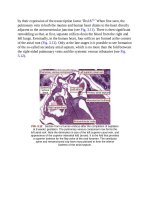
FIG.7.7 FetalT1mapping.TheT1mapshownhereisfromafetalsheep
umbilicalvein(UV).Thisapproachusesaninversionrecoverytechniqueto
quantifytherateofrecoveryofthelongitudinalmagnetizationofblood.
ROI,Regionofinterest.
FIG.7.8 Impactofvariationinoxygensaturationontherelationship
betweenT1andhematocrit(Hct).Reductionsinoxygensaturation(SaO2)
shortenT1.(A)Adultblood.(B)Cordblood.
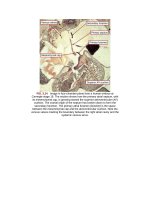
FIG.7.9 Noninvasivequantificationofoxygensaturation(SaO2),
hematocrit(Hct),andbloodoxygencontentusingacombinationofvessel
T1andT2.Thedottedcurverepresentsallofthepossiblecombinationsof
oxygensaturationandhematocritforagivenT2relaxationrate;thevertical
linerepresentsthecombinationsforagivenT1recoveryrate.Thepoint
wherethelinesintersectindicatestheuniquesolutionforoxygensaturation
andhematocritforthiscombinationofT1andT2.
Theaccuracyoftheapproachhasbeenproveninvitro,asdemonstratedbythe
comparisonwithconventionalbloodgasanalysisinFig.7.10.
FIG.7.10 InvitrovalidationofcombinedT1andT2mappingapproachto
thenoninvasivequantificationof(A)hematocrit(Hct)and(B)fetaloxygen
saturation(SaO2).Humanumbilicalcordbloodtakenfromelective
cesariansectionswasmanipulatedthrougharangeofoxygensaturations
throughgradedexposuretonitrogengasand
hemodiluted/hemoconcentratedtoproducearangeofhematocrits.
Solutionsforhematocritandoxygensaturationbasedonmagnetic
resonancerelaxometrywerecomparedwithconventionalbloodgas
analysis.