Andersons pediatric cardiology 199
Bạn đang xem bản rút gọn của tài liệu. Xem và tải ngay bản đầy đủ của tài liệu tại đây (176.39 KB, 3 trang )
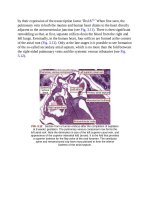
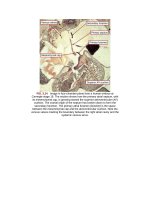
FIG.7.3 FetalmagneticresonanceoximetryusingT2mapping.Thetop
panelrevealstheindividualT2preparationimagestargetingthe
descendingaortaofanormallate-gestationfetus.Thesignalintensityfrom
withinthevesselisplottedagainsttheintervalbetweentheexcitationand
echo(T2preparationtime),yieldingaT2decaycurve(bottomleft).Oxygen
saturation(SaO2)canbecalculatedfromthecorrespondingT2timebased
ontherelationshipshown(bottomright).a.u.,Arbitraryunits.
FIG.7.4 FetalT2mapping.(A)Imagingplanesfortargetingshort-axis
imagesoftheumbilicalveinanddescendingaorta.(B)AcorrespondingT2
map,whichshowsthehighersignalintheumbilicalveinthandescending
aorta,indicatingthehigheroxygensaturationinthebloodreturningfrom
theplacentacomparedwithbloodsuppliedtotheplacentabythefetus.
FIG.7.5 ValidationofT2mappinginvivo.VesselT2wasmeasuredusing
T2mappingandcomparedwithconventionalbloodgasanalysisof
samplestakenfromindwellingvascularcathetersinthepregnanteweand
sheepfetus,showingasimilarrelationshiptotheinvitrohumancalibration
showninFig.7.3.
ToenhancetheaccuracyofhumanfetalMRoximetry,themagneticproperties
ofhumanfetalbloodhavebeencharacterizedat1.5and3Tusinginvitro
preparationsofumbilicalcordbloodobtainedfromelectivecaesariansections
andpreparedthrougharangeofoxygensaturationsthroughgradedexposureto
nitrogengas.TheT2ofhumanfetalbloodisslightlylongerthanadultblood.
ImportantlytherelationshipbetweenT2andoxygensaturationisdependenton
hematocrit.13Thisisanalogoustoclinicalcyanosis,whichismuchmoreobvious
inthesettingofpolycythemiabecauseofthegreateramountof
deoxyhemoglobininthebloodforthesamedegreeofdesaturation.Theeffectof
changesinhematocritontherelationshipbetweenT2andoxygensaturationis
showninFig.7.6.Thus,toperformaccurateoximetrybasedonT2mapping,it
isnecessarytoquantifyhematocrit.Thequantificationofhematocritalsoallows
foranaccuratemeasurementoftheoxygencontentofblood.Tomeasure
hematocrit,therelationshipbetweentheT1recoveryofbloodanditshematocrit
canbeutilized.T1issimilartoT2inthatitrepresentsanotherfundamental
magneticproperty,thistimedescribingitslongitudinalmagnetizationrecovery.
TheT1ofbloodcanbemeasuredinasimilarfashiontothewaywemeasureT2,
bymakingaseriesofimageswithdifferentintervalsbetweenandinversionof
themagnetizationofthebloodandthequantificationofitssignal.AT1recovery
curveforbloodisshowninFig.7.7.However,whiletheT2ofbloodismainly
dependentonoxygensaturationbutalsoinfluencedbyhematocrit,theT1of
bloodismainlydependentonhematocritbutalsoinfluencedbyitssaturation.
TheeffectofvariationinoxygensaturationontherelationshipbetweenT1and
hematocritareshowninFig.7.8.13Usingacubicpolynomialsolution,itis
possibletocalculatebothoxygensaturationandhematocritofabloodsample
fromacombinationofitsT1andT2.14ThisisillustratedbythegraphinFig.
7.9,wherethesemicircularlinerepresentsallofthepossiblecombinationsof
oxygensaturationandhematocritforagivenR2,whereR2istheT2relaxation
rateor1/T2.Theverticallinerepresentsallthepossiblecombinationsofoxygen
saturationandhematocritforagivenR1,whereR1istheT1relaxationrateor
1/T1.Thepointatwhichthelinesintersectistheonlypossiblesolutionfor
hematocritandoxygensaturationforthisparticularcombinationofR1andR2.
Thereforethisapproachyieldsbloodoxygensaturation,hematocrit,andoxygen
content(ignoringoxygendissolvedinplasma),where:
FIG.7.6 ImpactofvariationinhematocritontherelationshipbetweenT2
andoxygensaturation(SaO2).Withincreasesinhematocrit(Hct),T2
shortens.Thisistrueforadulthumanblood(A)andfetalblood(B).