Andersons pediatric cardiology 198
Bạn đang xem bản rút gọn của tài liệu. Xem và tải ngay bản đầy đủ của tài liệu tại đây (159.79 KB, 3 trang )
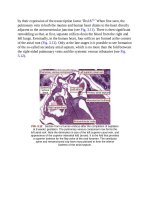
FIG.7.1 Metricoptimizedgating.Thecolorsrepresentthecardiacphases
andthenumbersrepresentthelinesofdatacomprisingthemagnetic
resonanceimage.Anartificialtriggerisusedtocollectgatedimagingdata.
Initiallythereisamisgatingartifact,representedbytheblurringofcolorsin
thefinalimages.Afteriterativereconstructionwheresuperfluousimaging
dataarediscarded,thereconstructionmatchestheR-Rintervalthatwas
presentduringtheacquisition,representedbytheuniformcolorsinthefinal
images.Thecorrectreconstructionwasidentifiedthroughthelackof
artifactintheresultingimages.
FIG.7.2 Humanfetalcinephasecontrastmagneticresonanceimaging
withmetricoptimizedgating.(A)Imagingplane(shortaxisofascending
aorta).(B)Midsystolicphasefromthecine,withanatomicimagesonthe
leftandvelocityencodedinformationontheright.(C)Flowcurves
generatedfromthephasedata.Thecomparisonbetween1.5and3.0T
revealsimprovedsignal-to-noiseratio(SNR),althoughtheflow
quantificationissimilar.AAo,Ascendingaorta;DAo,descendingaorta;
MPA,mainpulmonaryartery;RV,rightventricle.
MagneticResonanceOximetry
MRoximetryexploitsthedifferentmagneticpropertiesofoxygenatedand
deoxygenatedhemoglobin,wherebythetransverseorT2relaxationtimeofthe
MRIsignalreturnedfrombloodisproportionaltoitsoxygensaturation.TheT2
ofbloodcanbemeasuredusinganapproachcalledT2mapping.Aseriesof
imagesofthebloodvesselsareobtainedwithdifferentintervalsbetweenthe
excitationofthetissuesandthemeasurementsofthereturningsignal,asshown
inFig.7.3.Withincreasingintervalsbetweenexcitationandecho,thesignal
returnedfromtheblooddecreasesinanexponentialmannerwithtimeconstant
T2.Byplottingthesignalintensityagainstthetimeinterval,orT2preparation
time,theT2curveanditstimeconstantT2canbeobtained.Theuseofadequate
spatialresolutionandaccurateprescriptionoftheimagingplaneintheshortaxis
ofthevesselarealsocriticaltoavoidcontaminationofthesignalbeingreturned
bybloodwithsignalfromthetissuessurroundingthevesselofinterest.Fig.7.4
showsanexampleofaT2mapmadeinanormallate-gestationhumanfetus
showingrecommendedimagingplanesfortheumbilicalveinanddescending
aorta.Thesignalishigherintheumbilicalveinthanthedescendingaorta,
reflectingthehigheroxygensaturationinthebloodreturningfromtheplacenta
comparedwiththebloodbeingsuppliedtotheplacenta.Inalate-gestationfetus
thelargervesselscanbeimagedusinganin-planeresolutionof1.5×1.5mm
andaslicethicknessof8mm,providingamplesignal-to-noiseratio.Forsmaller
andmoretortuousvessels,higherresolutionisideal,althoughthismay
compromisesignal-to-noiseratio.However,wehavedemonstratedthe
reproducibilityofMRoximetrybasedonT2mappinginhumanfetalvessels
withadiameterof5mmormore.12Infetalsheep,inwhichmovementartifacts
canbeovercomeusinggeneralanesthesia,wehavedemonstratedahighdegree
ofcorrelationbetweenvesselT2andoxygensaturationmeasuredusing
conventionalbloodgasanalysisofsamplescollectedusingintravascular
catheters,asshowninFig.7.5.
