raman-signal-enhancement-by-quasi-fractal-geometries-of-gold-nanoparticles
Bạn đang xem bản rút gọn của tài liệu. Xem và tải ngay bản đầy đủ của tài liệu tại đây (887.22 KB, 24 trang )
Raman Signal Enhancement by QuasiFractal Geometries of Gold Nanoparticles
Richard E. Darienzo, Tatsiana Mironava and Rina Tannenbaum*
Biomedical Nanomaterials Research Laboratory, Department of Materials Science and Chemical
Engineering, Stony Brook University, Stony Brook, NY 11794, USA
Abstract
The synthesis of star-like gold nanoparticles (SGNs) in a temperature-controlled environment
allows for temperature modulation and facilitates the growth of highly branched nanoparticles. By
increasing the synthesis temperature, the level of branching increases as well. These highly
branched features represent a distinctly novel, quasi-fractal nanoparticle morphology, referred to
herein as gold nano caltrops (GNC). The increased surface roughness, local curvature and degree
of inhomogeneity of GNC lend themselves to generating improved enhancement of the scattering
signals in surface-enhanced Raman spectroscopy (SERS) via a mechanism in which the localized
surface plasmon sites, or “hot spots,” provide the engine for the signal amplification, rather than
the more conventional surface plasmon. Here, the synthesis procedure and the surface-enhancing
capabilities of GNC are described and discussed in comparison with SGN.
Keywords: Gold nanoparticles, surface-enhanced Raman scattering, particle morphology
*Corresponding author: Rina Tannenbaum, Email: , Tel:
(631) 632 4392, Fax: (631) 632 8052
1. Introduction
Raman spectroscopy is a non-destructive and sensitive technique that could be used,
among a multitude of applications, for the exploration of the structure and chemical composition
of biological materials [1-5]. It can constitute an effective tool for the delineation of cancer
tissue, histological analysis of biopsies, in vivo detection of tumors and intraoperative imaging
[6-9]. Raman spectroscopy is based on the inelastic scattering of monochromatic light upon
interaction with molecular vibrations, phonons and other excitations, generating shifts in the
energy of the incident light. The shift in energy gives information about the vibrational modes of
the molecules in the system [10,11]. Each molecule in a given system exhibits a precise set of
vibrational modes, depending on their chemical composition, chemical environment and spatial
organization. These vibrational modes constitute the fingerprints of the given system, and allow
the identification of molecular species in the system and their interactions. Raman microscopy
for biological and medical specimens generally uses near infrared (NIR) lasers (e.g. 785 nm
laser), which reduces the risk of damaging the specimen by applying higher energy wavelengths
and practically eliminates fluorescence [12-19].
In order to make the technique better suited for such biological applications, the surfaceenhanced Raman scattering (SERS) technique, a variation of the original method, is particularly
suitable [20-24]. This technique is based on the introduction of a rough metallic (e.g., Ag, Au or
Cu) surface [25-31], usually achieved by the presence of nanoparticles, which enhances the
sensitivity of the measurement by at least 1010 and up to 1017 fold, depending on the type of
nanoparticles, molecules probed, chemical and biological environment and incident light
frequency [32-35]. The enhanced scattering effect is due to the excitation of the localized surface
plasmons in the nanoparticles and the resulting interactions between the oscillations that are
perpendicular to the surface and any molecules that are either physisorbed or chemisorbed on the
surface. The closer the resonance of the incident light and the Raman signal are with the plasmon
frequency, the higher the electric field amplification and the larger the enhancement.
In order to develop an imaging modality with a broad range of applications across various
types of cancer tissues, the surface-enhancing nanoparticles must be chosen to provide a high
level of signal resolution and scattering enhancement [36-39]. Gold nanospheres have shown to
provide low and unstable enhancement levels, varying widely among individual particles and
exhibiting susceptibility to environmental fluctuations [40]. Hence, the local fields associated
with the excitation of surface plasmon resonances by the Raman source may not be the only
mechanism responsible for the enhancement observed with metal nanoparticles. More recent
explanations of the SERS effects by metal nanoparticles are based not only on intrinsic
nanoparticle surface plasmons, but also on the presence of local field “hotspots” [41] due to
surface roughness [42], nanoscale voids between aggregated metallic nanoparticles [43], or
nanoscale gaps between nanoparticles and a metal surface [44,45]. The SERS contribution of
such hotspots can actually dominate the observed response [46]. An alternative way to increase
the local electromagnetic field associated with the surface plasmon resonance would be to
increase the local curvature of nanomaterials through the development of nanoscale surface
inhomogeneities. For example, it was estimated that the vertices of silver nanotriangles exhibited
10 to 100 fold higher field strength compared to the surface of silver nanospheres of similar
relative size [47]. Star-like gold nanoparticles (SGN), a new class of gold nanoparticle having
sharp edges and tips, have been shown to exhibit a very high sensitivity to local changes in the
dielectric environment, as well as larger enhancements of the electric field around the
nanoparticles [47,38], as compared with similar, less structurally-convoluted nanoparticles.
Similar results have been found for other nanoparticles with sharp features [39,48,49].
Based on these observations, our aim in this work was to develop various geometrical
permutations of gold nanoparticles in addition to spheres and stars, and investigate their surfaceenhancing Raman capabilities. These structural variations yielded a novel particle geometry
comprised of quasi-fractal branches, which we refer to as gold nano-caltrops (GNC). The
underlying premise was that the extent of branching and the size of these nanoparticles would be
closely correlated to their scattering ability. The gold nanoparticles were synthesized via the
reduction of HAuCl4 by hydroquinone [38]. The new quasi-fractal structure was achieved by
varying the reaction temperature during synthesis. The first fractal branching features were
observed at the reaction temperatures of 45 ºC and became more pronounced as the reaction
temperature was increased. Hence, we used the reaction temperature as a design parameter for
the control of the extent of fractal branching in gold nano-caltrops, and by association, in their
expected Raman enhancement capabilities.
2. Experimental
2.1. Nanoparticle Synthesis
All chemicals for the nanoparticle synthesis were purchased from Sigma Aldrich (St.
Louis, MO). De-ionized water was obtained from a Millipore (Billerica, MA) Direct Q3 water
filtration system. The synthesis was carried out in a three-neck flask fitted with a condenser to
create a reflux system. The flask was filled with 10 mL of an aqueous 0.013 mM HAuCl4
solution (9 µL of a 1:10 dilution of an original 30 wt.% HAuCl4 in dilute HCl solution, placed in
10 mL de-ionized water), followed by the injection of 100 µL of an 11 mg/mL solution of
hydroquinone, C6H4(OH)2 [38,49,50]. Within minutes, the reaction mixture changed in color
from pale yellow to light blue, indicating the formation of nanostructures. After 5 minutes of
mixing, 20 µL of 10 mg/mL sodium citrate tribasic dehydrate, Na3C6H5O7·2H2O, was added to
increase the long-term stability of the nanoparticles [38].
The reaction conditions were controlled by changing the temperature of the water bath by
10 ºC increments in the range from 25 ºC to 75 ºC. The particles synthesized at 65 ºC were
placed in a water bath and held at approximately 8 ºC for 15 minutes before being allowed to
reach room temperature.
2.2. Characterization Techniques
UV-Vis Spectroscopy: The absorption profiles of the “as synthesized” nanoparticle
suspensions were analyzed with a ThermoFisher Scientific Evolution 220 Ultraviolet-Visible
Spectrometer (UV-Vis). Nanoparticle suspensions were first stirred vigorously before aliquots
were deposited into a quartz cuvette (VWR, Radnor, PA). Spectra were obtained over the range
of 190-1100 nm at room temperature.
Electron Microscopy: A 5 µL aliquot of a nanoparticle sample was deposited on a copper
grid (Ted Pella, Formvar/carbon 400 mesh, Redding, CA) and allowed to dry overnight. The
grids were used for both transmission and scanning electron microscopy imaging experiments.
Transmission electron microscopy (TEM) and scanning electron microscopy (SEM) experiments
were performed on a JEOL JEM-1400 electron microscope at 120.0 kV and JEOL JSM-7600F
field emission SEM at 5.0 kV, respectively.
Particle size analysis: Dynamic light scattering (DLS) measurements were performed on
a Malvern Zetasizer (Nano-ZS) at 25.0 ºC with the refractive index and absorption parameters set
to 1.400 and 0.100, respectively. Samples were prepared by a 1:100 dilution of the original
suspensions. Particle size was calculated as the average of three independent measurements.
TEM micrographs were used to evaluate particle size as well. The average nanoparticle
sizes were evaluated by calculating the log mean average of the core and outer spike radii of
each nanoparticle, followed by number-averaging over the entire nanoparticle population on the
micrographs used.
Raman spectroscopy: Substrates for surface enhanced Raman Spectroscopy (SERS)
experiments were prepared using pre-cut p-type (boron) silicon wafers (Ted Pella, 5x5mm
diced). Silicon sections were thoroughly washed in a 1:100 (v/v) solution of 37 % HCl (Fisher
Scientific) with 70 % ethanol (Fisher Scientific). The sections were then rinsed with copious
amounts of deionized water and allowed to dry. The clean and dry silicon sections were next
placed in a 0.01 % (w/v) poly-L-lysine solution (Sigma Aldrich) for 5 minutes. After that, the
silicon sections were placed in a 60 ºC oven for 1 hour to dry. The silicon sections were then
submerged in nanoparticle suspensions and allowed to incubate for 24 hours at room temperature
before being removed and allowed to dry. Fifteen µL aliquots of 5.2·10-4 mg/mL malachite green
(MG) dye (Sigma Aldrich) solution was then applied to the samples by drop casting. SERS
measurements were performed on a HORIBA XploRA PLUS Raman microscope with a
Marhauzer motorized stage. Spectra were collected utilizing a 638 nm laser at 1% laser power,
600 gr/mm grating, 100 µm hole, 50 µm slit, and with a 0.5 sec acquisition time with 1
acquisition per step and 100X objective. Data for each sample was obtained from three maps,
measuring 16x16 µm2 with a step size of 0.2 µm totaling 80x80 steps, which were chosen at
random. A contour area of 5x5 µm2 was placed at the location where the highest intensity Raman
signal was detected, and all the spectra contained therein were averaged. This process was
repeated for each of the three maps generated from each sample and then averaged together in
order to better portray the average Raman enhancement provided by each sample [38]. Collected
spectra were then processed identically to remove fluorescence and cosmic rays by first
extracting the data over the range of 150 – 2000 cm-1, followed by the subtraction of a 9th degree
polynomial background from each spectrum.
3. Results and Discussion
3.1. Particle size and geometry
SERS activity is correlated to the size, shape and geometry of nanoparticles [50,51], and
hence, controlling these parameters is essential in producing SERS probes with consistent
enhancement behavior, as well as enabling the appropriate choice of excitation laser to engage
the surface plasmon and the local surface plasmon resonance (LSPR) effects.
Star-like gold nanoparticles (SGN) were obtained at 25 ºC [38,51], and gold nanocaltrops (GNC) consisting of quasi-fractal particles, were obtained at 65 ºC, as illustrated in the
TEM images shown in Figure 1(a,b), respectively, and the SEM image shown in Figure 1(c,d),
respectively. As can be seen from the images of the Au nanoparticle at these two temperatures,
the overall size of the SGN is smaller than that of the GNC, however the GNC have a higher
degree of surface inhomogeneity. The average sizes of the nanoparticles based on the TEM
images were calculated by using the log mean average of the core and outer radii of each
nanoparticle, shown in Figure 2a for the SGNs and Figure 2b for the GNCs. This procedure is
described by the expression:
RLM =
RSpike − RCore
ln ( RSpike RCore )
(1)
where RCore is the average radius of the inner solid sphere at the center of the nanoparticles that is
encased by the inner circle, and RSpike is half of the average distance between two branches at
opposite sides of the nanoparticles that are encased in the outer circle, as shown in Figures 2a
and 2b, the former for the calculation of the RLM for SGNs and the latter for the calculation of
RLM of GNCs..
(a)
(b)
(c)
(d)
Figure 1. Morphology of the synthesized nanoparticles showing the details of surface features. (a)
Transmission electron micrograph of star-like gold nanoparticles (SGN) at a magnification of 125,000;
(b) Transmission electron micrograph of quasi-fractal gold nanoparticles (GNC) at a magnification of
125,000; (c) Scanning electron micrograph of star-like gold nanoparticles; (d) Scanning electron
micrograph of quasi-fractal gold nanoparticles.
Based on TEM images, the average radius-equivalent size of SGNs was 43 ± 22 nm and
of GNCs was 168 ± 60 nm. The particle size values obtained from TEM images were then
compared to the values obtained from DLS measurements, as shown in Figure 2c.
(b)
(a)
Rspike
Rspike
Rcore
DLS
TEM
Isoperimetric Ratio
200
Particle size (nm)
Rcore
150
100
50
0
(c)
Star-like
Quasi-fractal
(d)
40
30
20
10
0
Star-like
Quasi-fractal
Figure 2. Evaluation of particle size and particle morphology. (a) Schematic description for the
calculation of the log mean radius of star-like gold nanoparticles; (b) Schematic description for the
calculation of the log mean radius of quasi-fractal gold nanoparticles. The log mean radius-equivalent for
both types of nanoparticles was calculated using the log mean equation where the core radius was the
distance from the center of the particle to the edge of the solid inner core and the outer radius was half the
distance between two spikes on opposite sides of the nanoparticles. The overall equation used is given by:
=
RLM
(R
Spike
− RCore ) ln ( RSpike RCore ) ; (c) Comparison of particles sizes obtained from transmission
electron micrographs and from dynamic light scattering experiments; (d) The isoperimetric ratios for both
star-like and quasi-fractal gold nanoparticles calculated using Matlab.
Based on the DLS measurements, the average radius-equivalent size of SGNs was 79 ±
48 nm and of GNCs was 179 ± 55 nm. The slightly larger values from DLS measurements are
not surprising since DLS estimates size distribution differently, i.e. by size to the power of
six, and therefore, larger particles are given more weight. Moreover, DLS measures the
hydrodynamic radii of particles that includes adsorbed species and solvent interactions, while in
the TEM image only the metallic moiety is observed due to the insufficient contrast of other
organic moieties.
A rough quantitative estimate of the degree of surface roughness and branching was
calculated by the evaluation of the isoperimetric ratio, P = L2/A, where L is the length of the
closed loop curve encompassing the nanoparticle and A is the area enclosed in the closed loop
curve (see Matlab code in the Supplemental Information section). The calculated values of P for
the gold nanoparticles were 24.1 ± 1.5 and 34.4 ± 2.8 for the SGNs and GNCs, respectively, as
shown in Figure 2d. The departure from the value of 4π (for a perfect circle) is indicative of the
extent of deviation of the curve from a circular shape, and hence, a good measure of the degree
of fractal character.
Previous studies have shown that the growth dynamics of branched particles having
higher energy surfaces was the result of kinetically-favored growth regimes [39,58-60]. This type
of growth process was shown to be driven by the relatively low reduction potential of
hydroquinone, which acts as a reducing agent in this process [60-63]. We therefore assume that
increasing the synthesis temperature increases the reaction kinetics, which in turn, augments the
effect of the hydroquinone on the already rapid deposition process of Au0 onto the (111) planes
of the gold. As has been previously demonstrated [39,51], a higher deposition rate of Au0 is key
to the formation of branch structures on nanoparticles, such as star-like particles and in our case,
quasi-fractal structures.
3.2. Surface plasmon resonance
When the synthesis temperature was increased from 25 °C to 65 °C, the resulting UV-Vis
spectra exhibited a drastic reduction in intensity and detail, as shown in Figure 3a. At 25 °C, the
spectrum exhibits two major peaks in the 500 – 800 nm region of interest (see inset of Figure
3a). The peak at 531 nm is consistent with the surface plasmon resonance observed for spherical
gold nanoparticles in the approximate 20-60 nm size range, which is the overall average size
diameter of the particles obtained at the lower temperature. However, the particles have a starlike structure, and hence their spectra are more complex, as evidences by the presence of a
second peak at 624 nm [64-70]. The presence of this peak and the overall broadening of the
spectrum, as compared to that of spherical gold nanoparticles of similar size, is mostly due to
two distinct phenomena: (a) The departure from the spherical geometry and the breakdown in
particle symmetry give rise to multiple axes of varying size and varying geometries, and as a
result, exhibit distinct surface plasmons. Previous characterization of gold nanorods highlighted
the fact that these nanoparticles possess two absorption peaks [64,65], one that originates
because of plasmons on the transverse axis that coincides with the absorption of a spherical
particle of similar size, and another that originates from the longitudinal axis and is considerably
red-shifted. Similarly, the presence of these types of anisotropic features in the star-like gold
nanoparticles contribute to the emergence of the double peak that we observe in our system. (b)
Another feature of the star-like gold nanoparticles is a broad size distribution, which causes both
the presence of the second peak at lower frequencies and an overall broadening of the peaks in
the spectrum.
(a)
2.0
0.5
Absorbance (A.U.)
Absorbance (A.U.)
3.0
GNC
SGN
0.4
0.3
624nm
0.2
531nm
0.1
0.0
1.0
400
500
600
700
800
Wavenumber (nm)
0.0
350
550
750
950
Wavenumber (nm)
Absorbance (A.U.)
1.0
0.8
0.15
(b)
0.10
0.6
0.4
GNC-conc
GNC
0.2
0.05
0.0
0.00
400
500
600
700
800
Wavenumber (nm)
Figure 3. The UV-Vis absorption spectrum for both star-like and quasi-fractal gold nanoparticles. (a)
Comparison of the UV-Vis absorption spectrum for both “as prepared” star-like and quasi-fractal gold
nanoparticles; (b) Comparison of the UV-Vis absorption spectrum of “as prepared” quasi-fractal gold
nanoparticles and a ten-fold concentration of the quasi-fractal gold nanoparticles.
The broadening and the decreasing intensity of the absorption peaks for the gold quasifractal gold nanoparticles obtained at 65 °C is believed to be the result of two major factors, i.e.
the addition of more fractal features as well as the increasing particle size. The fractal
contribution is due to the presence of multiple axes of varying sizes [66], thus most likely
causing multiple absorption peaks of low intensity that merge into one broad unresolved
absorption band. The multiplicity in branch morphologies and dimensions prevents any dominant
shape feature from being expressed on all of the nanoparticles, and hence, no specific λmax, i.e.
wavelength at which maximum absorption occurs, is observed. The absorption spectrum of a tenfold concentrated solution of the quasi-fractal nanoparticles (obtain by concentration with a rotor
evaporator) exhibited similar broad and flat features, as shown in Figure 3b, indicating that these
characteristics are concentration independent.
3.3. Enhancement of Raman scattering
The increase in the expected SERS enhancement with increasing nanoparticle size has
traditionally been attributed to the larger surface area associated with larger particles [52-54].
However, the SERS enhancement does not depend solely on the surface area of the nanoparticles
but also on the enhanced electromagnetic field generated from the surface plasmon. While
increase in particle size increases the local electromagnetic enhancement [55], it also generates a
decrease in surface curvature, absorption of the incident light and inelastic scattering that occur
on the surface. These phenomena actually lead to a weakening of the electromagnetic field on
the surface and a decrease in the overall SERS intensity [56]. Hence, size alone would not be the
best or the most reliable predictor as to the efficiency of the SERS enhancement.
Another possible predictor of SERS enhancement would be the magnitude of the surface
plasmon, as indicated by the absorption spectra of the nanoparticles [68,71,72]. However, as we
have previously shown, the intensity of the absorption spectra is strongly impacted not only by
the size of the particles, but more importantly, by the roughness of the surface and the local
curvature of the characteristic geometrical constituents of the nanostructures. Again, what we
observed and showed in Figure 3, was that nanoparticles having a quasi-fractal surface
morphology, exhibited an almost complete absence of a discernable absorption spectrum.
2000
Intensity (Counts/s)
1172 cm-1
1500
1612 cm-1
1377 cm-1
Malachite Green
1000
500
SGN
GNC
0
200
600
1000
Raman Shift
1400
(cm-1)
1800
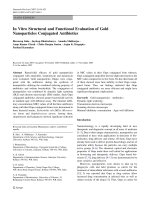
Figure 4. Comparison of the Raman spectra of malachite green dye in the presence of star-like and quasifractal gold nanoparticles. The chemical structure for the malachite green oxalate salt molecule is also
shown, together with the three most noteworthy characteristic Raman bands of the dye. The intensity of
the 1172 cm-1 band was used as the basis for the calculation of the relative enhancement factor.
The enhancement of the Raman spectrum of a triarylmethane dye with the general
formula {C6H5C[C6H4N(CH3)2]2}(C2O3OH) (malachite green oxalate salt, MG) when incubated
with either gold nanostars or gold quasi-fractal nanoparticles is shown in Figure 4. All Raman
spectra were obtained under identical settings in order to enable quantitative comparisons
between all of the samples. The most important consideration was the establishment of the
optical plane where the laser was focused in order to provide the common conditions for all the
samples. The plane of focus determines the interaction volume of the laser in the sample and can
easily be tuned within the thin films created by the poly-L-lysine or dye. This may cause
inconsistent interaction volumes and artificially affect the maximum signal obtained in units of
counts/sec. In order to circumvent this, each sample was first positioned so that an area devoid of
sample could be probed by the laser. The laser was then focused using an auto-focusing routine
that sought to maximize the Raman signal of the Si spectral line at 520 cm-1 by adjusting the
height of the sample. Once this height was established, samples were mapped with all room
lights turned off. Any further inconsistencies between samples was then limited to the
distributions of particles and dye on the poly-L-lysine coated Si substrates.
As shown in Figure 4, the enhancement of the Raman scattering spectrum of MG due to
the presence of the quasi-fractal nanoparticles is quite remarkable. Since the main interest in this
work was to probe the effect of geometrical permutations of gold nanoparticles on their surfaceenhancing Raman capabilities, we found it particularly revealing to calculate the relative
enhancement factor of the quasi-fractal nanoparticles as compared to the star-like nanoparticles
[30,73].
The enhancement factor (EF) is given by:
EF =
NVol ⋅ I Surf
N Surf ⋅ IVol
(2)
where NVol and N Surf are the number of analyte molecules in the probed sample volume and on
the SERS substrates, respectively, and IVol I Surf are the corresponding intensities of the normal
Raman and the SERS spectra.
The relative level of enhancement provided by the GNCs in comparison to the SGNs is
given by:
NVol ⋅ I Surf
GNC
SGN
EFGNC N Surf ⋅ IVol GNC I Surf N Surf
EF
=
=
=
⋅
rel
SGN
GNC
EFSGN NVol ⋅ I Surf
I Surf
N Surf
N Surf ⋅ IVol
(3)
SGN
The assumption is that the number of analyte molecules in the probed sample volume is
independent of the nanoparticles used to generate the signal enhancement and hence, the quantity
NVol IVol in both systems is constant. If we assume that the densities of the analyte molecules on
or in the proximity of the surface of the gold nanoparticles is similar for both nanoparticle
SGN
GNC
geometries, then N Surf
N Surf
∝ P GNC P SGN , where P GNC is the isoperimetric ratio for the quasi-
fractal gold nanoparticles and P SGN is the isoperimetric ratio for the star-like gold nanoparticles.
Therefore, the relative ratio becomes:
GNC
I Surf
P GNC
EF
=
⋅
rel
SGN
I Surf
P SGN
(4)
The three main characteristic and most prominent Raman bands of MG are observed at 1612
cm−1, 1377 cm−1 and 1172 cm−1, corresponding to symmetric ring breathing and C-C stretching
of the aromatic rings, the phenyl-N stretch and the symmetric in-plane and out-of-plane bending
of the rings, respectively [74,75]. The intensity of the 1172 cm-1 Raman shift band of MG was 98
SGN
GNC
counts/s in the presence of SGNs ( I Surf
), and 1755 counts/s in the presence of GNCs ( I Surf
).
Based on these values, the calculated relative enhancement ratio EFrel is 29.2. It is interesting to
note that the relative enhancement ratio is not the same for all frequencies, fact which may be
indicative of some preferential orientation of the MG molecules near or at the surface of the gold
nanoparticles.
The considerable greater enhancement of the Raman signals in the presence of the quasifractal gold nanoparticle as compared to that obtained in the presence of star-like gold
nanoparticles, demonstrates that the mechanism of enhancement is not dependent primarily on
the magnitude of the surface plasmon resonance of the nanoparticles, as traditionally believed.
Instead, the enhancement is due to local “hot spots” [41-46,66] and therefore, highly dependent
on the inhomogeneity of the surface features, i.e. both the surface roughness, degree of branching
and variations in local surface curvature.
4. Conclusions
In this work, we described a procedure for synthesizing gold nanoparticles having a novel, quasifractal morphology, which we termed gold nano-caltrops (GNC). This highly branched
nanoparticle morphology is the result of the temperature modulation to the conventional one-pot
synthesis of star-like gold nanoparticles. These GNC possess a high degree of surface roughness
thanks to the kinetics favored growth regime facilitated through a combination of the presence of
hydroquinone as the reducing agent and higher synthesis temperatures. As a result of their
highly-curved, sharp and irregular surface features, these nanoparticles exhibited marked
enhancement of Raman signals of a reporter dye when compared with similar nanoparticles that
possess less overall surface roughness, such as star-like nanoparticles. Moreover, we have shown
that the mechanism of enhancement of the Raman signals by these quasi-fractal nanoparticles
was not necessarily correlated to their surface plasmon resonance, but rather to the degree of
their surface inhomogeneity. Hence, such highly branched nanoparticles might provide higher
resolution and higher sensitivity for the detection of low concentration analyte molecules.
5. Notes
The authors declare no competing financial interest.
6. Acknowledgments
The authors thank Dr. Fran Adar from Horiba for her guidance with Raman spectroscopy,
Professor Ming-Yu Ngai and his student Johnny Lee from the Department of Chemistry at Stony
Brook University, and undergraduate students Olivia Chen and Maurinne Sullivan for their
assistance in performing the rotary evaporator experiments. The authors also thank Prof. Allen
Tannenbaum from the Departments of Computer Sciences and Applied Mathematics at Stony
Brook University for providing the Matlab code for the calculation of the isoperimetric ratios.
This research was partially funded through the Stony Brook Scholars in Biomedical Sciences
Program. This research used resources of the Center for Functional Nanomaterials, which is a
U.S. DOE Office of Science Facility at the Brookhaven National Laboratory under Contract No.
DE-SC0012704.
7. References
[1] A. C. Seklar Talari, Z. Movasaghi, S. Rehman, I. ur Rehman, Raman spectroscopy of
biological tissues, Appl. Spec. Rev. 50 (2015) 46-111.
[2] E. B. Hanlon, R. Manoharan, T.-W. Koo, K. E. Shafer, J. T. Motz, M. Fitzmaurice, J. R.
Kramer, I. Itzkan, R. R. Dasari, M. S. Feld, Prospects for in-vivo Raman spectroscopy, Phys.
Med. Biol. 45 (2000) R1-R59.
[3] E. Petryayeva, U. Krull, Localized surface plasmon resonance: Nanostructures, bioassays and
biosensing: A review, Anal. Chim. Acta 706 (2011) 8-24.
[4] S. Schlücker, Surface enhanced Raman spectroscopy: Concepts and chemical applications,
Angew. Chem. Int. Ed. 53 (2014) 4756-4795.
[5] P. K. Jain, X. Huang, I. H. El-Sayed, M. A. El-Sayed, Review of some interesting surface
plasmon resonance enhanced properties of noble metal nanoparticles and their applications in
biosystems, Plasmonics 2 (2007) 107-118.
[6] M. Vendrell, K. Maiti, K. K. Dhaliwal, Y. T. Chang, Surface enhanced Raman scattering in
[7] Y. Zhang, H. Hong, W. Cai, Imaging with Raman spectroscopy, Curr. Pharm. Biotechnol. 11
(2010) 654-661.
[8] J. V. Jokerst, S. S. Gambhir, Molecular imaging with theranostic nanoparticles, Acc. Chem.
Res. 44 (2011) 1050-1060.
[9] J. Yang, Z. Wang, S. Zong, C. Song, R. Zhang, Y. Cui, Distinguishing breast cancer cells
using surface enhanced Raman scattering, Anal. Bioanal. Chem. 402 (2012) 1093-1100.
[10] M. Fan, G. F. S.Andrade, A. G. Brolo, A review on the fabrication of substrates for surface
enhanced Raman spectroscopy and their applications in analytical chemistry, Anal. Chim. Acta
693 (2011) 7-25.
[11] Z. J. Smith, A. J. Berger, Integrated Raman and angularscattering microscopy, Opt. Lett. 3
(2008) 714-716.
[12] H. Urabe, Y. Tominaga, K. Kubota, Experimental evidence of collective vibrations in DNA
double helix Raman spectroscopy, J. Chem. Phys. 78 (1983) 5937-5939.
[13] K. C. Chou, Identification of low-frequency modes in protein molecules, Biochem. J. 215
(1983) 465-469.
[14] K. C. Chou, Low frequency vibration of DNA molecules, Biochem. J. 221 (1984) 27-31.
[15] H. Urabe, Y. Sugawara, M. Ataka, A. Rupprecht, Low frequency Raman spectra of
lysozyme crystals and oriented DNA films: Dynamics of crystal water, Biophys. J. 74 (1988)
1533-1540.
[16] K. C. Chou, Review: Low frequency collective motion in biomacromolecules and its
biological functions, Biophys. Chem. 30 (1988) 3-48.
[17] K. C. Chou, Low frequency resonance and cooperativity of hemoglobin, Trends. Biochem.
Sci. 14 (1989) 212.
[18] M. Schütz, C. I. Müller, M. Salehi, C. Lambert, S. Schlücker, Design and synthesis of
Raman reporter molecules for tissue imaging by immune SERS microscopy, J. Biophoton. 4
(2011) 453-463.
[19] D. Ellis, R. Goodacre, Metabolic fingerprinting in disease diagnosis: Biomedical
applications of infrared and Raman spectroscopy, Analyst 131 (2006) 875-885.
[20] X. Qian, X. Peng, D. O. Ansari, Q. Yin-Goen, G. Z. Chen, D. M. Shin, L.Yang, A. N.
Young, M. D. Wang, S. Nie, In vivo tumor targeting and spectroscopic detection with surfaceenhanced Raman nanoparticle tags, Nature Biotech. 26 (2008) 83-90.
[21] X. Michalet, F. F. Pinaud, L. A. Bentolila, J. M. Tsay, S. Doose, J. J. Li, G. Sundaresan, A.
M. Wu, S. S. Gambhir, S. Weiss, Quantum dots for live cells, in vivo imaging, and diagnostics,
Science 307 (2005) 538-544.
[22] S. Lee, S. Kim, J. Choo, S. Y. Shin, Y. H. Lee, H. Y. Choi, S. Ha, K.Kang, C. H. Oh,
Biological imaging of HEK293 cells expressing PLCγ1 using surface enhanced Raman
microscopy, Anal. Chem. 79 (2007) 916-922.
[23] J. V. Jokerst, Z. Miao, C. Zavaleta, Z. Cheng, S. S. Gambhir, Affibody-functionalized
gold silica nanoparticles for Raman molecular imaging of the epidermal growth factor receptor,
Small 7 (2011) 625-633.
[24] M. K. Gregas, F. Yan, J. Scaffidi, H. N. Wang, T. Vo-Dinh, Characterization of nanoprobe
uptake in single cells: Spatial and temporal tracking via SERS labeling and modulation of
surface charge, Nanomed. Nanotech. Biol. Med. 7 (2011) 115-122.
[25] M. Moskovits, Surface enhanced Raman spectroscopy: A brief perspective, Top. Appl.
Phys. 103 (2006) 1-17.
[26] A. Campion, P. Kambhampati, Surface enhanced Raman scattering, Chem. Soc. Rev. 27
(1998) 241.
[27] J. A. Creighton, D. G. Eadon, Ultraviolet/visible absorption spectra of the colloidal
metallic elements, J. Chem. Soc. Faraday Trans. 87 (1991) 3881.
[28] C. Langhammer, Z. Yuan, I. Zorić, B. Kasemo, Plasmonic properties of supported Pt and Pd
nanostructures, Nano Lett. 6 (2006) 833-838.
[29] E. J. Blackie, E. C. Le Ru, P. G. Etchegoin, Single molecule surface enhanced Raman
spectroscopy of nonresonant molecules, J. Amer. Chem. Soc. 131 (2009) 14466-14472.
[30] E. C. Le Ru, E. Blackie, M. Meyer, P. G. Etchegoin, Surface-enhanced Raman scattering
enhancement factors: A comprehensive study, J. Phys. Chem. C 111 (2007) 13794-13803.
[31] S. Lal, S. Link, N. J. Halas, Nano-optics from sensing to waveguiding, Nat. Photonics 1
(2007) 641-648.
[32] H. Lu, H. Zhang, X. Yu, S. Zeng, K. T. Yong, H. P. Ho, Seed-mediated plasmon-driven
regrowth of silver nanodecahedrons (NDs), Plasmonics 7 (2011) 167-173.
[33] L. L. Bao, S. M. Mahurin, C. D. Liang, S. Dai, Study of silver films over silica beads as a
surface-enhanced Raman scattering (SERS) substrate for detection of benzoic acid, J. Raman
Spectr. 34 (2003) 394-398.
[34] S. Ayas, G. Cinar, A. D. Ozkan, Z. Soran, O. Ekiz, D. Kocaay, A. Tomak, P. Toren, Y.
Kaya, I. Tunc, H. Zareie, T. Tekinay, A. B. Tekinay, M. O. Guler, A. Dana, Label-free
nanometer-resolution imaging of biological architectures through surface enhanced Raman
scattering, Sci. Rep. 3 (2013) 2624.
[35] Y. C. Cao, R. Jin, C. A. Mirkin, Nanoparticles with Raman spectroscopic fingerprints for
DNA and RNA detection, Science 297 (2002) 1536-1540.
[36] C. L. Haynes, A. D. McFarland, R. P. Van Duyne, Surface-enhanced Raman spectroscopy,
Anal. Chem. 77 (2005) 338A-346A.
[37] P. F. Liao, A. Wokaun, Lightning rod effect in surface enhanced Raman scattering, J. Chem.
Phys. 76 (1982) 751-752.
[38] C. Morasso, D. Mehn, R. Vanna, M. Bedoni, E. Forvi, M. Colombo, D. Prosperi, F.
Gramatica, One-step synthesis of star-like gold nanoparticles for surface enhanced Raman
spectroscopy, Mater. Chem. Phys. 143 (2014) 1215-1221.
[39] O. M. Bakr, B. H. Wunsch, F. Stellacci, High-yield synthesis of multi-branched urchin-like
gold nanoparticles, Chem. Mater. 18 (2006) 3297-3301.
[40] K. L. Wustholz, A. I. Henry, J. M. McMahon, R. G. Freeman, N. Valley, M. E. Piotti, M. J.
Natan, G. C. Schatz, R. P. Van Duyne, Structure-activity relationships in gold nanoparticle
dimers and trimers for surface-enhanced Raman spectroscopy, J. Am. Chem. Soc. 132 (2010)
10903-10910.
[41] M. Moskovits, Persistent misconceptions regarding SERS, Phys. Chem. Chem. Phys. 15
(2013) 5301-5311.
[42] K. Kneipp, H. Kneipp, I. Itzkan, R. R. Dasari, M. S. Feld, Surface-enhanced Raman
scattering and biophysics, J. Phys. Condens. Matter 14 (2002) R597-R624.
[43] P. K. Aravind, R. W. Rendell, H. Metiu, A new geometry for field enhancement in surfaceenhanced spectroscopy, Chem. Phys. Lett. 85 (1982) 396–403.
[44] P. K. Aravind, H. Metiu, The effects of the interaction between resonances in the
electromagnetic response of a sphere-plane structure: Applications to surface enhanced
spectroscopy,Surf. Sci. 124 (1983) 506-528.
[45] Y. Fang, N. H. Seong, D. D. Dlott, Measurement of the distribution of site enhancements in
surface-enhanced Raman scattering", Science 321 (2008) 388-391.
[46] V. S. Tiwari, T. Oleg, G. K. Darbha, W. Hardy, J. P. Singh, P. C. Ray, Non-resonance
SERS effects of silver colloids with different shapes, Chem. Phys. Lett. 446 (2007) 77-82.
[47] F. Hao, C. L. Nehl, J. H. Hafner, P. Nordlander, Plasmon resonances of a gold nanostar,
Nano Lett. 7 (2007) 729-732.
[48] C. L. Nehl, H. Liao, J. H. Hafner, Optical properties of star-shaped gold nanoparticles, Nano
Lett. 6 (2006) 683-688.
[49] F. Tian, F. Bonnier, A. Casey, A. E. Shanahan, H. J. Byrne, Surface enhanced Raman
scattering with gold nanoparticles: Effect of particle shape, Anal. Methods 6 (2014) 9116-9123.
[50] S. Link, M. A. El-Sayed, Size and temperature dependence of the plasmon absorption of
colloidal gold nanoparticles, J. Phys. Chem. B 103 (1999) 4212-4217.
[51] M. Li, S. K. Cushing, J. Zhang, J. Lankford, Z. P. Aguilar, D. Ma, N. Wu, Shape-dependent
surface-enhanced Raman scattering in gold-Raman-probe-silica sandwiched nanoparticles for
biocompatible applications, Nanotechnology 23 (2012) 115501-115511.
[52] S. Hong, X. Li, Optimal size of gold nanoparticles for surface-enhanced Raman
spectroscopy under different conditions, J. Nanomater 2013 (2013) 790323.
[53] K. Q. Lin, J. Yi, S. Hu, B. J. Liu, J. Y. Liu, X. Wang, B. Ren, Size effect on SERS of gold
nanorods demonstrated via single nanoparticle spectroscopy, J. Phys. Chem. C 120 (2016)
20806-20813.
[54] K. Quester, M. Avalos-Borja, A. R. Vilchis-Nestor, M. A. Camacho-López, E. CastroLongoria, SERS properties of different sized and shaped gold nanoparticles biosynthesized under
different environmental conditions by Neurospora Crassa extract, Plos One 8 (2013) e77486.
[55] K. L. Kelly, E. Coronado, L. L. Zhao, G. C. Schatz, The optical properties of metal
nanoparticles: The influence of size, shape, and dielectric environment, J. Phys. Chem. B 107
(2003) 668–677.
[56] P. L. Stiles, J. A. Dieringer, N. C. Shah, R. P. Van Duyne, Surface-enhanced Raman
spectroscopy, Annu. Rev. Anal. Chem. 1 (2008) 601-626.
[57] J. D. Driskell, R. J. Lipert, M. D. Porter, Labeled gold nanoparticles immobilized at smooth
metallic substrates: Systematic investigation of surface plasmon resonance and surface-enhanced
Raman scattering. J. Phys. Chem. B 110 (2006) 17444–17451.
[58] S. D. Perrault, W. C. W. Chan, Synthesis and surface modification of highly monodispersed,
spherical gold nanoparticles of 50−200 nm. J. Am. Chem. Soc. 131 (2009) 17042-17043.
[59] M. R. Langille, M. L. Personick, J. Zhang, C. A. Mirkin, Defining rules for the shape
evolution of gold nanoparticles, J. Am. Chem. Soc. 134 (2012) 14542-14554.
[60] Sirajuddin, A. Mechlerc, A. A. J. Torriero, A. Nafady, C. Y. Lee, A. M. Bond, A. P.
O’Mullane, S. K. Bhargava, The formation of gold nanoparticles using hydroquinone as a
reducing agent through a localized pH change upon addition of NaOH to a solution of HAuCl4,
Coll. Surf. A 370 (2010) 35-41.
[61] C. Morasso, S. Picciolini, D. Schiumarini, D. Mehn, I. Ojea-Jiménez, G. Zanchetta, R.
Vanna, M. Bedoni, D. Prosperi, F. Gramatica, Control of size and aspect ratio in hydroquinonebased synthesis of gold nanorods, J. Nanopart. Res. 17 (2015) 330.
[62] J. Li, J. Wu, X. Zhang, Y. Liu, D. Zhou, H. Sun, H. Zhang, B. Yang, Controllable synthesis
of stable urchin-like gold nanoparticles using hydroquinone to tune the reactivity of gold
chloride, J. Phys. Chem. C 115 (2011) 3630-3637.
[63] X. Zhang, K. Tang, Q. Yang, L. Qi, X. Wang, F. Chen, Z Chen, Preparation of gold
nanoparticles using hydroquinone derivatives, Mater. Lett. 140 (2015) 180-183.
[64] S. Link, M. A. El-Sayed, Spectral properties and relaxation dynamics of surface plasmon
electronic oscillations in gold and silver nanodots and nanorods, J. Phys. Chem. B 103 (1999)
8410-8426.
[65] S. K. Ghosh, T. Pal, Interparticle coupling effect on the surface plasmon resonance of gold
nanoparticles: From theory to applications, Chem. Rev. 107 (2007) 4797-4862.
[66] K. A. Willets, R. P. Van Duyne, Localized surface plasmon resonance spectroscopy and
sensing, Annu. Rev. Phys. Chem. 58 (2007) 267-297.
[67] W. Haiss, N. T. K. Thanh, J. Aveyard, D. G. Fernig, Determination of size and
concentration of gold nanoparticles from UV-Vis spectra, Anal. Chem. 79 (2007) 4215-4221.
[68] M. C. Daniel, D. Astruc, Gold nanoparticles: Assembly, supramolecular chemistry,
quantum-size-related properties, and applications toward biology, catalysis, and nanotechnology,
Chem. Rev. 104 (2004) 293-346.
[69] M. Grzelczak, J. P. Juste, P. Mulvaney, L. M. L. Marzán, Shape control in gold
nanoparticle synthesis, Chem. Soc. Rev. 37 (2008) 1783-1791.
[70] T. A. El-Brolossy, T. Abdallah, M. B. Mohamed, S. Abdallah, K. Easawi, S. Negm, H.
Talaat, Shape and size dependence of the surface plasmon resonance of gold nanoparticles
studied by photoacoustic technique, Eur. Phys. J. Spec. Topics 153 (2008) 361-364.
[71] J. X. Cheng, X. S. Xie, Coherent anti-Stokes Raman scattering microscopy:
Instrumentation, theory, and applications, J. Phys. Chem. B 108 (2004) 827-840.
[72] S. Zeng, K-T. Yong, I. Roy, X-Q. Dinh, X. Yu, F. Luan, A Review on functionalized gold
nanoparticles for biosensing applications, Plasmonics 6 (2011) 491-506.
[73] A. D. McFarland, M. A. Young, J. A. Dieringer, R. P. Van Duyne, Wavelength-scanned
surface-enhanced Raman excitation spectroscopy. J. Phys. Chem. B 109 (2005) 11279-11285.
[74] B. Pettinger, B. Ren, G. Picardi, R. Schuster, G. Ertl, Tip-enhanced Raman spectroscopy
(TERS) of malachite green isothiocyanate at Au (111): Bleaching behavior under the influence
of high electromagnetic fields, J. Raman Spectr. 36 (2005) 541–550.
[75] Y. Zhang, Y. Huang, F. Zhai, K. Lai, K. Analyses of enrofloxacin, furazolidone and
malachite green in fish products with surface-enhanced Raman spectroscopy, Food Chem. 135
(2005) 845-850.
Supplemental Information
Raman Signal Enhancement by QuasiFractal Geometries of Au Nanoparticles
Richard (Rick) E. Darienzo, Tatsiana Mironava and Rina Tannenbaum*
Biomedical Nanomaterials Research Laboratory, Department of Materials Science and Chemical
Engineering, Stony Brook University, Stony Brook, NY 11794, USA
S1. Matlab Code
I=imread(`rina.png’); Load image
level=graythresh(I); Find the threshold for image
BW=imbinarize(I,level); Turn image into binary
WB=imcomplement(BW); reverse black and white (to use Matlab functions)
AR=bwarea(WB); area of white region
PP=regionprops(WB,’Perimeter’); list of lengths of all white regions
BIG=largest of PP.Perimeter; this will give length of largest white region
BIG^2/AR=isoperimetric ratio >=4 pi (the larger it is, the more fractal the shape)
*Corresponding author: Rina Tannenbaum, Email: , Tel:
(631) 632 4392, Fax: (631) 632 8052