WV-Fam-Survey-Statewide-Report-2018-FINAL-120318
Bạn đang xem bản rút gọn của tài liệu. Xem và tải ngay bản đầy đủ của tài liệu tại đây (1.06 MB, 32 trang )
West Virginia Family Survey
Protective Factors in Families Served by
Community-Based Child Abuse Prevention Programs
ANNUAL EVALUATION REPORT
Fiscal Year 2018
Produced by Hornby Zeller Associates, Inc.,
A Public Consulting Group, Inc. Company
November 2018
Special thanks to the statewide leadership team for advice, expertise,
and dedication to the staff, families, and children of West Virginia.
West Virginia Department of Health & Human Resources
Division of Early Care & Education
350 Capitol Street Room B18
Charleston, WV 25301
Report produced by
Hornby Zeller Associates, Inc.
48 Fourth Street, Suite 300
Troy, NY 12180
(518) 273-1614
www.hornbyzeller.com
www.pcgus.com
For more information about the survey, data interpretation or sharing,
please contact: Sara Ryan at
CONTENTS
INTRODUCTION ........................................................................................................................................ 1
ABOUT WEST VIRGINIA’S CBCAP PROGRAMS ...............................................................................1
METHODOLOGY ....................................................................................................................................... 3
WEST VIRGINIA FAMILY SURVEY COMPONENTS ..........................................................................3
PROTECTIVE FACTORS.........................................................................................................................4
MEASURING CHANGES IN PROTECTIVE FACTORS SCORES OVER TIME .......................... 5
2018 SURVEYS .......................................................................................................................................5
FAMILY CHARACTERISTICS .................................................................................................................... 7
FAMILIES’ NEEDS ...................................................................................................................................8
COMPARING PIP, IHFE AND FRC PARTICIPANTS ..........................................................................9
OVERALL PROTECTIVE FACTORS RESULTS ....................................................................................... 11
PROGRAM PERCEPTIONS ..................................................................................................................... 13
PLAY GROUPS .................................................................................................................................... 14
IN-HOME FAMILY EDUCATION EVALUATION RESULTS ................................................................. 15
PROTECTIVE FACTORS RESULTS ..................................................................................................... 15
SCREENING AND ASSESSMENT....................................................................................................... 17
PERCEPTIONS OF HOME VISITING ................................................................................................. 17
FAMILY RESOURCE CENTERS ............................................................................................................... 19
PARTNERS IN PREVENTION PROGRAMS .......................................................................................... 21
CONCLUSIONS ........................................................................................................................................ 23
REFERENCES ............................................................................................................................................ 24
APPENDICES ............................................................................................................................................ 25
APPENDIX A: West Virginia Family Survey Protective Factors Questions .................................. 26
APPENDIX B: West Virginia Family Modified Protective Factors Questions ............................... 28
INTRODUCTION
The West Virginia Department of Health and Human Resources (DHHR), Bureau for Children and
Families and the Office of Maternal, Child, and Family Health work together to coordinate the
state’s Community-Based Child Abuse Prevention (CBCAP) efforts. Four types of prevention
programs are offered to families to ensure children have the best start in life and are free of
abuse and neglect: In-Home Family Education (IHFE), Family Resource Centers (FRC), Partners in
Prevention (PIP) and Circle of Parents. In addition to funding, the State supports local community
agencies through policy and practice guidance as well as training and technical assistance.
A program evaluation is conducted annually to provide feedback about the successes and
challenges of CBCAP programs’ efforts. DHHR contracts with Hornby Zeller Associates, Inc. (HZA)1
to conduct the State’s evaluation and continuous quality improvement process. To evaluate
CBCAP-funded programs, surveys are administered to participants collecting their demographic
information, feedback on the programs they received, and information on the families’ protective
factors. This report describes the state-level findings from survey responses collected during fiscal
year 2018, i.e., between October 1, 2017 and September 30, 2018. In addition, HZA produces
individual program reports for each grantee organization so that each program is provided with
specific information about its own efforts.
West Virginia Family Survey is used to assess prevention programs:
In-Home Family Education
Family Resource Centers
Partners in Prevention
Circle of Parents
ABOUT WEST VIRGINIA’S CBCAP PROGRAMS
Four types of programs are funded through West Virginia’s CBCAP program.
In-Home Family Education (IHFE) refers to West Virginia’s programs that provide early
childhood home visiting services. Each IHFE program delivers a range of support and education
services to families with young children following nationally recognized standards. IHFE staff
members (called home visitors, parent educators, and family support workers, but referred to as
home visitors in this report) begin their work with families by establishing a trusting relationship
with them, followed by working with them to identify and address their individual strengths, goals,
and needs. This work may include using various educational techniques that focus on the
caregiver-child relationship parenting practices and helping caregivers to understand their
children’s development and behaviors. Home visitors also connect families to social and concrete
supports in their communities, such as other parents and service providers.
Acquired by Public Consulting Group, Inc. at the end of February 2018, Hornby Zeller Associates serves as the
evaluation team for PCG’s Human Services practice.
1
West Virginia Family Survey Annual Report 2018
Page 1
Each IHFE program offers one of three models: Parents as Teachers (PAT), Healthy Families America
(HFA) and Maternal Infant Health Outreach Workers (MIHOW). This evaluation examines
outcomes of home visiting programs overall, as well as differences between the three program
models. Other home-based service providers (such as Early Head Start and Right from the
Start/HAPI Project) may have collaborative relationships under CBCAP funding; however, results
in this report are not sorted beyond the three primary models.
Family Resource Centers (FRC) are designated agencies or organizations that bring together
existing early care, education, and prevention services at one location. This approach increases
the accessibility of services, combines resources and content-area expertise, provides family
support and education, and works within unique community contexts. FRCs were once designated
to serve families with children up to age eight, but current FRC CBCAP grantees work with a
broader population of children and families, from the prenatal stage to age 18. Over half of the
FRC programs are associated with IHFE and/or Partners in Prevention programs.
Partners in Prevention (PIP) supports local child abuse prevention projects across all of West
Virginia. The Partners’ work is based on the belief that preventing child abuse and keeping
children safe is the responsibility of the entire community. PIP aims to build strong communities that
protect children and connect them to form an effective statewide movement. The PIP model is built
on collaboration between, and among, State and local organizations. Local teams expand on
available prevention services by delivering educational programs, hosting networking
opportunities, and facilitating positive community events with mini-grants.
Circle of Parents is a national network of parent-led social support groups where parents and
caregivers share ideas, celebrate successes, and address the challenges surrounding parenting.
Since West Virginia launched Circle of Parents in 2012, 14 organizations have participated in
two-day training workshops. All participating organizations have started, or have plans to start,
groups in various parts of the State.
This evaluation report reflects the findings from West Virginia Family Surveys collected from
October 1, 2017 to September 30, 2018. Surveys were submitted by caregivers who participate
in In-Home Family Education, Family Resource Center, and Partners in Prevention programs across
the State and funded through CBCAP grants.2 The information here can be used by grantees and
state administrators to plan programs, identify areas in need of improvement and understand
how programs are helping parents.
2
No data were submitted for participants from Circle of Parents.
West Virginia Family Survey Annual Report 2018
Page 2
METHODOLOGY
West Virginia’s child abuse prevention grantees are required to administer the West Virginia
Family Survey to families who participate in their programs and use the information as part of
their continuous quality improvement processes. The survey helps the State measure the same
information across all prevention programs, providing relevant feedback that is immediately
applicable. Programs are also expected to examine survey results to understand what changes
the families have experienced from program enrollment to discharge. The West Virginia Family
Survey helps programs to:
•
describe the population(s) served;
•
examine protective factors across five domains, particularly those domains
targeted by the program;
•
review and understand families’ perceptions of the program and its services; and
•
consider the protective factors domains and areas of programming that need more
focus.
Families are asked to complete the West Virginia Family Survey upon enrollment (pre-surveys), at
discharge, or annually for those who continue to participate in a program for longer than one
year (follow-up or post-surveys). HZA helped West Virginia develop the tool and assists in
administering it in a flexible manner, enabling the programs to offer families the ability to
complete surveys on paper or online.
WEST VIRGINIA FAMILY SURVEY COMPONENTS
The Family Survey was designed to be as simple as possible for both the programs and the
families who are asked to participate. To that end, the instrument incorporates programs’ existing
assessments and evaluation requirements, and has been integrated into the existing enrollment
and ongoing assessment procedures of most programs. Sections of the survey include:
•
Family Information: This section includes basic demographic information as shared
by the participant, including the number and ages of children in the home. This
information is collected from all participants on both enrollment and follow-up
surveys.
•
Protective Factors Survey: The Protective Factors Survey (PFS) component includes
twenty standard statements, each with a seven-point scale of agreement or
frequency (with one being the worst possible score and seven being the best
possible score). The questions address each of the five protective factor domains.
These questions are completed only by families enrolled in ongoing programs
offered through FRC and IHFE programs. The PFS is described in more detail in the
next section.
•
Modified Protective Factors: This survey provides a shortened version of the PFS,
asking just ten questions based on the five domains. This modified tool is completed
by families participating in short-term or one-time events, generally through PIP
programs.
West Virginia Family Survey Annual Report 2018
Page 3
•
Program Satisfaction: Six statements are included on follow-up surveys to measure
program satisfaction and caregivers’ perceptions. Two open-ended questions ask
participants what they like most about the programs they were engaged and what
they would like to see changed.
•
Playgroup: On follow-up surveys, eight questions are asked of caregivers who
either have a home visitor or attend another program that offers regular
playgroups.
•
Home Visiting: On follow-up surveys, eight questions are asked of caregivers who
have had a home visitor.
PROTECTIVE FACTORS
An important component of the West Virginia Family Survey is the Protective Factors Survey,
developed by the FRIENDS National Resource Center for Community-Based Child Abuse
Prevention and the University of Kansas Institute for Educational Research and Public Service.
Protective factors refer to families’ strengths and the supports available to them which mitigate
risk factors of child abuse and neglect. Child abuse prevention programs work to build on
families’ individual protective factors and provide programming and education in areas where
families’ capacities could be improved. The PFS helps service providers identify areas where
families need additional support, i.e., where they may be scoring lower on the tool. Table 1,
created by the FRIENDS National Resource Center, summarizes the protective factors covered in
the survey.3
Table 1: Protective Factors
Protective Factor
Definition
Family Functioning and
Resiliency
Having adaptive skills and strategies to persevere in times of crisis. Family’s
ability to openly share positive and negative experiences and mobilize to
accept, solve and manage problems.
Social Emotional Support
Perceived informal support (from family, friends and neighbors) that helps
provide for emotional needs.
Concrete Support
Perceived access to tangible goods and services to help families cope with
stress, particularly in times of crisis or intensified need.
Child Development and
Knowledge of Parenting
Understanding and utilizing effective child management techniques and having
age-appropriate expectations for children’s abilities.
Nurturing and Attachment
The emotional tie along with a pattern of positive interaction between the parent
and child that develops over time.
This report analyzes the average protective factors scores which are calculated for each of the
five domains. The first step is to calculate an average score using each participant’s responses to
each question in a domain which are scored on a scale of one to seven by the participant. These
scores are added and then divided by the total number of questions in a domain (which range
3
See />
West Virginia Family Survey Annual Report 2018
Page 4
from three to five questions). Scores are not calculated for participants who skip more than one
question in a domain. The overall averages presented in this report are calculated by adding all
participants’ scores and dividing by the total number of participants with a score. Higher average
scores indicate that participants are reporting behaviors associated with protective factors.
MEASURING CHANGES IN PROTECTIVE FACTORS SCORES OVER TIME
To determine changes in families’ protective factors over time, HZA analyzes the average
protective factor scores by domain of those participants who have completed both an enrollment
and a follow-up survey. Caregivers’ pre- and post-surveys were matched and used to examine
the differences in families’ protective factors between their enrollment and most recent survey. The
differences are examined for direction (whether scores went up or down) and tested for statistical
significance. The differences are considered statistically significant if the probability they are due
to random chance is less than 5 percent. In addition to the average scores of all respondents,
scores are examined based on families’ characteristics to determine if the programs are more
effective with some types of families than others.
Respondents are also identified as having protective factors scores which improved, worsened, or
stayed about the same from enrollment to follow-up. Respondents’ scores are considered to have
improved or worsened if their post-test protective factor score is greater than or less than their
pre-test score by at least 1.0; this ensures that slight fluctuations in scores are not interpreted as
meaningful change. If a post-test score is at least 2.0 greater than or less than the pre-test score
then this is categorized as greatly improved or greatly worsened, respectively.
When families participate in more than one program within an organization, caregivers complete
a single survey at service enrollment, follow-up, and discharge, and are instructed to complete it
as if they are receiving services from a single program. This is to reduce confusion and the burden
of completing multiple surveys.
2018 SURVEYS
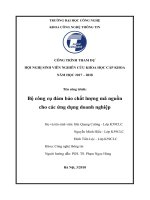
In total, West Virginia Family Surveys were collected from 981
CBCAP participants between October 1, 2017 and September
30, 2018. As shown in Figure 1, the majority of surveys were
completed by IHFE participants (62%). In comparison, fewer
surveys were completed by FRC (10%) and PIP (28%)
participants.
Figure 1. Surveys Completed by Program Type
981
PIP
28%
FRC
10%
IHFE
62%
Surveys Completed by
CBCAP Program
Participants in
FY2018
West Virginia Family Survey Annual Report 2018
Page 5
100%
OF CBCAP FAMILIES HAVE CHILDREN IN THEIR HOUSEHOLD
West Virginia Family Survey Annual Report 2018
Page 6
FAMILY CHARACTERISTICS
All caregivers who complete the West Virginia Family Survey respond to a series of questions
about themselves and their family. Prevention providers and administrators can use this
information to describe who their programs serve, target services to specific populations, and
identify new service needs. In addition, the characteristics of the families served during the year
are compared to West Virginia’s overall population using data from the 2011–2015 American
Community Survey estimates collected by the U.S. Census (2016) to determine if certain groups
use these services more than others.
In some ways, the demographics of program participants are similar to the State’s overall
population. Nearly all identified as white (94% among CBCAP participants and 94% in the
state), most had at least a high school diploma or GED (88% versus 85% statewide), and about
half were married in both groups. In contrast, CBCAP serves mostly women (97%) and more than
two-thirds have incomes below $30,000, while the median income in the state is $41,751. A more
detailed breakdown of the demographics of CBCAP families is presented in Table 2.4
Table 2. About CBCAP Caregivers
Gender
% Education Level
% Marital Status
Female 97%
Elementary/Junior High/ 1%
Married
middle school
Male 3%
Some High School 11%
Single
%
50%
High School Diploma or 34%
Partnering
GED
Some College/ 24%
Divorced
Vocational training
2-year college degree 8%
Separated
4-year college degree 8%
Widowed
(Bachelor's)
Master's Degree or higher 3% Family Income
Currently a Student 11%
$0-$10,000
19%
$10,001-$20,000
18%
$20,001-$30,000
$30,001-$40,000
15%
7%
Employed part-time 18%
$40,001-$50,000
Seasonal/temporary work 2% More than $50,001
6%
18%
Race/Ethnicity
%
White 94%
African American
Asian
3%
1%
Hispanic 1%
Native American/ <1%
Alaska Native
Native Hawaiian/ <1%
Employment Status
Pacific Islander
Other <1%
Not employed 58%
Employed full-time 22%
Housing
%
Own 44%
Rent 36%
Share w/ relatives/friends 18%
Temporary/Homeless 2%
25%
4%
2%
1%
37%
Note that due to rounding and some questions that ask to “check all that apply,” percentages may not sum to 100
percent.
4
West Virginia Family Survey Annual Report 2018
Page 7
CHILDREN SERVED BY CBCAP
Overall, 100 percent of CBCAP families have children in their household (compared to 86% in
fiscal year 2017). Families reported children in their homes range from being newborn to age 21.
Sixty-nine percent of the children were five years or younger and 10 percent of caregivers were
pregnant.
FAMILIES’ NEEDS
The Family Survey also looks at the types of financial assistance that families receive (Figure 2).
This information can help the State and its community partners better understand the challenges
that families face and other supports in which they participate. Nearly half of caregivers (48%)
said they received Medicaid, compared to 29 percent of the general population receiving health
insurance through the program (Kaiser Family Foundation, 2017). The second most common form
of assistance was food assistance, with just under half of those surveyed participating in food
stamps or the Women, Infant and Children (WIC) supplemental nutrition program. About one in
five West Virginia residents receive benefits through these two food programs monthly (USDA,
2017; West Virginia WIC, 2017), indicating that CBCAP participants are more likely to receive
one of the benefits compared to the population overall. Sixteen percent of caregivers said they
had not received any financial assistance.
Figure 2. Financial Assistance Participation
Medicaid (Adult)
48%
Food Stamps/EBT
40%
Women, Infants, and Children (WIC)
42%
Child Health Insurance Program (CHIP)
Supplemental Security Income (SSI)
13%
8%
Earned Income Tax Credit
6%
Head Start/Early Head Start
7%
Assistance with Heat, Water, and/or Electric
Temporary Assistance for Needy Families (TANF)
None of the above
6%
5%
16%
West Virginia Family Survey Annual Report 2018
Page 8
COMPARING PIP, IHFE AND FRC PARTICIPANTS
Looking at the different demographic characteristics of PIP, IHFE and FRC programs’ participants,
there is some variation, indicating that there may be differences in who is reached by each type
of program. PIP events appear to have more male participants than do the other programs. This
is of particular interest because fathers are one of the target groups for CBCAP-funded
programs. It may be beneficial for PIP programs to share information about how they are
engaging parents so that other programs can determine if they can adopt similar strategies to
engage targeted populations. A much higher proportion of FRC participants are married, own a
home and have incomes above $50,000 than families in the other two types of programs. See
Figure 3 for more detail.
Figure 3. Demographic Differences between IHFE, PIP and FRC Participants
Percentage of caregivers who are…
Males
IHFE
5%
PIP
FRC
9%
8%
Married
46%
55%
71%
Own a home
40%
53%
73%
Earn $50k or more
13%
18%
47%
While the race and ethnicity, level of education and marital status of CBCAP participants are
similar to the overall population, CBCAP programs appear to be reaching families who are more
economically vulnerable, as observed in the high proportion of families with incomes below
$30,000 and families who receive state or federal financial assistance. In addition, there is
variation in the characteristics of families reached by the three types of programs (IHFE, PIP and
FRC), with PIP and FRC reporting more male participants than IHFE and FRCs serving more
caregivers that are married, own a home, and earn $50,000 or more. As we move into the
examination of how caregivers’ protective factors changed, the report will look at which groups
of families had greater improvements.
West Virginia Family Survey Annual Report 2018
Page 9
FRC Events
SERVE MORE PARTICIPANTS OF HIGHER ECONOMIC STANDING
West Virginia Family Survey Annual Report 2018
Page 10
OVERALL PROTECTIVE FACTORS RESULTS
The goal of the protective factors analysis is to describe changes in families’ protective factors
that have resulted since they began participating in a CBCAP funded program. Average scores
among those who completed both a pre- and post-survey are compared along with the
proportion of families whose scores improved, worsened, or stayed the same. A total of 344
families had a survey completed during fiscal year 2018 that could be matched to an enrollment
survey. In later sections, protective factors scores will also be examined by program type.
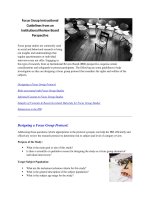
Figure 4 shows the average domain scores for all participants with matched surveys. The domain
with the highest scores overall was Nurturing and Attachment, while the Family Functioning and
Resiliency domain had the lowest scores on pre- and post-surveys. Family Functioning and
Resiliency questions ask caregivers how they cope with stress and communicate with other family
members when issues arise. These are important skill sets to be used in challenging situations that
can help reduce the risk of child abuse and neglect.
Figure 4: Average Scores Before and After Involvement (n=344)
6.10
6.10
Child Development & Parenting
6.36
6.24
Concrete Support
5.89
5.84
Family Functioning & Resiliency
6.68
6.70
Nurturing & Attachment
6.27
6.21
Social Emotional Support
Average Score (ranges from 1–7)
Post
Pre
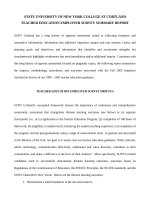
Moving from an examination of change in average protective factor scores to the number of
participants whose scores changed, Figure 5 shows the proportion of families whose scores
improved, worsened and stayed the same in each domain.
West Virginia Family Survey Annual Report 2018
Page 11
The domains with the highest proportions of families demonstrating improvement were Concrete
Support (18% improved) and Family Functioning and Resiliency (17% improved). Interestingly,
these two domains also had higher proportions of families whose scores worsened (both at 14%).
Enrollment scores for the Nurturing and Attachment domain are historically very high, which is
likely why the majority of families did not show improvement in that domain. CBCAP programs
can use this information to examine how they are working with families and the strategies they
are using to build particular protective factors and family strengths.
Figure 5: Changes in Families’ Protective Factors Scores
Child Development & Parenting 2%
13%
73%
Concrete Support 4% 10%
Family Functioning &
Resiliency
5%
68%
9%
Minimal Change
7%
4% 1%
73%
Worsened
7%
10%
89%
Social Emotional Support 4% 10%
2%
11%
70%
Nurturing & Attachment 1% 5%
Greatly Worsened
10%
7%
Improved
West Virginia Family Survey Annual Report 2018
Greatly Improved
Page 12
6%
PROGRAM PERCEPTIONS
The West Virginia Family Survey offers the opportunity to get useful feedback from participants
about their experience in CBCAP-funded programs. Program administrators can use this
information to inform efforts to improve the quality of the services that are offered. On follow-up
surveys, caregivers are asked a series of questions aimed to capture the extent to which they feel
staff treat them with respect, programs provide the help they need, and families are included in
the planning and implementation of programming. In addition, more specific questions are asked
of those families that participate in ongoing playgroups.
Overall, CBCAP participants view the funded programs positively. As shown in Figure 6, the vast
majority agreed that staff respected them, that they were comfortable expressing their problems,
and that program materials were helpful.
Figure 6. Participants’ Perceptions of CBCAP Programs (n=419)
I feel the staff respect me. 3%1%
I feel comfortable discussing my
4% 1%
concerns with staff.
The materials I receive are helpful. 3%2%
I am asked for my ideas and
2%
4%
opinions.
My ideas and opinions are
4% 5%
included in the program.
21%
75%
26%
69%
26%
68%
36%
31%
This program has helped me
3%4%
improve my parenting skills.
60%
39%
The program helped me set and
4% 4%
reach a parenting goal.
0%
59%
54%
39%
20%
52%
40%
Strongly Disagree/Disagree
60%
Neutral
80%
Agree
100%
Strongly Agree
Nine percent of clients disagreed or were neutral about whether their ideas and opinions were
included. A similar percentage (8%) of participants were neutral on or disagreed that programs
helped them set and reach a parenting goal. While programs overall appear to be doing well on
these measures among most participants, there is room for improvement. Staff at CBCAP-funded
programs can use their internal continuous quality improvement processes to explore ways in
which they are involving parents in activities, determine if there is a need to strengthen those
efforts, and get additional feedback from clients about what additional parenting support they
may need.
West Virginia Family Survey Annual Report 2018
Page 13
PLAY GROUPS
Playgroups are facilitated through IHFE and FRC programs in West Virginia. Just over half of the
participants who completed a follow-up survey (59%) attended at least one playgroup, most
often through a home visiting program. The West Virginia Family Survey asks parents about the
groups’ accessibility and helpfulness, the results of which are found in Figure 7. Over threequarters of the parents reported that playgroups are held in places that are easy to attend.
Seventy-three percent of participants also agreed that the topics were interesting and that the
information and support provided in playgroups was useful.
Figure 7. Participants’ Perceptions of Playgroups (n=348)
Playgroups are held at a place that is
easy to attend.
5%
The topics and activities offered during
4%
playgroup are interesting to me.
I get helpful information and support
4%
from playgroups.
Playgroups are held at a time that is
easy for me to attend.
8%
26%
17%
24%
23%
21%
52%
48%
25%
25%
48%
30%
Strongly Disagree/Disagree
41%
Neutral
Agree
Strongly Agree
While the majority of participants perceive playgroups positively, 29 percent responded that
they disagreed or were neutral toward the statement “Playgroups are held at a time that is easy
for me to attend.” This shows that while the groups are held in locations that are easy to attend
and helpful for most participants, there is room for improvement around ensuring the timing is
convenient for parents.
Overall West Virginia’s CBCAP programs are perceived positively by most parents. Nearly all
respondents said that staff treated them with respect and that they trusted staff members. In
addition, the majority of playgroup participants said they enjoy the activities offered and that
the information shared was helpful.
Areas in which programs may look to improve include using participant feedback in programs
and helping parents improve their parenting skills and setting parenting goals. The data
represented a small but noticeable proportion of families which did not endorse those statements
on surveys. At the program level, community programs which offer playgroups might consider
changing the times in which they are held which may yield greater participation.
West Virginia Family Survey Annual Report 2018
Page 14
IN-HOME FAMILY EDUCATION EVALUATION RESULTS
In-Home Family Education (IHFE) programs provide early childhood home visiting services. Each
IHFE program solicits feedback from families to identify what changes might be needed and the
areas in which programs are helping families. Three home visiting models are used by IHFE
programs in West Virginia: Healthy Families America, Parents as Teachers, and Maternal Infant
Health Outreach Workers. The Family Survey captures information on caregivers’ protective
factors, assessment tools used during home visits and impressions of home visitors. Protective
factors results are broken out by model to examine the differences in changes in each domain by
curriculum and to identify areas in which program participants may need more support.
A total of 305 surveys were completed by participants from home visiting programs this year
which could be matched to a previous enrollment survey. These surveys were thus included in the
protective factors analysis. Table 4 shows the total number of valid surveys returned by curriculum
model.
Table 4. Matched Surveys Submitted by Home Visiting Model
Curriculum/Model
Matched Surveys
Healthy Families America
50
Maternal Infant Health Outreach Workers
66
Parents as Teachers
189
TOTAL
305
PROTECTIVE FACTORS RESULTS
Looking first at average protective factors scores by domain, results are similar to those seen
statewide (Table 5). Scores were high on both pre- and post-surveys, averaging close to 6.0 in all
domains. The domain with consistently lower scores was Family Functioning and Resiliency.
However, overall home visiting participants’ scores showed minimal change at follow-up. Slight
increases in average scores were seen in all domains except Nurturing and Attachment, which was
rated highest on both the pre- and post-surveys.
Looking more specifically at the surveys among those who participated in HFA, MIHOW and PAT,
changes were not substantial, and slight decreases were even present for some domains across
the home visiting program models.
West Virginia Family Survey Annual Report 2018
Page 15
Table 5. Average Scores for IHFE Programs
Domain
Protective Factors Scores (Ranges for 1–7)
All IHFE
HFA
MIHOW
PAT
Pre
Post
Pre
Post
Pre
Post
Pre
Post
Child Development & Parenting
6.1
6.2
6.4
6.3
6.0
5.9
6.1
6.2
Concrete Support
6.3
6.4
6.2
6.4
6.0
6.2
6.3
6.5
Family Functioning & Resiliency
5.8
5.9
6.0
5.6**
5.4
5.7
5.8
5.9
Nurturing & Attachment
6.7
6.7
6.8
6.8
6.6
6.5
6.7
6.7
Social & Emotional Support
6.2
6.3
6.3
6.5
5.8
5.9
6.2
6.3
Figure 8 shows the proportion of families who participated in an IHFE program overall and by
model whose protective factors scores improved. When the specific IHFE models are examined, a
relatively small proportion of families showed improvement. The domain with the most IHFE
participants improving was Concrete Support, where 19 percent of the families overall either
improved or greatly improved. There was, however, variation across domains with specific home
visiting models. For instance, 27 percent of the families who participated in a MIHOW program
either improved or greatly improved in the Family Functioning and Resiliency domain compared
to only 12 percent who participated in an HFA program. However, MIHOW and HFA both did
well in the Concrete Support domain, with improvement shown respectively in 23 and 22 percent
of participants. The variation suggests that different IFHE program models excel at addressing
specific needs and improvement may be warranted in addressing other needs.
Figure 8. Percent of IHFE Participants whose Protective Factors Scores Improved by Domain
4%
Nurturing & Attachment
5%
5%
5%
11%
12%
12%
12%
Child Development & Parenting
16%
Concrete Support
19%
13%
14%
Social Emotional Support
23%
22%
18%
15%
16%
Family Functioning & Resiliency
12%
0%
5%
10%
27%
17%
15%
PAT
20%
25%
30%
MIHOW
HFA
All IHFE
West Virginia Family Survey Annual Report 2018
Page 16
Overall the analysis of the protective factors scores among caregivers receiving home visiting
services showed mixed results. Nonetheless, scores were generally high to start, with families
typically averaging close to 6.0 on the 7.0 scale in almost all domains. Starting with such high
scores makes it difficult to show improvement over time. Across the three models, MIHOW
participants appear to have benefitted the most, with higher proportions of caregivers who
improved in almost all domains compared to families in HFA or PAT.
SCREENING AND ASSESSMENT
Providing child development information and screening is an important component of the home
visitor’s work. Almost all home visiting participants (96%) reported that their home visitor used a
screening tool to help them understand their child’s strengths and abilities. Nearly three-quarters
(74%) said that the screening process helped them address areas of concern for their child’s
development.
PERCEPTIONS OF HOME VISITING
Figure 9 summarizes feedback from the families about their home visiting experiences. Overall,
families agreed that home visits were held at convenient times and that home visitors helped
share information about parenting, community resources, the importance of reading, and how to
use positive discipline.
Figure 9. Caregivers’ Perceptions of Home Visiting
My home visitor…
Holds visits at times that are convenient 3% 1% 15%
81%
Helps me understand the importance of books and
2%1% 16%
reading
81%
Helps me know how to use positive guidance and
2% 2%
discipline
18%
78%
Helps me understand how my child grows and learns 2%1%
18%
79%
Connects me with useful community resources 2% 2% 16%
80%
Strongly Disagree/Disagree
Neutral
Agree
Strongly Agree
Families clearly value IHFE programs and the use of assessments shows that home visitors are
using the identified tools to determine families’ needs and provide targeted services. The PFS
results show that families have high levels of skills and behaviors associated with protective
factors at both enrollment and follow-up.
Providing IHFE professionals with opportunities to explore and compare the strategies they use to
help families improve functioning and resiliency may help them identify what is working or where
practice can be improved to support families in all programs and models.
West Virginia Family Survey Annual Report 2018
Page 17
THE VAST MAJORITY OF PROGRAM PARTICIPANTS FIND HOME VISITS
CONVENIENT AND HELPFUL
West Virginia Family Survey Annual Report 2018
Page 18
FAMILY RESOURCE CENTERS
Family Resource Centers are organizations that bring together existing early care and education,
and prevention services at one location. They increase the accessibility of services, combine
resources and content-area expertise, and provide family support and education within each
community’s unique context. While FRCs do not have program-specific questions on the West
Virginia Family Survey, this section describes the results of the analysis of caregivers’ protective
factors. This information can be used by statewide and local program staff to identify areas
where families may need additional support and domains in which there have been
improvements.
Among FRC participants, average scores increased in Concrete Support and Nurturing and
Attachment, two out of the five protective factors domains. On both enrollment and follow-up
surveys, scores were highest in the Nurturing and Attachment domain (from 6.5 at enrollment to
6.6 at follow-up).
While average scores generally showed minimal change, some families participating in FRCs did
see improvements. Figure 10 shows the proportion of families whose scores improved by domain.
The domain with the largest proportion of families who improved was Concrete Support (11%).
Child Development and Parenting had the most parents whose scores worsened (18%).
Figure 10. Changes in Families’ Protective Factors Scores
Social Emotional Support
Nurturing & Attachment
Family Functioning & Resiliency
7%
7%
84%
5%
88%
5% 2%
5% 2%
76%
16%
Greatly Worsened
7%
86%
Concrete Support 4% 9%
Child Development and Parenting 2%
2%
7% 4%
75%
Worsened
Minimal Change
7%
Improved
West Virginia Family Survey Annual Report 2018
Greatly Improved
Page 19
Programming staff at FRCs should look at the ways in which they are trying to promote families’
protective factors and gather feedback from participants on how the programs are, or are not,
helping them. This will help them identify ways that programs can be strengthened to promote
protective factors and reduce risk factors of abuse and neglect. This will be critical since, overall,
the results of the protective factors analysis among families who participated in FRC programs
showed little change in scores.
IMPROVEMENT WAS SHOWN IN
CONCRETE SUPPORT
FOR 11 PERCENT OF FAMILIES WHO PARTICIPATED IN FRC PROGRAMS
West Virginia Family Survey Annual Report 2018
Page 20
PARTNERS IN PREVENTION PROGRAMS
Programs that receive funding from PIP organize community-building and local prevention
activities. Some offer multi-day workshops or parenting groups, while others host community baby
showers or other special events focused on literacy or early learning experiences. While
caregivers who participate in multi-day PIP events complete pre- and post- surveys, only 12 such
surveys were collected this year, none of which could be matched to a previous survey to examine
changes in protective factors. For families attending one-time events, a modified PFS is used to
gather information about the degree to which the event helped them understand an area or skill
within each protective factor domain. This section describes the results of surveys collected through
PIP one-time event surveys. See Appendix B for an example of the modified protective factors
questions.
The modified PFS asks ten questions
which correspond to each of the five
protective factors domains and two
additional questions regarding the
events’ helpfulness. Responses to the
PIP surveys were positive, with most
caregivers agreeing that the sessions
helped them understand how to help
their children learn (76%) and make
good decisions for their children
(69%).
74%
said a PIP program
will help improve
parenting skills
76%
said PIP materials
were helpful
Looking more closely at the protective
factors questions, caregivers are first
asked what topics are covered at
events. Sessions appear to help most
parents build a variety of skills. The most commonly reported skill areas of focus at PIP events
were understanding how to help children learn, becoming closer to children, and making decisions
that are good for children; these topics stretch into the Child Development and Parenting, Concrete
Support, and Nurturing and Attachment domains.
Figure 11 shows the extent to which caregivers said PIP events provided help in each of the ten
skills on the modified PFS, broken out by the five protective factors domains. The majority of
caregivers said the events helped them a great deal or were extremely helpful across all of the
domains.
West Virginia Family Survey Annual Report 2018
Page 21